

Abstract
Promiscuous gene expression (PGE) by thymic epithelial cells (TEC) is essential for generating a diverse T cell antigen receptor repertoire tolerant to self-antigens, and thus for avoiding autoimmunity. Nevertheless, the extent and nature of this unusual expression program within TEC populations and single cells are unknown. Using deep transcriptome sequencing of carefully identified mouse TEC subpopulations, we discovered a program of PGE that is common between medullary (m) and cortical TEC, further elaborated in mTEC, and completed in mature mTEC expressing the autoimmune regulator gene (Aire). TEC populations are capable of expressing up to 19,293 protein-coding genes, the highest number of genes known to be expressed in any cell type. Remarkably, in mouse mTEC, Aire expression alone positively regulates 3980 tissue-restricted genes. Notably, the tissue specificities of these genes include known targets of autoimmunity in human AIRE deficiency. Led by the observation that genes induced by Aire expression are generally characterized by a repressive chromatin state in somatic tissues, we found these genes to be strongly associated with H3K27me3 marks in mTEC. Our findings are consistent with AIRE targeting and inducing the promiscuous expression of genes previously epigenetically silenced by Polycomb group proteins. Comparison of the transcriptomes of 174 single mTEC indicates that genes induced by Aire expression are transcribed stochastically at low cell frequency. Furthermore, when present, Aire expression-dependent transcript levels were 16-fold higher, on average, in individual TEC than in the mTEC population.
T cell-mediated responses are essential in providing protective immunity but depend on an acquired ability to discriminate between foreign and self-antigens. This capacity is instructed during T cell development in the thymus by populations of cortical and medullary thymic epithelial cells (TEC) (Holländer et al. 2006). Cortical TEC (cTEC) provide signals that commit hematopoietic precursors to a T cell fate and positively select immature T cells (thymocytes) that express a functionally competent T cell receptor (TCR) for further differentiation. Following migration to the medulla, thymocytes are further selected by medullary TEC (mTEC). T cells with a high affinity TCR for self-antigens are deleted whereas those with a TCR of intermediate affinity are diverted to a regulatory (Treg) fate. These mechanisms of clonal deletion and clonal diversion ensure that only thymocytes with low self-affinity will differentiate into effector T cells (Teff) and hence establish central tolerance of self.
In order to assess T cell self-reactivity, cTEC and mTEC express and present hundreds of peripheral tissue-restricted antigens (TRA) (Derbinski and Kyewski 2010; Anderson and Takahama 2012). The diverse expression of TRA by TEC contrasts with the tight spatio-temporal control of gene expression observed in peripheral tissues during pre- and post-natal development and is conceptually referred to as promiscuous gene expression (PGE). PGE is believed to be broader in mTEC than cTEC, and is positively correlated with mTEC differentiation (Derbinski et al. 2005). Importantly, estimates that mTEC promiscuously express up to 3000 TRA also implied that many thousands of additional genes would not be expressed in TEC and consequently not employed for the screening of T cells reactive to self (Kyewski and Derbinski 2004).
Currently, the relative contributions of TEC, migratory dendritic cells, and mechanisms of peripheral tolerance to the avoidance of autoimmunity are poorly understood (Bonasio et al. 2006; Hadeiba et al. 2012; Xing and Hogquist 2012). It is also unclear whether the TCR repertoire of thymocytes needs to be selected against all or, alternatively, against only a specific subset of self-antigens in order to effectively establish central tolerance. To answer these questions, it is essential to first determine the identity of all self-antigens promiscuously expressed by TEC because this would define the extent and resolution of self-tolerance mediated by these cells. Similarly, analysis of the nature of PGE in cTEC would be crucial for the understanding of the initial positive selection of thymocytes and may also be relevant for understanding their post-thymic homeostasis.
Distinction of PGE in TEC from the transcriptional programs in peripheral tissues (Villaseñor et al. 2008) appears to depend for some TRA on an as yet only incompletely understood mechanism involving the nuclear protein Autoimmune regulator (AIRE) (for review, see Mathis and Benoist 2009). This mechanism is as ancient as the adaptive immune system itself, because Aire has now also been identified in all classes of jawed vertebrate following its recent discovery in cartilaginous fish (Venkatesh et al. 2014). In humans, AIRE is primarily expressed in mTEC and its loss-of-function mutations cause the autoimmune polyendocrine syndrome type-1 (APS-1; OMIM #240300), which is marked by the survival and thymic export of self-reactive Teff cells (Mathis and Benoist 2009). Consequently, the syndrome is characterized by severe organ-specific autoimmunity typically affecting parathyroid chief cells, steroidogenic cells of the adrenal cortex, pancreatic β-cells, gastric parietal cells, skin melanocytes, hepatocytes, gonads, and the lung (Shikama et al. 2009; Shum et al. 2013).
Within the mTEC lineage, the role of Aire in facilitating PGE has not yet been precisely assessed (Anderson et al. 2002). Although microarray analyses of mature (MHCIIhi) mTEC revealed 1343 genes regulated by Aire expression that represent many tissues of the body (Venanzi et al. 2007), these approaches are compromised both by the heterogeneity of mature mTEC, of which only half express Aire, and by a limitation of microarray technology, specifically that this method is prone to cross-hybridization artifacts that make confident detection of lowly expressed genes difficult (Gardner et al. 2008; Mortazavi et al. 2008). Furthermore, while limited analyses have argued that AIRE acts stochastically (Derbinski et al. 2008; Villaseñor et al. 2008), a genome-wide analysis of both PGE extent and diversity at the single-cell level has not been previously undertaken.
A complete mapping of the PGE program in individual TEC subsets should yield insights into molecular mechanisms that underlie this process. Presently, these remain largely unknown with the notable exception of the involvement of AIRE which interacts with proteins involved in chromatin structure, DNA damage response, gene transcription, and RNA processing (Abramson et al. 2010; Gaetani et al. 2012). Currently, AIRE is understood to act by recruiting the positive transcription elongation factor b (P-TEFb) to inactive genes at which stalled RNA polymerase II (Pol II) is already present (Zumer et al. 2013). The functions of the various domains of AIRE have been the focus of several studies, with the second plant homeodomain (PHD2) and the C-terminal domain having been shown to be critical for the transactivation of target genes (Meloni et al. 2008).
The mechanism by which AIRE is targeted to particular genomic locations is only incompletely understood but is thought to involve the PHD1 domain of AIRE directly recognizing unmethylated H3K4 (H3K4me0), a histone mark characteristic of inactive promoters (Koh et al. 2008; Org et al. 2008). However, while this interaction is crucial for targeting in vitro (Zumer et al. 2012), abolition of this interaction in vivo only dampened the impact of AIRE without affecting its transcriptional range (Koh et al. 2010). Recently, a role for DNA-dependent protein kinase (PRKDC) in the targeting of AIRE to inactive promoters has been described (Zumer et al. 2012), suggesting that other known AIRE interaction partners (Abramson et al. 2010; Gaetani et al. 2012) may also play important roles in this process.
To address these issues, we performed deep transcriptome sequencing to reveal the extent and character of PGE within distinct TEC subpopulations and within single mature TEC. The digital nature and increased dynamic range of RNA-seq permit a more precise assessment of the number of genes expressed by particular cell types and tissues. While RNA-seq has shown tissues to express on average as few as 8000 or as many as ∼13,500 genes (Ramsköld et al. 2009), this technology has not yet been applied to specific TEC subsets (St-Pierre et al. 2013) or individual TEC. Here, we analyze PGE in cTEC and specific mTEC subsets, precisely identifying the pattern of genes expressed by either all or individual TEC subsets and relate these results to thymic selection. Based on the results of in vivo chromatin state analysis, we suggest that AIRE targets and induces the expression of genes epigenetically silenced by Polycomb group proteins. Analysis of single mTEC transcriptomes revealed Aire expression-regulated gene transcription to be an apparently stochastic, low frequency phenomenon. When transcribed, genes regulated by Aire expression have substantially higher levels in individual cells than those indicated by population analyses.
Results
Isolation of Aire-positive and -negative TEC subpopulations
The subset of mature mTEC that express Aire cannot be distinguished by known specific cell surface markers (Anderson et al. 2002; Mathis and Benoist 2009). To specifically assay the transcriptomes of Aire-positive and -negative mTEC, we therefore generated a novel mouse line (designated AireGFP/+) that expresses the enhanced green fluorescent protein (GFP) under the transcriptional control of the endogenous Aire locus (Fig. 1A). In AireGFP/+ mice, GFP expression was restricted to mTEC that mostly co-expressed Aire as identified by immunohistochemistry (Fig. 1B) and by high cell surface concentrations of MHC class II molecules as verified by flow cytometry (Supplemental Figs. 1, 2A). We inspected residual transcription from the modified Aire locus and confirmed it to be largely limited to the unmodified 5′ UTR (Supplemental Fig. 2B). These results demonstrated the utility of AireGFP/+ mice in enabling the isolation of distinct mature mTEC subsets that differ in their Aire expression.
Figure 1.

Generation of AireGFP/+ mice. (A) The genomic Aire locus (top), with the targeting construct (middle), and the targeted locus (bottom). Red rectangles with numbers indicate exons and black triangles indicate loxP sites. The PGK neo cassette in the targeting construct is followed by triple poly(A) signals to prevent further transcriptional elongation. (B) Immunofluorescence analysis of thymus sections of AireGFP/+ mice for GFP (green) and AIRE (red). (C) The basic scheme of TEC differentiation and the identification of individual TEC populations. Seven (1–7) distinct TEC populations were sorted from thymic tissue isolated from wild-type C57BL/6, AireGFP/+, and AireGFP/GFP mice (Supplemental Table 1; Supplemental Fig. 1). To ensure that the distinct mTEC subsets had fully differentiated during post-natal maturation in the presence of regular thymopoiesis and that these cells were sufficiently abundant for analysis (Irla et al. 2008), we collected the diverse mTEC populations from 4-wk-old animals, whereas cTEC and total mTEC were sorted from mice at 1 wk of age.
Transcriptomic analysis of TEC reveals the full extent of PGE
We sequenced the transcriptome of two biological replicates for each of seven FACS-sorted TEC populations (Methods; Fig. 1C; Supplemental Fig. 1; Supplemental Table 1) yielding an average of 39.5 (31.3–42.9) million mapping reads per sample. Employing a novel local false discovery rate (FDR) approach that enables a per-gene estimate of expression probability (Supplemental Fig. 3), we discovered that the assayed cTEC and mTEC populations expressed 84% and 89%, respectively, of Ensembl (Flicek et al. 2013) protein-coding genes (Fig. 2A; Supplemental Table 2). Comparable results were obtained using a previously described global FDR approach (Supplemental Fig. 3E; Ramsköld et al. 2009). Notably, the expression of many genes was much stronger in mTEC than in cTEC (Fig. 2B). Across a range of FPKM thresholds, the TEC subtypes clearly separated into three groups based on the numbers of genes they expressed: (i) mature mTEC expressing Aire, (ii) immature mTEC and mature mTEC lacking Aire expression, and (iii) cTEC (Fig. 2B).
Figure 2.

RNA-seq analysis reveals the full extent of PGE in TEC. (A) The number of genes detected in each FACS sorted TEC population at a local FDR of 5% (see Methods; Supplemental Fig. 3; Supplemental Table 2) as a function of read depth (pooled replicates) indicates that read depth was not limiting for most of the TEC populations. (B) The number of genes detected in the TEC populations at different FPKM thresholds. The left-hand start of the solid lines indicates the expression level that corresponds to a local FDR of 5% for a given TEC population (see also Supplemental Fig. 3C). The vertical blue dashed line indicates the FPKM at which genes can be reliably detected in all TEC types (numbers of genes detected at this threshold are shown in inset). (C) Selected GO categories enriched in genes not detected in any TEC population reveal a striking enrichment for odorant receptors (Supplemental Fig. 5). (CL) Cellular location; (BP) biological process; (MF) molecular function. (D) Hierarchical clustering of the expression levels of all protein-coding genes in the TEC populations reveals three distinct strata of PGE. The color key to the left of the heatmap indicates the tissue specificity of genes in the GNF GeneAtlas according to the dynamic step method (Methods; Supplemental Fig. 6). (E) Hierarchical clustering of the TEC populations by gene expression correlation distance reveals four significant clusters (red asterisks, P > 0.95).
At an FPKM threshold of 0.13, at which genes can be reliably detected in all of the TEC populations assayed (dashed blue line, Fig. 2B), the mature Aire-positive mTEC population expressed 87% (19,293) of Ensembl protein-coding genes. To our knowledge, this is the highest proportion of genes yet found to be expressed in any cell type. By comparison, immature mTEC and mature mTEC subtypes lacking Aire expression transcribed fewer genes at the same threshold—on average 76% (16,951) while cTEC only expressed 68% (15,198) genes. An alternative differential expression approach based on count data yielded similar conclusions (Supplemental Fig. 4A,B; Supplemental Table 3).
These results reveal the breadth of gene expression within the TEC lineages including the presence of an extraordinary near-complete transcriptional program in Aire-positive mTEC. We next characterized the 1788 genes without detectable transcription at a 5% local FDR threshold in any of the TEC populations. As these genes will not contribute to the mixture of self-peptides shaping the self-tolerant TCR repertoire, their identification may relate to targets for tissue-specific autoimmunity. Gene ontology (GO) analysis revealed a strong enrichment of odorant receptors among these genes (Fig. 2C; Supplemental Fig. 5), and inspection revealed them to be comprised largely of olfactory receptors (882 genes, 49%), vomeronasal receptors (276 genes, 15%), and genes of unknown function (398, 22%) that are annotated as RIKEN clones or unannotated Ensembl gene models (a set expected to contain pseudogenes and noncoding RNAs wrongly assigned as encoding proteins). Overall, approximately half of all olfactory and vomeronasal receptor genes showed weak or sub-detection threshold expression (Supplemental Fig. 5C). Therefore, our results revealed that mTEC can express virtually the entire repertoire of known protein-coding genes, with the notable exception of about a thousand odorant receptor genes, and thus may provide a near comprehensive basis for the screening of the randomly generated TCR repertoire for self-reactivity.
PGE by TEC is stratified into three major tiers
We next established the extent of PGE in individual TEC populations by examining the expression of TRAs. Here, we took advantage of version 3 of the microarray-based GNF Mouse GeneAtlas (GNF GeneAtlas) (Lattin et al. 2008). First, we hierarchically clustered the 64 physiological samples (excluding the thymus) by correlation distance into 35 sample groups to reduce representation bias (Supplemental Fig. 6A). We then identified genes as being tissue restricted if they showed substantively higher expression in one to five of these tissue groups by utilizing a novel dynamic step method that shows a greater sensitivity and specificity than a previous simple threshold approach (Supplemental Methods; Supplemental Fig. 6; Supplemental Table 2; Gardner et al. 2008).
Hierarchical clustering of levels of all protein-coding genes expressed in TEC revealed three major groups of tissue-restricted genes: (i) those commonly expressed by all of the TEC populations; (ii) those expressed more highly by mTEC; and (iii) those up-regulated in Aire-expressing mature mTEC (Fig. 2D; Supplemental Fig. 4C,D). Above an FPKM threshold of 0.13 we found 3378 TRAs to be commonly expressed by cTEC, mature Aire-negative mTEC, and mature Aire-positive mTEC, 4623 TRAs to be expressed by both Aire-negative and Aire-positive mature mTEC, and 5970 TRAs to be expressed in mature Aire-positive mTEC (Supplemental Fig. 4D). PGE is thus stratified into three major tiers comprising a basic program common to all TEC subtypes that is further elaborated in mTEC and completed in Aire-expressing mature mTEC.
Pathway analysis of three major TEC types
The molecular features of TEC subtypes and their developmental relationships are ill-defined and are the subject of debate (for review, see Alves et al. 2014). Based on the hierarchical clustering of gene expression correlation, we found the TEC populations to fall into four significant clusters comprised of cTEC, immature mTEC, mature mTEC lacking Aire expression, and mature Aire-expressing mTEC (Fig. 2E). However, because these relationships may be obscured by PGE we reexamined TEC clustering after excluding tissue-restricted genes and genes induced by Aire expression. The TEC populations now clustered into only three significant groups (Supplemental Fig. 7A) comprising cTEC, immature mTEC, and mature mTEC, suggesting that these cell populations represent three fundamentally distinct TEC identities. Consistent with this finding, mature mTEC with an inactive Aire locus yield a near identical gene profile to those with an active Aire locus (Supplemental Fig. 8D).
We next compared the transcriptomes of these three TEC types, identifying biological pathways significantly enriched among genes differentially expressed between mature Aire-negative mTEC, immature mTEC, and cTEC (Supplemental Tables 3, 4; Supplemental Figs. 7, 8A–C). This approach revealed pathways previously known to be relevant for TEC biology (Supplemental Fig. 7B; Supplemental Table 4), including the JAK-STAT and NF-kappa B-signaling pathways (Supplemental Fig. 7C,D). In a complementary analysis, we sought genes that were highly expressed in a given TEC subtype (>10 FPKM) at a level at least twice that observed in any other TEC subtype. This recovered known TEC marker genes such as Ctsl, Dll4, Psmb11 (also known as beta5t), and Cxcl12 which all identify cTEC. Furthermore, this analysis revealed genes that were not known previously to identify individual TEC types (Supplemental Fig. 8F; Supplemental Table 5). The delineation of pathways and genes characteristic of specific TEC types offers important insights into the specification of these populations.
Aire secures the promiscuous expression of thousands of TRAs
In order to elucidate more precisely the role of Aire in PGE, we identified genes differentially expressed between mature Aire-positive mTEC and mature Aire-knockout (Aire-KO) mTEC. Aire expression positively regulated (induced) 3980 Ensembl protein-coding genes, but negatively regulated only 180 genes (more than twofold, 5% FDR) (Fig. 3A; Supplemental Table 3). Of the genes up-regulated by Aire expression, 594 (15%) were entirely dependent on Aire expression (i.e., their transcripts were not detected in Aire-KO mTEC), whereas Aire expression elevated the transcription of 3386 genes (85%) (Fig. 3C).
Figure 3.
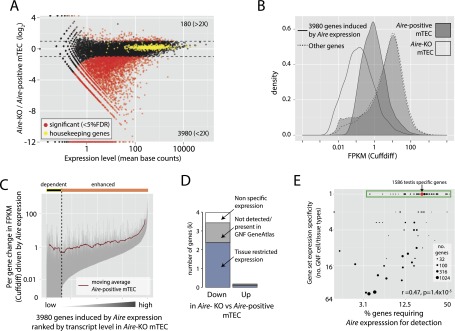
Aire expression positively regulates a large set of tissue-restricted genes. (A) Genes differentially expressed between mature Aire-positive mTEC and mature Aire-KO mTEC (<5% FDR, more than twofold). A set of 474 housekeeping genes (de Jonge et al. 2007) showed little change in expression, indicating the absence of a systematic bias (yellow points). (B) At the population level, Aire expression elevates target gene transcription to a median FPKM of 1. (C) Aire expression differentially up-regulates individual target genes. Each gray vertical line represents the change in FPKM of a single gene between mature Aire-KO mTEC and mature Aire-positive mTEC. Genes are ordered by increasing expression in mature Aire-KO mTEC on the x-axis, being either dependent on or enhanced by Aire expression. The red line represents the moving average of FPKM in mature Aire-positive mTEC. (D) Genes induced by Aire expression are tissue-restricted in transcription. Tissue-restricted genes were identified from the GNF GeneAtlas using the dynamic step method (Methods; Supplemental Fig. 6). (E) Degree of tissue restriction is positively correlated with the requirement for Aire expression. The fraction of genes requiring Aire expression for detection was assessed for sets of genes restricted in expression to all possible branches, nodes, and leafs of the GNF GeneAtlas sample clustering (Supplemental Fig. 6A). Only gene sets with at least 10 members are shown. The red dot indicates 1586 genes restricted in expression to testis, a tissue with a transcriptome of abnormally high complexity (Ramsköld et al. 2009) that is known to express Aire and to undertake PGE (Schaller et al. 2008).
Given the diverse clinical presentation of APS-1, we next examined the tissue specificity of genes regulated by Aire expression, finding the large majority (86%) of induced genes to be either tissue-restricted or not detected in the GNF GeneAtlas (Fig. 3D). Furthermore, analysis of exclusive sets of genes with varying degrees of expression breadth across the GNF GeneAtlas uncovered a positive relationship between the fraction of genes in a set requiring Aire expression for detection and the set’s tissue-expression specificity (r = 0.47, P = 1.4 × 10⁻⁵) (Fig. 3E). Aire expression therefore governs the promiscuous expression of a set of TRA that is substantially greater in extent than previously suspected, and it elevates the expression of these genes to a typical minimum level of 1 FPKM in the mature Aire-expressing mTEC population.
The tissue specificity of genes regulated by Aire expression includes organs affected in APS-1
Given the organ-specific nature of autoimmunity in APS-1 patients, we next considered transcripts of sets of genes whose expression is restricted to single physiological GNF GeneAtlas samples (green box, Fig. 3E) assessing both their expression level (Fig. 4A) and presence in each TEC population (Fig. 4B). It is notable that genes whose expression is restricted to tissues that are commonly affected in human AIRE deficiency or in analogous mouse models (Shikama et al. 2009; Kurisaki et al. 2013) showed especially strong dependence on Aire expression (denoted Hs and Mm, respectively) (Fig. 4A,B).
Figure 4.

Requirement for Aire reflects known AIRE deficiency pathologies. (A) The median expression level (FPKM) of sets of genes restricted in expression to single physiological samples (excluding the thymus) of the GNF GeneAtlas (based on dynamic step criteria; see Methods; Supplemental Fig. 6) (gene numbers indicated in parentheses) for each TEC population. Gene sets are sorted by the fold change in median expression level between mature Aire-positive and mature Aire-KO mTEC (accompanying bar chart). In both A and B, gene sets representing organs affected by AIRE deficiency in APS-1 (“Hs”) and the corresponding mouse model (“Mm”) are indicated. (B) The fraction of the same sets of genes that are detectable (<5% local FDR) in each TEC population (see Methods; Supplemental Fig. 3); gene sets are sorted by the increase in the fraction of these genes detected in mature Aire-positive mTEC compared to Aire-KO TEC. (C) Relative expression of known APS-1 autoantigens in mature Aire-positive wild-type and knockout TEC (Shikama et al. 2009). Induction by Aire expression is significantly negatively correlated with the transcriptional level of these genes in mature Aire-KO mTEC.
The parathyroid and adrenal glands are the signature sites of autoimmunity in APS-1. While the parathyroid is not represented in the GNF GeneAtlas, 14 genes restricted to the adrenal gland GNF GeneAtlas sample showed a relatively high requirement for Aire expression for transcription in mTEC (Fig. 4B). Genes with transcripts restricted to the reproductive system were also among those displaying the highest degree of dependency on Aire expression (Fig. 4B). This reliance is reflected in the clinical observation that premature ovarian failure, oophoritis, primary testicular failures and autoantibodies against the steroidogenic enzymes, 21-hydroxylase (CYP21A1), steroid 17-alpha hydroxylase (CYP17A1) and P450scc (CYP11A1) constitute common autoimmune features of APS-1 (Betterle and Zanchetta 2003). We also observed tissues whose antigens were largely induced by Aire expression but that have thus far not been identified as targets of APS-1-related pathologies (Fig. 4A,B) such as several female reproductive system tissues (Perheentupa 2006).
Only half of the mouse orthologs of known APS-1-relevant autoantigens showed a clear dependence on Aire expression, with dependency being largely predicted by the level of ortholog transcription in Aire-KO mTEC (Fig. 4C). Notably, however, the spectrum of tissues represented by the APS-1 autoantigens was largely recapitulated among the affected mouse orthologs which, together with the broader analyses (Fig. 4A,B), indicate a strongly conserved role for Aire between these two species.
Genes regulated by Aire expression have a repressive chromatin state in somatic tissues
To gain insight into the mechanism by which AIRE is targeted to particular genomic loci, we inspected features of genes that are positively regulated by Aire expression. While the genomic locations and structures of these genes do not show obvious architectural differences (data not shown), we reasoned that they may possess a silenced chromatin state that is common to TEC and most somatic cell types. To test this idea we used data from the Mouse ENCODE Project (The Mouse ENCODE Consortium et al. 2012) to assess the presence of chromatin modifications at gene transcriptional start sites (TSS).
Compared to those of other TRAs, the TSS of genes induced by Aire expression were broadly and significantly depleted in Pol II binding (Fig. 5B), in promoter acetylation (Fig. 5C) and in active histone marks (Fig. 5D). In contrast, the TSS of genes up-regulated by Aire expression showed a significant enrichment for the repressive histone mark H3K27me3 (Fig. 5E), a mark of particular interest given the established role of Polycomb group proteins in lineage-specific gene silencing. Overall, the epigenetic landscape we observed is consistent with the known ability of AIRE to recognize H3K4me0 and suggested a role for AIRE in derepressing genes silenced by Polycomb group proteins.
Figure 5.
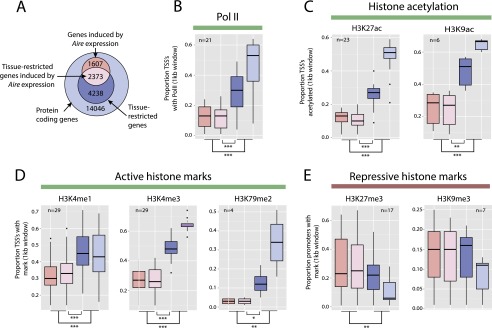
Genes induced by Aire expression are characterized by a repressive chromatin state in somatic tissues. (A) Genes were divided into sets comprising Aire expression-induced (light pink) or Aire expression-independent TRAs (dark blue), other genes induced by Aire expression (dark pink), and all other genes (light blue). The proportion of genes in each of these sets with TSS overlapping Mouse ENCODE ChIP-seq peaks in various tissue and cell types was assessed. (B) Box and whisker plots show the distribution of proportions of the four gene sets (see panel A) overlapping RNA polymerase II (Pol II) ChIP-seq calls from 21 Mouse ENCODE samples. The TSS of tissue-restricted genes induced by Aire expression overlap significantly less frequently with Pol II binding sites than those of other TRAs. A similar pattern was observed for histone acetylation (C) and active histone marks (D). In contrast, the TSS of genes induced by Aire expression show significantly greater overlap with H3K27me3 across 17 Mouse ENCODE samples (E). The n-values represent the number of Mouse ENCODE samples analyzed. (*) P < 0.05, (**) P < 0.01, (***) P < 0.001, using the Mann-Whitney U-test. Colors as in A.
Genes regulated by Aire expression are associated with the mark of Polycomb silencing
To test whether AIRE positively regulates the expression of genes held in a repressive chromatin state characterized by the presence of H3K27 trimethylation, we analyzed the epigenetic state of mature mTEC in vivo using chromatin immunoprecipitation (ChIP) followed by massively parallel DNA sequencing (ChIP-seq). Metagene analyses of uniquely mapped ChIP-seq reads revealed that genes positively controlled by Aire expression in mTEC tend to be held in a repressed state: There is a striking and significant reduction of H3K4me3 (Fig. 6A,B), a marker of actively transcribed genes, and a corresponding significant enrichment for H3K27me3 (Fig. 6C,D) at their TSS. Strikingly, 1582 genes that showed at least twofold enrichment for H3K27me3 were highly enriched for annotations associated with organismal development (Supplemental Fig. 9) and were strongly associated with regulation by Aire expression (odds ratio 6.9, P < 2.2 × 10⁻¹⁶) (Fig. 6E).
Figure 6.

Aire expression is associated with transcription of Polycomb silenced genes in mTEC. (A) Metagene profiles of the average normalized enrichment of H3K4me3 against input for sets of genes distinguished by Aire dependence and tissue specificity. (B) Boxplots of the median enrichment of H3K4me3 at the TSS of these sets of genes. (C,D) The results of the corresponding analysis for H3K27me3 marks. In B and D, *** indicates a significance level of P < 0.001 using the Mann-Whitney U-test. (E) The association of genes up-regulated by Aire expression (>2×, FDR < 0.05, Aire-positive vs. Aire-knockout mTEC) with genes whose TSS (1-kb centered windows) showed an average (n = 2) twofold or greater enrichment for H3K27me3 or H3K4me3 marks over input. Stated P-values were calculated using Fisher’s exact test. (F) Enrichment of H3K4me3 and H3K27me3, respectively, for the TSS of all protein-coding genes. Those induced by Aire expression are highlighted in red. The dashed box highlights a subset of genes induced by Aire expression whose TSS show enrichments for both modifications. (G) Genes induced by Aire expression are generally weakly transcribed in Aire-KO mTEC and have relatively low H3K4me3 enrichment scores and relatively high H3K27me3 enrichment scores. The heatmap shows all genes ordered by their ratio of expression in mature Aire-positive and knockout TEC. (H) The chromatin state and expression of APS-1 autoantigen ortholog Sox10 and Polr2f encoding a RNA Pol II subunit in mature mTEC.
More generally, the TSS of all genes separated either into an active state characterized by high levels of H3K4me3 and an absence of H3K27me3, or into a converse repressive state (Fig. 6F). The TSS of genes up-regulated by Aire expression fell mostly into the repressive state, although a subset showed higher, intermediate levels of H3K4me3 while also being marked by relatively high levels of H3K27me3 (dashed box, Fig. 6F). While there was a clear negative correlation between the enrichment of the two marks for most TSS, the two marks showed a significant positive correlation (r = 0.21, P < 2.2 × 10⁻¹⁶) at the TSS of genes up-regulated by Aire expression.
Overall, genes induced by Aire expression were distinguished by higher levels of H3K27me3 and lower levels of H3K4me3 in the mature mTEC population, and by low expression levels in Aire-KO mTEC (Fig. 6G). By way of illustration, the AIRE-regulated APS-1 autoantigen ortholog Sox10 was barely expressed in Aire-KO mTEC and was marked by H3K27me3 but appeared devoid of H3K4me3 (Fig. 6H). Immediately adjacent on chromosome 15 (but transcribed in the opposing orientation) lies the Aire-insensitive gene for the ubiquitous RNA polymerase II subunit Polr2f. This gene was strongly marked by H3K4me3 at its TSS but showed negligible enrichment for H3K27me3 (Fig. 6H; for further examples, see Supplemental Fig. 10). In summary, these population level observations suggest that H3K27me3 is associated with the recruitment of AIRE to target loci even in the presence of H3K4me3.
Genes regulated by Aire expression are stochastically transcribed at low frequency in individual mTEC
To compare gene expression in the mature mTEC population and in single cells we sequenced the individual transcriptomes of 190 mature mTEC. Gene expression was quantitated using spike-ins (Supplemental Fig. 11A,B; External RNA Controls Consortium 2005) and 174 of these cells were further analyzed based on their expression of more than 3000 protein-coding genes (Fig. 7A). Gene expression across the 174 cells showed good correspondence with that observed at the population level, with the mean expression levels of 18,945 genes detectable at the single-cell level (Supplemental Fig. 11C) showing good correlation with those from the mature mTEC population (Spearman’s r = 0.83, P < 2.2 × 10⁻¹⁶) (Supplemental Fig. 12A). In individual mature mTEC we detected the transcription of an average of 5262 genes, including 0–27 Aire expression-dependent (mean = 3), 46–322 (mean = 144) Aire expression enhanced, and 241–969 (mean = 581) Aire expression independent TRA (Figs. 3C, 7A). Numbers of genes detected per cell are likely underestimates due to the limited detection sensitivity of lowly expressed genes at the single-cell level (assessed in Supplemental Fig. 11B; Marinov et al. 2014). The number of genes transcribed by a cell and the per-cell Aire expression level were significantly correlated (Spearman correlation r = 0.40, P = 4.24 × 10⁻⁸) (Supplemental Fig. 12B,C).
Figure 7.

Transcriptomic analysis of promiscuous gene expression in single TEC. (A) Single mature mTEC tend to express few genes that are dependent on or enhanced by Aire expression (as defined in Fig. 3C). The histograms show the number of genes detected in 174 single mature mTEC that expressed >3000 protein-coding genes. (B) No discernible clustering is evident from the hierarchical clustering (with optimized leaf ordering) of 141 single Aire-expressing mature mTEC (columns) and 1985 genes up-regulated by Aire expression (rows) detected in at least three of these single cells. The colored bar above the plot indicates the single-cell expression level of Aire. (C) Genes dependent on Aire expression are transcribed less frequently in single mature mTEC than are other genes. The scatter plot shows the fraction of single mature mTEC that express any given gene against the expression level of that gene determined from the mature mTEC population. (D) When transcribed in single mTEC, genes dependent on Aire expression tend to be present at a level 16-fold higher than that indicated by the population average. Before calculating the relative expression levels, single-cell gene expression levels were globally normalized against population values using a linear model. (***) P < 1 × 10⁻¹⁴, estimated using the Mann-Whitney U-test.
Next, we assessed whether genes up-regulated by Aire expression were co-expressed non-randomly across 141 Aire-positive single TEC. Hierarchical clustering analysis of these genes and cells, however, failed to reveal clear clusters (Fig. 7B). While it is conceivable that nonstochasticity might be apparent with substantially more cells, these data, together with previous analyses of a small number of genes across an order of magnitude more TECs (Derbinski et al. 2008; Villaseñor et al. 2008), provide strong support for the hypothesis that genes up-regulated by AIRE are stochastically expressed in single TEC.
Finally, we sought to establish the frequency and level of self-antigen expression in TEC. We found that the frequency of self-antigen expression in mature mTEC is consistent with previously reported qPCR data (Supplemental Fig. 12D; Derbinski et al. 2008; Villaseñor et al. 2008). Furthermore, when plotted against expression level in the mature mTEC population, the proportion of TEC in which a gene is expressed demonstrated an overall sigmoidal relationship (Fig. 7C). Housekeeping genes showed high population expression and were typically detected in at least half (median 84%) of all single mTEC. In contrast, genes entirely dependent on Aire expression for their transcription were detected in a very small fraction (median 1.1%) of mature mTEC regardless of their population expression level. Genes enhanced by Aire expression were also infrequently transcribed (median 2.3%) while Aire-independent TRA were more commonly observed (median 9.2%) but less so than all other genes (median 33.3%) in single mature mTEC (Supplemental Fig. 12E). Notably, when present, genes dependent on Aire expression were much more highly transcribed (median 16-fold) in single cells than in the population (Fig. 7D) just as, to a lesser extent, were genes enhanced by Aire expression (median ninefold) and non-Aire induced TRA (median fivefold) (Fig. 7D). Self-antigens that tend to be lowly expressed at the population level are thus highly but infrequently transcribed in individual TEC.
Discussion
The initial positive selection of the randomly generated TCR repertoire by cTEC critically depends on the expression, processing, and presentation of a diverse set of self-peptides (Starr et al. 2003; Klein et al. 2009; Viret et al. 2011). The repertoire of self-peptides presented by cTEC is also of interest because these cells contribute to negative selection (Ahn et al. 2008; McCaughtry et al. 2008; Stritesky et al. 2013), and the generation of Treg (Liston et al. 2008). Moreover, education on self-peptides presented by cTEC is essential for maintaining T cell survival and homeostatic expansion in the periphery (Ernst et al. 1999). While we detect similar numbers of expressed genes in cTEC and in Aire-negative mTEC (Fig. 2B), the promiscuous expression of tissue-specific antigens is notably weaker in the cTEC population (Figs. 2D, 4A), which may impact on the efficiency of cTEC-mediated selection. Notwithstanding, and in addition to providing the basis for the positive selection of a diverse array of TCRs, a broad molecular representation of thousands of self-antigens by cTEC likely establishes a front line for both the clonal deletion and diversion of self-reactive T cells.
For central tolerance to be effective, T cells must be challenged in the thymus with a complex array of peptides, which foretells the ubiquitous and tissue-restricted self-antigens that they will encounter at any point in their lifetime monitoring somatic cells in the periphery. Our results show for the first time that mature Aire-positive mTEC are capable of transcribing the vast majority of the protein-coding genome in order to meet this need. Most of these genes are lowly expressed at the population level, disguising infrequent but relatively higher expression at the single-cell level. Hence, PGE likely results in the availability of sufficient TRA to be efficiently presented for thymic selection. Together, our population and single-cell analyses suggest that TEC alone may suffice for the establishment of central tolerance that is broadly comprehensive rather than selective in nature (the contributions by thymic dendritic cells in this process have, however, not been addressed by our studies). Furthermore, the relatively low number of genes dependent on Aire expression that we observe to be transcribed in single thymic epithelia provides a natural explanation for the persistent need for a large Aire-positive mTEC population to efficiently effect central tolerance.
In mature mTEC, expression of Aire secures the promiscuous transcription of an unprecedented number of TRAs. These genes are typically undetectable or lowly transcribed in the absence of Aire expression but in its presence tend to exceed a minimum of ∼1 FPKM at the population level, and are substantially more highly expressed in the single cells in which they are present. We show here for the first time that, at genome scale, genes regulated by Aire expression have a sporadic distribution at the single-cell level. We thus are led to the conclusion, as has been argued elsewhere (Derbinski et al. 2008; Villaseñor et al. 2008), that selection of tissue-specific genes in any given TEC is stochastic, further reflecting the unconventional mechanism of transcriptional regulation by AIRE (Mathis and Benoist 2009; Tykocinski et al. 2010). While it remains plausible that sub-populations of Aire-positive TEC exist (possibly reflecting distinct developmental stages), we suggest that a stochastic sampling of the silenced genome constitutes the most plausible mode of action for AIRE to contribute to efficient central tolerance induction.
The transcriptomes of Aire-positive and -negative mature mTEC are, except for genes regulated by Aire expression, remarkably similar (Supplemental Figs. 4A, 8D). This surprising result suggests that these populations constitute largely identical cell types differing only in the consequences of Aire expression. Given this similarity and the pervasive presence of RANK ligand, CD40 ligand, and lymphotoxin in the medulla as signals that control Aire expression (Anderson et al. 2013), it is surprising that Aire is only detected in a fraction of all mature mTEC. Although a model of sequential AIRE acquisition by mature mTEC could account for our observations, a precursor–product relationship between Aire-negative mature mTEC and Aire-positive post-mitotic mTEC has not yet been demonstrated and appears unlikely from our preliminary data. Moreover, our flow cytometric studies in AireGFP/+ mice detect GFP expression in a small subpopulation of immature mTEC, suggesting that the potential for Aire expression is already acquired at this earlier stage of development. The molecular mechanisms that determine the acquisition and heterogeneity of Aire expression in immature mTEC thus remain unknown.
Two separate models have been proposed to explain the actions of AIRE. The terminal differentiation model suggests that AIRE acts in mature, terminally differentiated mTEC as a transcriptional activator that conveys the specialized property of expressing peripheral tissue-antigens (Derbinski et al. 2005). The second—the so-called developmental model—proposes that committed mTEC precursors are multipotent and use several transcriptional programs in parallel to express a broad array of tissue-specific antigens. Concomitant with their differentiation and expression of Aire, some of these transcriptional networks are progressively silenced so that each of the mature cells expresses either a peripheral lineage program or an undefined terminal mTEC program consequent to a loss of expression of peripheral tissue regulators (Gillard and Farr 2005). Our observations that immature mTEC express some 2620 fewer Aire-independent genes than mature mTEC, together with our inability to detect nonrandom transcription of genes regulated by Aire expression at the single-cell level, provide strong evidence in support of the first, i.e., the terminal differentiation model.
The recognition of H3K4me0 is unlikely to constitute the sole and essential mechanism by which AIRE and its binding partners target TRAs (Zumer et al. 2013), not least because AIRE co-opts the repressive ATF7IP–MBD1 complex for the induction of immunotolerance (Waterfield et al. 2014). Our findings suggest that the TSS of many genes regulated by Aire expression in mature mTEC is characterized by the presence of H3K27me3 together with absent or low levels of H3K4me3. This epigenetic signature implies that AIRE is also able to screen genes that are repressed via the methyltransferase activity of the Polycomb Repressive Complex 2 (PRC2). Indeed, Polycomb complexes regulate developmental genes in multiple cell types and genomic contexts and are essential for cell fate transitions and lineage-specific gene silencing (Aloia et al. 2013). Given the strong association observed between regulation by Aire expression and H3K27me3 marks (Fig. 6), it is not surprising that we found that genes up-regulated by Aire expression are also significantly enriched for many GO terms related to system development (data not shown).
AIRE fails to directly recognize H3K27me3 (Chakravarty et al. 2009; Org et al. 2009) but may do so indirectly through its known interactions with chromatin-associated proteins (Abramson et al. 2010). AIRE has been shown to interact with Chromodomain-Helicase-DNA (CHD) members 4 and 6 (Gaetani et al. 2012; Yang et al. 2013). CHD4 binds to unmethylated H3K4 and trimethylated H3K9 (Musselman et al. 2009; Mansfield et al. 2011), whereas CHD6 is known to interact with H3K27me3 (Alfonso et al. 2011). Given these interactions, it is conceivable that AIRE identifies the repressive chromatin marks indirectly via its association with CHD molecules and subsequently sanctions transcription by overriding a repressive Polycomb chromatin state (Supplemental Fig. 13). The recognition by AIRE of chromatin state(s) rather than particular DNA sequences would explain how it positively and likely stochastically regulates the expression of so many genes in a single-cell type, and may help to understand Aire’s emerging immune system-independent roles in embryonic stem cells and in the testis (Schaller et al. 2008; Brahmaraju et al. 2011; Bin et al. 2012).
Finally, the unprecedented finding of a high degree of PGE in all TEC subpopulations independent of their anatomical localization or degree of maturation reflects a general characteristic of these cells that has not been described for any other cell type. This faculty is likely conferred by actions of yet unknown mechanisms that function together with AIRE to provide systematic relief from epigenetic silencing in mature mTEC.
Methods
Mice
C57BL/6 mice were obtained from Janvier (St Berthevin, France). A novel mouse line, designated AireGFP/+, was generated to target the enhanced green fluorescent protein (EGFP) expression to Aire-positive cells and to abolish functional Aire expression in mice homozygous for this knock-in (Fig. 1A; detailed in Supplemental Methods; G Nusspaumer, S Bornschein, N Shikama, T Barthlott, S Zuklys, W Krenger, K Hafen, S Naus, J Lopez-Rios, R Zeller, et al., in prep.).
Isolation, sorting, and immunostaining of thymic epithelial cells
Thymic stromal cells were isolated from multiple thymi and sorted according to their cell surface phenotypes (Supplemental Table 1; Supplemental Methods; Zuklys et al. 2012).
RNA and ChIP sequencing of thymic epithelial cell populations
Biologically replicate (n = 2) poly(A)+ selected RNA-seq libraries were generated from 1 µg of total RNA (see Supplemental Methods), and 36-bp single-end sequencing was performed using an Illumina GAII Analyzer. Chromatin immunoprecipitation (ChIP) was performed as previously described (Adli and Bernstein 2011) with minor modifications and antibodies as detailed in the Supplemental Methods. Biologically replicate (n = 2) ChIP-seq libraries were prepared with TruSeq ChIP Sample Preparation Kit (Illumina), and 50-bp paired-end reads were sequenced on an Illumina HiSeq.
Single-cell transcriptome sequencing
The single-cell transcriptomes of FACS sorted mature mTEC were assayed using the Fluidigm C1 platform and SMART-seq (Ramsköld et al. 2012) with spike in controls from the External RNA Controls Consortium (ERCC; External RNA Controls Consortium 2005). Per-cell libraries were generated using the Illumina Nextera XT kit and 100-bp paired-end reads generated using an Illumina HiSeq 2500. For further details, please see the Supplemental Methods.
RNA-seq and local FDR analysis of gene expression in thymic epithelial cell populations
After genomic read alignment with TopHat (Trapnell et al. 2009) (details in Supplemental Methods), upper-quartile normalized FPKM values were quantitated either (i) with Cuffdiff (Trapnell et al. 2010) denoted “Cuffdiff FPKM,” or (ii) directly from read counts, denoted “FPKM,” with multimapping reads being assigned a fractional count value according to their number of alignment locations (for comparison see Supplemental Fig. 3B; Sims et al. 2014). As described in full in the Supplemental Methods, per-gene local FDRs (Efron 2005) were estimated using FPKM values quantitated on gene models and on a matched null set of gene models shifted into selected intergenic space. For this analysis we used the Qvality algorithm (Käll et al. 2009) to estimate sample-specific mixing proportions. Differential expression analyses were performed using the DESeq algorithm (Anders and Huber 2010) as described in the Supplemental Methods along with the details of the clustering and GO analyses.
Identification of tissue-restricted genes
Tissue-restricted genes (Figs. 2D, 3D, 5A–E, 6A–D, 7A,C; Supplemental Table 2) were identified as described above and in the Supplemental Methods. Separately, we identified nonoverlapping sets of genes showing restricted expression in all leafs and nodes of the GNF GeneAtlas sample clustering (Supplemental Fig. 6A) using the same dynamic step criteria (Figs. 3E, 4A,B).
Mouse ENCODE analysis
The chromatin state of Ensembl protein-coding genes in somatic tissues was assessed using ChIP-seq data from the Mouse ENCODE Project (The Mouse ENCODE Consortium et al. 2012). For selected tissues and cell types, genes overlapping Mouse ENCODE ChIP-seq peak calls were identified by intersecting Mouse ENCODE peaks with 1-kb windows surrounding TSS.
ChIP-seq analysis
Genomic alignment with BWA (Li and Durbin 2009) yielded a minimum of 33 million uniquely mapping read pairs that were de-duplicated with Picard (http://picard.sourceforge.net) before the calculation of enrichment over input as described in the Supplemental Methods. Figures show the average enrichments of the two biological replicate experiments.
Single-cell RNA-seq analysis
Following read alignment with the GSNAP (Wu and Nacu 2010) algorithm, per-cell gene expression copy numbers were calculated from Cufflinks FPKMs using normalization curves constructed from the ERCC spike-in controls as detailed in the Supplemental Methods. For each cell we saw a median of 3.46 million reads aligning to genomic and 0.93 million aligning to the spike-in sequences. Single-cell expression level was compared to that observed in the population (Fig. 7D) after first using a first-order polynomial linear model fitted to the population level data to normalize the single-cell expression mean values across all cells such that the genes showed an average expression ratio of 1 between the mature mTEC population and the 174 single cells.
Data access
RNA-seq and ChIP-seq data have been submitted to the NCBI Gene Expression Omnibus (GEO; http://www.ncbi.nlm.nih.gov/geo/) under the SuperSeries accession number GSE53111.
Supplementary Material
Acknowledgments
S.N.S. and A.H. were supported by the Medical Research Council (MRC) CGAT program (G1000902). C.P.P. was supported by the MRC. N.S.D., S.Z., G.N., and G.A.H. were supported by the Swiss National Science Foundation. We thank David Sims and the CGAT Fellows for scientific discussions, Wilfried Haerty for critical reading of the manuscript, Elli Christen and Annick Peter for technical support, and Sabrina Harris for secretarial support. We thank Thierry Voet (KU Leuven and WT Sanger Institute) and the Single Cell Genomics Centre for establishing the single cell transcriptome sequencing facility.
Author contributions: G.A.H. and N.S.D. initiated the study with early genomics guidance from C.P.P. S.N.S. led and performed the computational genomics analyses and computational method development. N.S.D. performed experimental work unless otherwise noted. S.Z. performed the ChIP-seq experiment together with N.S.D. G.N. generated the Aire:GFP knock-in model. S.N.S. devised and led the single-cell experiment. M.E.D. performed TEC isolation and FACS for the single-cell analysis. I.C.M. and S.N.S. performed single-cell Fluidigm analysis and library preparation. S.N.S. prepared the figures except for Supplemental Figure 1 (prepared by N.S.D.). S.N.S., C.P.P., and G.A.H. wrote the manuscript.
Footnotes
[Supplemental material is available for this article.]
Article published online before print. Article, supplemental material, and publication date are at http://www.genome.org/cgi/doi/10.1101/gr.171645.113.
Freely available online through the Genome Research Open Access option.
References
- Abramson J, Giraud M, Benoist C, Mathis D. 2010. Aire’s partners in the molecular control of immunological tolerance. Cell 140: 123–135. [DOI] [PubMed] [Google Scholar]
- Adli M, Bernstein BE. 2011. Whole-genome chromatin profiling from limited numbers of cells using nano-ChIP-seq. Nat Protoc 6: 1656–1668. [DOI] [PMC free article] [PubMed] [Google Scholar]
- Ahn S, Lee G, Yang SJ, Lee D, Lee S, Shin HS, Kim MC, Lee KN, Palmer DC, Theoret MR, et al. 2008. TSCOT+ thymic epithelial cell-mediated sensitive CD4 tolerance by direct presentation. PLoS Biol 6: e191. [DOI] [PMC free article] [PubMed] [Google Scholar]
- Alfonso R, Lutz T, Rodriguez A, Chavez JP, Rodriguez P, Gutierrez S, Nieto A. 2011. CHD6 chromatin remodeler is a negative modulator of influenza virus replication that relocates to inactive chromatin upon infection. Cell Microbiol 13: 1894–1906. [DOI] [PubMed] [Google Scholar]
- Aloia L, Di Stefano B, Di Croce L. 2013. Polycomb complexes in stem cells and embryonic development. Development 140: 2525–2534. [DOI] [PubMed] [Google Scholar]
- Alves NL, Takahama Y, Ohigashi I, Ribeiro AR, Baik S, Anderson G, Jenkinson WE. 2014. Serial progression of cortical and medullary thymic epithelial microenvironments. Eur J Immunol 44: 16–22. [DOI] [PMC free article] [PubMed] [Google Scholar]
- Anders S, Huber W. 2010. Differential expression analysis for sequence count data. Genome Biol 11: R106. [DOI] [PMC free article] [PubMed] [Google Scholar]
- Anderson G, Takahama Y. 2012. Thymic epithelial cells: working class heroes for T cell development and repertoire selection. Trends Immunol 33: 256–263. [DOI] [PubMed] [Google Scholar]
- Anderson MS, Venanzi ES, Klein L, Chen Z, Berzins SP, Turley SJ, von Boehmer H, Bronson R, Dierich A, Benoist C, et al. 2002. Projection of an immunological self shadow within the thymus by the aire protein. Science 298: 1395–1401. [DOI] [PubMed] [Google Scholar]
- Anderson G, Baik S, Cowan JE, Holland AM, McCarthy NI, Nakamura K, Parnell SM, White AJ, Lane PJL, Jenkinson EJ, et al. 2013. Mechanisms of thymus medulla development and function. Curr Top Microbiol Immunol 373: 19–47. [DOI] [PubMed] [Google Scholar]
- Betterle C, Zanchetta R. 2003. Update on autoimmune polyendocrine syndromes (APS). Acta Biomed 74: 9–33. [PubMed] [Google Scholar]
- Bin G, Jiarong Z, Shihao W, Xiuli S, Cheng X, Liangbiao C, Ming Z. 2012. Aire promotes the self-renewal of embryonic stem cells through Lin28. Stem Cells Dev 21: 2878–2890. [DOI] [PMC free article] [PubMed] [Google Scholar]
- Bonasio R, Scimone ML, Schaerli P, Grabie N, Lichtman AH, von Andrian UH. 2006. Clonal deletion of thymocytes by circulating dendritic cells homing to the thymus. Nat Immunol 7: 1092–1100. [DOI] [PubMed] [Google Scholar]
- Brahmaraju M, Bhagya KP, Titus S, Sebastian A, Devi AN, Laloraya M, Kumar PG. 2011. AIRE1A might be involved in cyclin B2 degradation in testicular lysates. Biochem Cell Biol 89: 411–422. [DOI] [PubMed] [Google Scholar]
- Chakravarty S, Zeng L, Zhou M-M. 2009. Structure and site-specific recognition of histone H3 by the PHD finger of human autoimmune regulator. Structure 17: 670–679. [DOI] [PMC free article] [PubMed] [Google Scholar]
- de Jonge HJ, Fehrmann RS, de Bont ES, Hofstra RM, Gerbens F, Kamps WA, de Vries EG, van der Zee AG, te Meerman GJ, ter Elst A. 2007. Evidence based selection of housekeeping genes. PLoS ONE 2: e898. [DOI] [PMC free article] [PubMed] [Google Scholar]
- Derbinski J, Kyewski B. 2010. How thymic antigen presenting cells sample the body’s self-antigens. Curr Opin Immunol 22: 592–600. [DOI] [PubMed] [Google Scholar]
- Derbinski J, Gäbler J, Brors B, Tierling S, Jonnakuty S, Hergenhahn M, Peltonen L, Walter J, Kyewski B. 2005. Promiscuous gene expression in thymic epithelial cells is regulated at multiple levels. J Exp Med 202: 33–45. [DOI] [PMC free article] [PubMed] [Google Scholar]
- Derbinski J, Pinto S, Rösch S, Hexel K, Kyewski B. 2008. Promiscuous gene expression patterns in single medullary thymic epithelial cells argue for a stochastic mechanism. Proc Natl Acad Sci 105: 657–662. [DOI] [PMC free article] [PubMed] [Google Scholar]
- Efron B. 2005. Local false discovery rates. Technical Report, Department of Statistics, Stanford University, Stanford, CA.
- Ernst B, Lee DS, Chang JM, Sprent J, Surh CD. 1999. The peptide ligands mediating positive selection in the thymus control T cell survival and homeostatic proliferation in the periphery. Immunity 11: 173–181. [DOI] [PubMed] [Google Scholar]
- External RNA Controls Consortium 2005. Proposed methods for testing and selecting the ERCC external RNA controls. BMC Genomics 6: 150. [DOI] [PMC free article] [PubMed] [Google Scholar]
- Flicek P, Ahmed I, Amode MR, Barrell D, Beal K, Brent S, Carvalho-Silva D, Clapham P, Coates G, Fairley S, et al. 2013. Ensembl 2013. Nucleic Acids Res 41: D48–D55. [DOI] [PMC free article] [PubMed] [Google Scholar]
- Gaetani M, Matafora V, Saare M, Spiliotopoulos D, Mollica L, Quilici G, Chignola F, Mannella V, Zucchelli C, Peterson P, et al. 2012. AIRE-PHD fingers are structural hubs to maintain the integrity of chromatin-associated interactome. Nucleic Acids Res 40: 11756–11768. [DOI] [PMC free article] [PubMed] [Google Scholar]
- Gardner JM, Devoss JJ, Friedman RS, Wong DJ, Tan YX, Zhou X, Johannes KP, Su MA, Chang HY, Krummel MF, et al. 2008. Deletional tolerance mediated by extrathymic Aire-expressing cells. Science 321: 843–847. [DOI] [PMC free article] [PubMed] [Google Scholar]
- Gillard GO, Farr AG. 2005. Contrasting models of promiscuous gene expression by thymic epithelium. J Exp Med 202: 15–19. [DOI] [PMC free article] [PubMed] [Google Scholar]
- Hadeiba H, Lahl K, Edalati A, Oderup C, Habtezion A, Pachynski R, Nguyen L, Ghodsi A, Adler S, Butcher EC. 2012. Plasmacytoid dendritic cells transport peripheral antigens to the thymus to promote central tolerance. Immunity 36: 438–450. [DOI] [PMC free article] [PubMed] [Google Scholar]
- Holländer G, Gill J, Zuklys S, Iwanami N, Liu C, Takahama Y. 2006. Cellular and molecular events during early thymus development. Immunol Rev 209: 28–46. [DOI] [PubMed] [Google Scholar]
- Irla M, Hugues S, Gill J, Nitta T, Hikosaka Y, Williams IR, Hubert F-X, Scott HS, Takahama Y, Holländer GA, et al. 2008. Autoantigen-specific interactions with CD4+ thymocytes control mature medullary thymic epithelial cell cellularity. Immunity 29: 451–463. [DOI] [PubMed] [Google Scholar]
- Käll L, Storey JD, Noble WS. 2009. QVALITY: non-parametric estimation of q-values and posterior error probabilities. Bioinformatics 25: 964–966. [DOI] [PMC free article] [PubMed] [Google Scholar]
- Klein L, Hinterberger M, Wirnsberger G, Kyewski B. 2009. Antigen presentation in the thymus for positive selection and central tolerance induction. Nat Rev Immunol 9: 833–844. [DOI] [PubMed] [Google Scholar]
- Koh AS, Kuo AJ, Park SY, Cheung P, Abramson J, Bua D, Carney D, Shoelson SE, Gozani O, Kingston RE, et al. 2008. Aire employs a histone-binding module to mediate immunological tolerance, linking chromatin regulation with organ-specific autoimmunity. Proc Natl Acad Sci 105: 15878–15883. [DOI] [PMC free article] [PubMed] [Google Scholar]
- Koh AS, Kingston RE, Benoist C, Mathis D. 2010. Global relevance of Aire binding to hypomethylated lysine-4 of histone-3. Proc Natl Acad Sci 107: 13016–13021. [DOI] [PMC free article] [PubMed] [Google Scholar]
- Kurisaki H, Nagao Y, Nagafuchi S, Mitsuyama M. 2013. Autoimmune gastro-pancreatitis with anti-protein disulfide isomerase-associated 2 autoantibody in Aire-deficient BALB/cAnN mice. PLoS ONE 8: e73862. [DOI] [PMC free article] [PubMed] [Google Scholar]
- Kyewski B, Derbinski J. 2004. Self-representation in the thymus: an extended view. Nat Rev Immunol 4: 688–698. [DOI] [PubMed] [Google Scholar]
- Lattin JE, Schroder K, Su AI, Walker JR, Zhang J, Wiltshire T, Saijo K, Glass CK, Hume DA, Kellie S, et al. 2008. Expression analysis of G Protein-Coupled Receptors in mouse macrophages. Immunome Res 4: 5. [DOI] [PMC free article] [PubMed] [Google Scholar]
- Li H, Durbin R. 2009. Fast and accurate short read alignment with Burrows-Wheeler transform. Bioinformatics 25: 1754–1760. [DOI] [PMC free article] [PubMed] [Google Scholar]
- Liston A, Nutsch KM, Farr AG, Lund JM, Rasmussen JP, Koni PA, Rudensky AY. 2008. Differentiation of regulatory Foxp3+ T cells in the thymic cortex. Proc Natl Acad Sci 105: 11903–11908. [DOI] [PMC free article] [PubMed] [Google Scholar]
- Mansfield RE, Musselman CA, Kwan AH, Oliver SS, Garske AL, Davrazou F, Denu JM, Kutateladze TG, Mackay JP. 2011. Plant homeodomain (PHD) fingers of CHD4 are histone H3-binding modules with preference for unmodified H3K4 and methylated H3K9. J Biol Chem 286: 11779–11791. [DOI] [PMC free article] [PubMed] [Google Scholar]
- Marinov GK, Williams BA, McCue K, Schroth GP, Gertz J, Myers RM, Wold BJ. 2014. From single-cell to cell-pool transcriptomes: stochasticity in gene expression and RNA splicing. Genome Res 24: 496–510. [DOI] [PMC free article] [PubMed] [Google Scholar]
- Mathis D, Benoist C. 2009. Aire Annu Rev Immunol 27: 287–312. [DOI] [PubMed] [Google Scholar]
- McCaughtry TM, Baldwin TA, Wilken MS, Hogquist KA. 2008. Clonal deletion of thymocytes can occur in the cortex with no involvement of the medulla. J Exp Med 205: 2575–2584. [DOI] [PMC free article] [PubMed] [Google Scholar]
- Meloni A, Incani F, Corda D, Cao A, Rosatelli MC. 2008. Role of PHD fingers and COOH-terminal 30 amino acids in AIRE transactivation activity. Mol Immunol 45: 805–809. [DOI] [PubMed] [Google Scholar]
- Mortazavi A, Williams BA, McCue K, Schaeffer L, Wold B. 2008. Mapping and quantifying mammalian transcriptomes by RNA-Seq. Nat Methods 5: 621–628. [DOI] [PubMed] [Google Scholar]
- The Mouse ENCODE Consortium, Stamatoyannopoulos JA, Snyder M, Hardison R, Ren B, Gingeras T, Gilbert DM, Groudine M, Bender M, Kaul R, et al. 2012. An encyclopedia of mouse DNA elements (Mouse ENCODE). Genome Biol 13: 418. [DOI] [PMC free article] [PubMed] [Google Scholar]
- Musselman CA, Mansfield RE, Garske AL, Davrazou F, Kwan AH, Oliver SS, O’Leary H, Denu JM, Mackay JP, Kutateladze TG. 2009. Binding of the CHD4 PHD2 finger to histone H3 is modulated by covalent modifications. Biochem J 423: 179–187. [DOI] [PMC free article] [PubMed] [Google Scholar]
- Org T, Chignola F, Hetényi C, Gaetani M, Rebane A, Liiv I, Maran U, Mollica L, Bottomley MJ, Musco G, et al. 2008. The autoimmune regulator PHD finger binds to non-methylated histone H3K4 to activate gene expression. EMBO Rep 9: 370–376. [DOI] [PMC free article] [PubMed] [Google Scholar]
- Org T, Rebane A, Kisand K, Laan M, Haljasorg U, Andreson R, Peterson P. 2009. AIRE activated tissue specific genes have histone modifications associated with inactive chromatin. Hum Mol Genet 18: 4699–4710. [DOI] [PMC free article] [PubMed] [Google Scholar]
- Perheentupa J. 2006. Autoimmune polyendocrinopathy-candidiasis-ectodermal dystrophy. J Clin Endocrinol Metab 91: 2843–2850. [DOI] [PubMed] [Google Scholar]
- Ramsköld D, Wang ET, Burge CB, Sandberg R. 2009. An abundance of ubiquitously expressed genes revealed by tissue transcriptome sequence data. PLoS Comput Biol 5: e1000598. [DOI] [PMC free article] [PubMed] [Google Scholar]
- Ramsköld D, Luo S, Wang YC, Li R, Deng Q, Faridani OR, Daniels GA, Khrebtukova I, Loring JF, Laurent LC, et al. 2012. Full-length mRNA-Seq from single-cell levels of RNA and individual circulating tumor cells. Nat Biotechnol 30: 777–782. [DOI] [PMC free article] [PubMed] [Google Scholar]
- Schaller CE, Wang CL, Beck-Engeser G, Goss L, Scott HS, Anderson MS, Wabl M. 2008. Expression of Aire and the early wave of apoptosis in spermatogenesis. J Immunol 180: 1338–1343. [DOI] [PubMed] [Google Scholar]
- Shikama N, Nusspaumer G, Holländer GA. 2009. Clearing the AIRE: on the pathophysiological basis of the autoimmune polyendocrinopathy syndrome type-1. Endocrinol Metab Clin North Am 38: 273–288. [DOI] [PubMed] [Google Scholar]
- Shum AK, Alimohammadi M, Tan CL, Cheng MH, Metzger TC, Law CS, Lwin W, Perheentupa J, Bour-Jordan H, Carel JC, et al. 2013. BPIFB1 is a lung-specific autoantigen associated with interstitial lung disease. Sci Transl Med 5: 206ra139. [DOI] [PMC free article] [PubMed] [Google Scholar]
- Sims D, Ilott NE, Sansom SN, Sudbery IM, Johnson JS, Fawcett KA, Berlanga-Taylor AJ, Luna-Valero S, Ponting CP, Heger A. 2014. CGAT: computational genomics analysis toolkit. Bioinformatics 30: 1290–1291. [DOI] [PMC free article] [PubMed] [Google Scholar]
- St-Pierre C, Brochu S, Vanegas JR, Dumont-Lagace M, Lemieux S, Perreault C. 2013. Transcriptome sequencing of neonatal thymic epithelial cells. Sci Rep 3: 1860. [DOI] [PMC free article] [PubMed] [Google Scholar]
- Starr TK, Jameson SC, Hogquist KA. 2003. Positive and negative selection of T cells. Annu Rev Immunol 21: 139–176. [DOI] [PubMed] [Google Scholar]
- Stritesky GL, Xing Y, Erickson JR, Kalekar LA, Wang X, Mueller DL, Jameson SC, Hogquist KA. 2013. Murine thymic selection quantified using a unique method to capture deleted T cells. Proc Natl Acad Sci 110: 4679–4684. [DOI] [PMC free article] [PubMed] [Google Scholar]
- Trapnell C, Pachter L, Salzberg SL. 2009. TopHat: discovering splice junctions with RNA-Seq. Bioinformatics 25: 1105–1111. [DOI] [PMC free article] [PubMed] [Google Scholar]
- Trapnell C, Williams BA, Pertea G, Mortazavi A, Kwan G, van Baren MJ, Salzberg SL, Wold BJ, Pachter L. 2010. Transcript assembly and quantification by RNA-Seq reveals unannotated transcripts and isoform switching during cell differentiation. Nat Biotechnol 28: 511–515. [DOI] [PMC free article] [PubMed] [Google Scholar]
- Tykocinski L-O, Sinemus A, Rezavandy E, Weiland Y, Baddeley D, Cremer C, Sonntag S, Willecke K, Derbinski J, Kyewski B. 2010. Epigenetic regulation of promiscuous gene expression in thymic medullary epithelial cells. Proc Natl Acad Sci 107: 19426–19431. [DOI] [PMC free article] [PubMed] [Google Scholar]
- Venanzi ES, Gray DH, Benoist C, Mathis D. 2007. Lymphotoxin pathway and Aire influences on thymic medullary epithelial cells are unconnected. J Immunol 179: 5693–5700. [DOI] [PubMed] [Google Scholar]
- Venkatesh B, Lee AP, Ravi V, Maurya AK, Lian MM, Swann JB, Ohta Y, Flajnik MF, Sutoh Y, Kasahara M, et al. 2014. Elephant shark genome provides unique insights into gnathostome evolution. Nature 505: 174–179. [DOI] [PMC free article] [PubMed] [Google Scholar]
- Villaseñor J, Besse W, Benoist C, Mathis D. 2008. Ectopic expression of peripheral-tissue antigens in the thymic epithelium: probabilistic, monoallelic, misinitiated. Proc Natl Acad Sci 105: 15854–15859. [DOI] [PMC free article] [PubMed] [Google Scholar]
- Viret C, Lamare C, Guiraud M, Fazilleau N, Bour A, Malissen B, Carrier A, Guerder S. 2011. Thymus-specific serine protease contributes to the diversification of the functional endogenous CD4 T cell receptor repertoire. J Exp Med 208: 3–11. [DOI] [PMC free article] [PubMed] [Google Scholar]
- Waterfield M, Khan IS, Cortez JT, Fan U, Metzger T, Greer A, Fasano K, Martinez-Llordella M, Pollack JL, Erle DJ, et al. 2014. The transcriptional regulator Aire coopts the repressive ATF7ip-MBD1 complex for the induction of immunotolerance. Nat Immunol 15: 258–265. [DOI] [PMC free article] [PubMed] [Google Scholar]
- Wu TD, Nacu S. 2010. Fast and SNP-tolerant detection of complex variants and splicing in short reads. Bioinformatics 26: 873–881. [DOI] [PMC free article] [PubMed] [Google Scholar]
- Xing Y, Hogquist KA. 2012. T-cell tolerance: central and peripheral. Cold Spring Harb Perspect Biol 4: a006957. [DOI] [PMC free article] [PubMed] [Google Scholar]
- Yang S, Bansal K, Lopes J, Benoist C, Mathis D. 2013. Aire’s plant homeodomain(PHD)-2 is critical for induction of immunological tolerance. Proc Natl Acad Sci 110: 1833–1838. [DOI] [PMC free article] [PubMed] [Google Scholar]
- Zuklys S, Mayer CE, Zhanybekova S, Stefanski HE, Nusspaumer G, Gill J, Barthlott T, Chappaz S, Nitta T, Dooley J, et al. 2012. MicroRNAs control the maintenance of thymic epithelia and their competence for T lineage commitment and thymocyte selection. J Immunol 189: 3894–3904. [DOI] [PMC free article] [PubMed] [Google Scholar]
- Zumer K, Low AK, Jiang H, Saksela K, Peterlin BM. 2012. Unmodified histone H3K4 and DNA-dependent protein kinase recruit autoimmune regulator to target genes. Mol Cell Biol 32: 1354–1362. [DOI] [PMC free article] [PubMed] [Google Scholar]
- Zumer K, Saksela K, Peterlin BM. 2013. The mechanism of tissue-restricted antigen gene expression by AIRE. J Immunol 190: 2479–2482. [DOI] [PubMed] [Google Scholar]
Associated Data
This section collects any data citations, data availability statements, or supplementary materials included in this article.