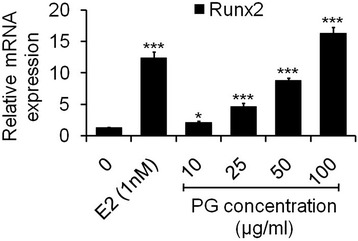
Figure 6.

Analysis of mRNA levels of Runx2 gene by qPCR. Osteoblasts were treated with (10–100 μg/ml) of PG for 48 h. qPCR for Runx2 mRNAs was performed. At each concentration, PG increased the mRNA levels when compared to control. Fold changes in mRNA levels are indicated by the numbers derived after normalizing with GAPDH mRNA levels used as an internal control. Values are obtained from three independent experiments in triplicate and expressed as mean ± SEM; *p < 0.05, *p < 0.01 and ***p < 0.001 as compared with control.
