

An X-ray compatible microfluidic platform for protein crystallization facilitates in situ Laue diffraction in serial crystallography.
Keywords: serial crystallography, Laue diffraction, protein crystallization, microfluidics
Abstract
Renewed interest in room-temperature diffraction has been prompted by the desire to observe structural dynamics of proteins as they function. Serial crystallography, an experimental strategy that aggregates small pieces of data from a large uniform pool of crystals, has been demonstrated at synchrotrons and X-ray free-electron lasers. This work utilizes a microfluidic crystallization platform for serial Laue diffraction from macroscopic crystals and proposes that a collection of small slices of Laue data from many individual crystals is a realistic solution to the difficulties in dynamic studies of irreversible biochemical reactions.
1. Introduction
While the field of protein crystallography has matured into a robust and accessible method for structure determination, the challenge of inferring dynamic information on protein function from static structures remains. This lack of dynamic structural information is the direct result of the timescale for data collection, which is typically of the order of seconds for monochromatic synchrotron radiation, compared to milliseconds or faster for functional motions in biological macromolecules. Furthermore, the cryocooling used in traditional single-crystal diffraction analysis tends to freeze out relevant molecular motions.
The timescale for data acquisition can be accelerated by either increasing the X-ray flux, as in the case of ultra-brilliant femtosecond pulsed X-ray free-electron lasers (XFELs) (Neutze & Moffat, 2012 ▶; Kupitz et al., 2014 ▶), or taking advantage of polychromatic Laue diffraction (Ren et al., 1999 ▶). While Laue diffraction also increases the flux of X-rays to the sample, another significant benefit is the fact that polychromatic radiation causes more reflections to be in a diffraction condition during exposure, resulting in more intense, complete diffraction peaks and eliminating the need for sample oscillation that would otherwise limit the rate of data collection (Hedman et al., 1985 ▶; Cornaby et al., 2010 ▶). At synchrotron sources, Laue diffraction can enable data collection to a time resolution of ∼100 ps (Moffat, 1997 ▶, 2014 ▶; Graber et al., 2011 ▶). However, for both Laue methods and XFELs, the increased X-ray flux results in significantly higher radiation damage, further compounding the difficulties of collecting data at biologically relevant temperatures.
While ideal data collection strategies utilize only a single crystal, to minimize systematic errors associated with multiple crystals, the sensitivity of a crystal to radiation damage determines its usable lifetime. There have been numerous examples where combining data from multiple crystals was necessary to overcome radiation damage (Yonath et al., 1998 ▶; Fry et al., 1999 ▶; Cherezov et al., 2007 ▶), but recent efforts have focused on extending such practices to the limit of one frame of data per crystal in an approach that has been termed ‘serial crystallography’ (Chapman et al., 2011 ▶; Hunter & Fromme, 2011 ▶). Earlier work has assessed the feasibility of structure determination from single Laue images collected at room temperature using standard crystal-mounting methods (Cornaby et al., 2010 ▶). However, the largest limitation was the range of crystal quality observed in crystals grown and mounted using traditional techniques. Statistical metrics have been established to guide the merging of data from multiple crystals for applications in anomalous diffraction experiments (Q. Liu et al., 2011 ▶, 2012 ▶, 2013 ▶; Z.-J. Liu et al., 2011 ▶). More recent work using serial crystallography on a massive scale (i.e. merging single frames of data from tens of thousands of crystals) has been demonstrated with great success, both at XFEL (Chapman et al., 2011 ▶; Boutet et al., 2012 ▶; Johansson et al., 2012 ▶, 2013 ▶; Barends et al., 2013 ▶; Demirci et al., 2013 ▶; Kern et al., 2013 ▶, 2014 ▶; Redecke et al., 2013 ▶; Hirata et al., 2014 ▶) and at synchrotron sources (Wang et al., 2012 ▶; Heymann et al., 2014 ▶; Stellato et al., 2014 ▶), including a demonstration of serial crystallography using Laue methods on inorganic crystals (Dejoie et al., 2013 ▶). However, there has yet to be a demonstration of this serial approach on protein crystals using Laue methods. We believe that the concept of serial crystallography opens a new avenue for structure determination, not only from nano- and microcrystals at XFELs and synchrotrons (Hedman et al., 1985 ▶; Chapman et al., 2011 ▶; Smith et al., 2012 ▶) but also critically for dynamic crystallography experiments aimed at measuring information related to structural and population changes over a broad range of experimental conditions (e.g. ligand concentration, ionic strength, pH, temperature and time) (Ren et al., 2013 ▶).
A further challenge in time-resolved structural studies arises from the need to synchronize the macromolecular dynamics within a crystal through a triggering event (e.g. light, ligand addition, temperature). Reaction initiation has most conveniently relied on a pump–probe strategy, which requires proteins within a crystal to undergo a complete reaction cycle and naturally reset to the ground state to enable repeated data acquisition at different time points and crystal orientations (Neutze & Moffat, 2012 ▶; Ren et al., 2012 ▶; Schotte et al., 2012 ▶; Jung et al., 2013 ▶; Schmidt et al., 2013 ▶; Kupitz et al., 2014 ▶; Moffat, 2014 ▶). Unfortunately, most reactions in crystals are effectively irreversible at room temperature (Moffat, 1997 ▶, 2014 ▶; Graber et al., 2011 ▶; Miller, 2014 ▶), owing to X-ray and/or laser damage, slow reversion back to the ground state, limitations of the crystal lattice, or the actual irreversible nature of the reaction. As a result, even when the means for triggering active processes in crystals are readily available, many important biological systems cannot be accessed by classical time-resolved crystallography because conventional pump–probe strategies are not feasible.
Recently, we reported a low-profile microfluidic platform for protein crystallization that completely eliminates the manual handling of protein crystals and resulted in high-quality anomalous diffraction data (Perry et al., 2013 ▶). Furthermore, we demonstrated that crystals grown and analyzed on chip showed low mosaicity and good isomorphism compared to typical cryocrystallographic data (Guha et al., 2012 ▶; Perry et al., 2013 ▶). The ability to analyze crystals directly within a microfluidic chip, without the need for harvesting or manipulation, minimizes crystal-to-crystal variation and provides an alternative platform for the implementation of large-scale serial crystallography. Furthermore, integrated fluidic control could be used to enable chemical triggering and/or the formulation of a wide range of sample conditions for dynamic crystallography experiments. This would be challenging to enable using current strategies for serial crystallography, such as liquid (Chapman et al., 2011 ▶) and paste jets (W. Liu et al., 2013 ▶), mesh-mounting (Zarrine-Afsar et al., 2012 ▶), or plate-based strategies (Axford et al., 2012 ▶) reported previously.
Here we present a new application of our microfluidic protein crystallization platform for serial Laue crystallography (Fig. 1 ▶). We validate our approach by merging many Laue diffraction images, obtained as single-shot-per-crystal, to produce complete data sets. This approach of serial Laue crystallography paves the way for dynamic multivariable structural studies of irreversible reactions using macroscopic crystals, including the application of chemical triggering to investigate a broad range of biologically and medically relevant protein targets.
Figure 1.

Microfluidic platform for protein crystallization. (a) Three-dimensional schematic. A single compartment of the multi-layered microfluidic chip contains various layers made of different polymer materials. (b) Side-on view of the chip. The thickness of the layers and chamber heights in the control and fluid layers are indicated (Guha et al., 2012 ▶; Khvostichenko et al., 2013 ▶; Perry et al., 2013 ▶). (c) Optical micrograph of PhnA crystals grown on chip. A portion of 2 × 2 individual compartments is shown. The micrograph is taken under polarized light, which results in various colors of the crystals.
2. Methods
2.1. Fabrication and operation of microfluidic crystallization devices
The crystallization chips used here are fabricated and operated as described previously (Guha et al., 2012 ▶; Perry et al., 2013 ▶), except for slight modifications to the chip design (Khvostichenko et al., 2013 ▶). A flat layer of cyclic olefin copolymer (COC from TOPAS Advanced Polymers Inc.; 50 µm) is chemically bonded to a 45 µm-thick polydimethylsiloxane (PDMS from General Electric RTV 650) control layer. This assembly is then bonded to a PDMS fluid layer with 60 µm features covered with a membrane thickness of ∼20 µm. The finished assembly is placed onto a Duralar substrate (13 µm, from Graphix Arts) (Fig. 1 ▶ a).
The microfluidic chips consist of separate half-wells for protein and precipitant solutions. Dedicated valve lines for each set of half-wells enable independent filling of protein and precipitate. A vacuum pump is connected to the device through a plastic gas manifold and polytetrafluoroethylene tubing, coupled with a thin metal tube to a small block of PDMS aligned over the inlets for the various control lines. This pump is used to actuate various actuate-to-open valve lines and load fluid into the chip. First, precipitant solutions [0.2 M ammonium acetate, 0.1 M HEPES pH 7.5 and 25%(w/v) PEG 3350] are loaded into the chip by pipetting 1–2 µl of solution onto the precipitant line inlets and actuating the corresponding valve line. Once the precipitant solution has been completely loaded into the chip, the inlet and valve lines are sealed with Crystal Clear tape (Hampton Research). This process is then repeated for the protein solution (PhnA protein from Sinorhizobium meliloti dissolved in 20 mM HEPES pH 7.5 at a concentration of 30 mg ml−1), using the appropriate inlet and valve lines. The remaining valve, located between the two half-wells, is then actuated to enable mixing of the protein and precipitant solutions. The remaining inlets are subsequently sealed with Crystal Clear tape. The sealed crystallization chips are incubated at 282 K in a petri dish containing 200 µl of the precipitant solution to act as a reservoir that controls the humidity of the environment. Crystallization is performed in both 24- and 96-well microfluidic chips. Crystals typically span the available height within the microfluidic chamber (Fig. 1 ▶).
2.2. On-chip X-ray diffraction
Data were collected in polychromatic mode at 12 keV (1.03 Å) on the 14-ID-B beamline (Graber et al., 2011 ▶) at the Advanced Photon Source at Argonne National Laboratory.
The microfluidic chips are mounted directly on the ϕ spindle or an XYZ translation stage to provide a larger translational range (Fig. 2 ▶). Positioning and alignment of the chips is performed using a high-resolution camera oriented at 30° with respect to the X-ray beam and a medium-resolution camera oriented at 60° with respect to the X-ray beam. Sample visualization and positioning are linked using xControl (Graber et al., 2011 ▶), a graphical user interface to the 14-ID-B beamline control software. The sample position can be controlled either by direct control of the individual XYZ motors or using a click-and-translate routine coupled with the high- and medium-resolution cameras. Because the axes for the translational motors are not aligned with the view of the 30° high-resolution camera, geometric corrections applied in the software enable apparent horizontal and vertical translation on the chip while keeping the chip in focus. Sample centering along the path of the X-ray beam is achieved via focusing, thus taking advantage of the very small depth of field present for the high-resolution camera.
Figure 2.
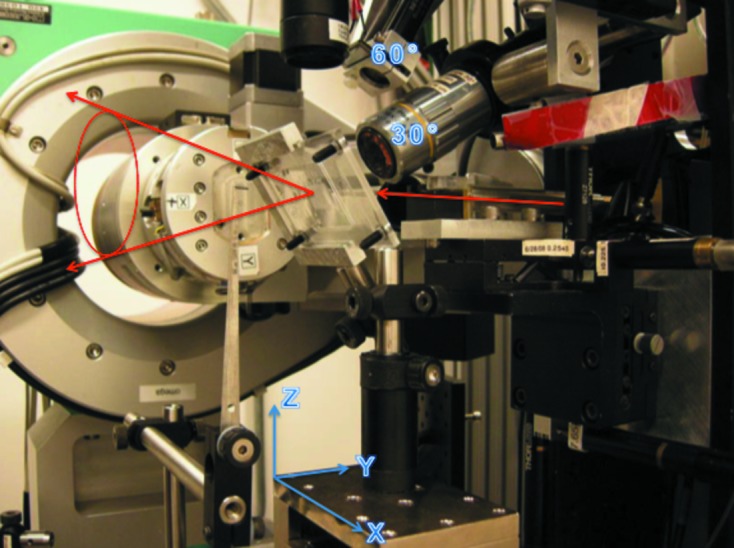
A 96-well chip mounted on the 14-ID-B beamline at BioCARS. The XYZ stage and high- (30°) and medium-resolution (60°) cameras are indicated. The chip is facing the high-resolution camera. The red arrows indicate the incident X-ray beam and diffraction cone.
In addition to sample alignment, xControl also enables mark-and-find identification of crystal positions for the purposes of data collection. Rather than manually aligning each crystal and collecting a frame of data before moving on, the software enables the user to first identify and align a number of crystals (e.g. all of the crystals present on a single chip) and then perform automated data collection. Translocation between crystals, X-ray shutter control and detector readout are streamlined. For the collection of time-resolved data, control over reaction triggering (e.g. laser pulse) and the appropriate time delay can also be programmed into the data acquisition protocol.
A single frame of data is collected from each crystal at room temperature (Fig. 3 ▶). Each X-ray exposure consists of a burst of 110 individual X-ray pulses, of 100 ps duration each, corresponding to an elapsed exposure time of <40 µs owing to the spacing between pulses. Furthermore, data collection is performed on a stationary crystal. The polychromatic nature of Laue diffraction abrogates the need to rotate the sample during data collection. The typical size of the X-ray beam is 90 µm horizontally by 60 µm vertically, slightly smaller than a typical dimension of the crystals. A MarCCD-165 detector is used with a sample-to-detector distance of 150 mm.
Figure 3.

In situ Laue diffraction from a PhnA crystal on chip. (a) Diffraction spots can clearly be observed, even when coincident with the diffuse background scattering from the polymer materials of the chip. (b) The inset image provides more detail on spot quality at high Bragg angles. The sample-to-detector distance is 150 mm. (c) Wavelength normalization curve reduced from 58 such images, each derived from a single crystal on chip.
2.3. Data analysis
Processing of Laue diffraction images is performed using Precognition (Renz Research Inc., Westmont, IL, USA) for indexing, refinement, integration, wavelength normalization (Fig. 3 ▶ c) and scaling (Table 1 ▶). The random orientation of each crystal necessitates separate indexing of each frame. Geometric refinement is also performed separately to account for variations between crystals. C-shell scripting is used to streamline the analysis of single-shot diffraction data from multiple crystals. Crystal orientation is examined by extracting Euler angles obtained after geometry refinement (Fig. 4 ▶). Statistical analysis of unit-cell variation is performed after indexing and geometry refinement (Fig. 5 ▶). The data are then integrated to 2.00 Å. Subsequent scaling and merging are performed on various subsets of the data. The resolution limit for each data set is defined as the resolution beyond which the mean F/σ(F) falls below 3, provided that the completeness in the highest-resolution shell is above 25%. Subsequent processing of crystallographic data sets is carried out using both the CCP4 suite of programs (Collaborative Computational Project, Number 4, 1994 ▶) and PHENIX (Adams et al., 2010 ▶). Structure refinement (Table 1 ▶) is carried out using PHENIX.refine starting from PDB model 3szy (Agarwal et al., 2011 ▶) in a fully automated fashion, including optimization of atomic coordinates, real-space refinement, individual B factors, TLS parameters and occupancies.
Table 1. Comparison of crystallographic statistics obtained using on-chip serial Laue analysis.
| max | 0.5 | 1.0 | (all) |
|---|---|---|---|
| Number of crystals | 33 | 43 | 58 |
| Resolution ()† | 502.12 | 502.12 | 502.09 |
| (2.22 2.12) | (2.222.12) | (2.192.09) | |
| Unique observations† | 23786 (1697) | 24906 (1976) | 26001 (1625) |
| Total observations† | 360604 (26312) | 376604 (30520) | 392174 (25208) |
| Redundancy† | 25.8 (0.9) | 33.1 (1.2) | 44.8 (1.0) |
| R merge on F 2 | 0.108 | 0.110 | 0.119 |
| R merge on F | 0.074 | 0.076 | 0.083 |
| Mean F/(F)† | 30.4 (14.2) | 30.1 (13.6) | 29.3 (6.1) |
| Completeness (%)† | 86.0 (50.2) | 89.9 (50.2) | 89.7 (45.8) |
| Structure refinement | |||
| R, R free | 0.190, 0.241 | 0.194, 0.247 | 0.195, 0.245 |
| Favored residues | 372 (91.9%) | 374 (92.3%) | 376 (92.8%) |
| Allowed residues | 22 (5.4%) | 25 (6.2%) | 23 (5.7%) |
| Disallowed residues | 11 (2.7%) | 6 (1.5%) | 6 (1.5%) |
Numbers in parentheses are for the high-resolution shell.
Figure 4.

A scatter plot demonstrating the random orientation of crystals grown and analyzed on chip, as described by the Euler angles ϕ, φ and Ψ reported after geometry refinement. Two-dimensional projections of the data are shown in blue, green and red.
Figure 5.

Unit-cell variation analysis calculated as a Euclidean distance Δj,k normalized by the population variance. (a) Background shading indicates the levels at which structure building was performed (Δj,k < 0.5, 1.0 and all frames). (b) Variation in the unit-cell length c as a function of the Δj,k cutoff.
2.4. Crystal isomorphism
Statistical analysis of the variation in unit-cell parameters of individual crystals is examined after indexing and geometric refinement using the method described previously (Q. Liu et al., 2012 ▶, 2013 ▶). Variations in crystal unit-cell parameters are calculated using a standard Euclidean distance, Δj,k, i.e. the Euclidean distance between the unit-cell parameters a, b, c, α, β and γ of crystals j and k among a total of N crystals and normalized by the variances of the parameters over the population:
Pairwise comparison of all crystals enables identification of a subset of crystals where all Δj,k are less than a cutoff value Δmax.
For our system, PhnA crystallizes into a tetragonal P43212 space group, which imposes the constraints that a = b and α = β = γ = 90°. The equal cell lengths a and b are treated as fixed variables in the geometric refinement of Laue patterns, such that refinement is only carried out on c. Therefore, the Euclidean distance analysis of unit-cell variations is derived only from variations in c.
3. Results and discussion
The goal of this work is to demonstrate the use of serial Laue crystallography on a microfluidic device for protein structure determination, using the metabolic enzyme phosphonoacetate hydrolase (PhnA) from Sinorhizobium meliloti as a model system. The on-chip crystallization and de novo structure determination of PhnA was reported previously using traditional monochromatic X-ray diffraction analysis (Perry et al., 2013 ▶). While the high-quality structural data that we obtained using monochromatic X-ray radiation suggested a straightforward transition to Laue methods (Helliwell et al., 1989 ▶), serial methods for Laue crystallography have not been previously applied to protein crystallography, necessitating validation of our approach.
The typical size of crystals grown on chip is 50–200 µm (Fig. 1 ▶ c), and our previous analysis suggested that use of a microfluidic chip did not result in preferential orientation of the crystals. However, indexing of Laue diffraction data is very challenging, owing to the need to correlate diffraction signals with both an hkl and a particular wavelength. A consequence of Laue indexing strategies is that some crystal orientations are more amenable to analysis than others (Ren et al., 1999 ▶). This is a particular concern for serial data collection strategies because of the need to index each individual frame of data separately. From a starting pool of 158 single-shot Laue diffraction images, only 58 frames could be correctly indexed using automated methods. The data resulting from these 58 crystals were merged into a data set that was 89.7% complete to a resolution of 2.09 Å with an R merge of 0.083 (Table 1 ▶). The quality of our data is further confirmed by the level of spectral detail present in the wavelength normalization curve derived from many crystals (Fig. 3 ▶ c), which is comparable to previous reports where a complete data set was collected from only a single crystal (Bourgeois et al., 2000 ▶; Šrajer et al., 2000 ▶).
A plot of the Euler angles for each of the indexed crystals suggests that the crystals are randomly orientated (Fig. 4 ▶). Regions that are not sampled by this data are clustered around Euler angles of 0 and 180°, corresponding to the main crystallographic axes in the crystal. This is consistent with both the difficulties associated with indexing crystals oriented along a major axis and visual inspection of many of the diffraction images that failed indexing. However, the overall spread in the data is consistent with the reasonable levels of completeness we observe in our final data set (Table 1 ▶; Fry et al., 1999 ▶).
Another significant challenge in merging data from multiple crystals is crystal-to-crystal variability (Yonath et al., 1998 ▶; Cornaby et al., 2010 ▶). While it is difficult to avoid variations in both diffraction quality and isomorphism for crystals manually harvested and flash frozen by traditional methods, in situ diffraction approaches in a microfluidic environment at room temperature result in highly reproducible crystals with greater isomorphism (Guha et al., 2012 ▶; Perry et al., 2013 ▶). On-chip analysis also helps to minimize concerns associated with the sensitivity of Laue diffraction to mosaicity (Hedman et al., 1985 ▶).
Analysis of the statistical variation in unit-cell parameters using a standard Euclidean distance Δj,k shows that all indexable crystals have a value of Δj,k that is less than the suggested cutoff value of 3.0 for all crystals (Fig. 5 ▶) (Q. Liu et al., 2012 ▶, 2013 ▶). Correspondingly, the calculated coefficient of variation in the unit-cell length c was less than 0.09% for all crystals, demonstrating a high level of isomorphism. Integration, scaling and structure refinement are subsequently performed on clusters of crystals with different levels of similarity (Δj,k < 0.5, 1.0, all), based on the results of this analysis.
We compare resolution limit, data completeness, R merge, R work and R free with various cutoffs Δmax (Table 1 ▶). While the use of more stringent isomorphism criteria improves R merge from 0.083 to 0.074, these improvements are obtained with some loss of both resolution and completeness (Fig. 6 ▶ a), little change in signal-to-noise ratio (Fig. 6 ▶ b), and a dramatic (42%) loss in the overall data redundancy. Furthermore, the improvement observed for R merge only translated to slight improvements in R work and R free (Table 1 ▶). Thus, there seems to be little benefit gained from more stringent exclusion of data at the expense of redundancy.
Figure 6.

Completeness (a) and signal-to-noise ratio (b) as a function of resolution. Data for Δj,k < 0.5 and Δj,k < 1.0 overlap almost identically, suggesting that there is little benefit from overly stringent criteria for crystal isomorphism, while inclusion of additional data can slightly enhance the overall resolution of the data set.
While signal-to-noise ratio is a concern in all diffraction experiments, it is a particular challenge in Laue diffraction, owing to the higher polychromatic background, and in time-resolved and other dynamic experiments where structural changes produce only small variations in the overall diffraction signal (Ren et al., 2013 ▶). Our current microfluidic chip design (Fig. 1 ▶) achieves an approximate ratio of 2:1 for the path length of the total device materials (127 µm) to the path length through the crystal (60 µm). This correlates with high-quality electron density maps that clearly show the structure of the protein backbone and side chains, as well as attendant solvent molecules and bound ions in the active site (Figs. 7 ▶ and 8 ▶). These electron density maps were obtained using only automated structure refinement, without manual optimization. Overall, the level of observed detail is more than sufficient for the interpretation of structural details, as would be necessary in time-resolved and other dynamic structural studies.
Figure 7.
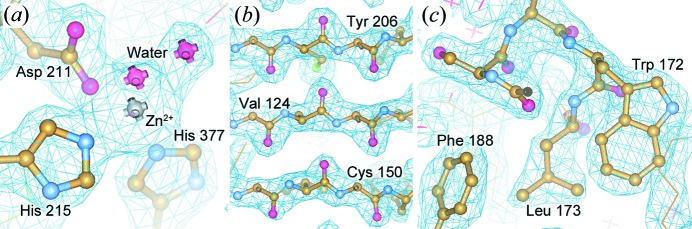
2F o–F c electron density maps of PhnA. Maps are contoured at 1.5σ and superimposed over a ball-and-stick representation of the protein structure. (a) The active site, (b) the β sheet in the core domain, and (c) the region near Trp172 and Phe188.
Figure 8.

2F o–F c electron density maps of PhnA. Maps are contoured at 1.5σ and superimposed over a ball-and-stick representation of the protein structure at the active site. Maps are shown for data sets generated both from our serial Laue approach for each of the data subsets (a) all frames, (b) Δj,k < 1.0 and (c) Δj,k < 0.5 as well as monochromatic data collected (d) on chip (10 frames per crystal) and (e) from a single crystal using traditional cryocrystallographic methods (Perry et al., 2013 ▶). The maps for (a) and (e) are processed to a resolution of 2.09 Å, while (b)–(d) are processed to a resolution of 2.11 Å.
We also compare our single-shot Laue data set with various results obtained using monochromatic X-ray diffraction (Table 2 ▶). In a previous report, we demonstrated the capability of our microfluidic device to enable the collection of anomalous diffraction data for de novo structure determination (Perry et al., 2013 ▶). In that experiment, ten frames of data were collected from each of 19 different crystals and merged. The two data sets diffract to similar resolution. Our Laue data set shows much stronger overall redundancy and a higher overall signal-to-noise ratio, despite the seemingly larger number of frames used in the monochromatic data set and the higher polychromatic background present in the Laue technique.
Table 2. Comparison of crystallographic statistics for different analysis methods.
| Method | Serial Laue (this work) | Microfluidic and monochromatic (Perry et al., 2013 ▶) | Cryo and monochromatic (Perry et al., 2013 ▶) |
|---|---|---|---|
| Protein | Native | SeMet | SeMet |
| Number of crystals | 58 | 19 | 1 |
| Frames per crystal | 1 | 10 | 360 |
| Resolution () | 502.09 | 502.11 | 502.09 |
| Unique observations | 26001 | 28002 | 27839 |
| Total observations | 392174 | 412491 | 809937 |
| Redundancy† | 44.8 (1.0) | 7.9 (6.7) | 29.1 (29.4) |
| R merge on F 2 | 0.119 | ||
| R merge on F | 0.083 | ||
| R sym | 0.111 (0.508) | 0.062 (0.145) | |
| Mean F/(F)† | 29.3 (6.1) | 15.4 (6.6) | 58.7 (32.6) |
| Completeness (%)† | 89.7 (45.8) | 99.8 (99.8) | 100 (100) |
| Structure refinement | |||
| R, R free | 0.195, 0.245 | 0.176, 0.211 | 0.149, 0.184 |
| Favored residues | 376 (92.8%) | 392 (95.6%) | 382 (94.3%) |
| Allowed residues | 23 (5.7%) | 11 (2.7%) | 19 (4.7%) |
| Disallowed residues | 6 (1.5%) | 7 (1.7%) | 4 (1.0%) |
Numbers in parentheses are for the high-resolution shell.
As part of our previous study, we also compared the results of our microfluidic method with those obtained using the traditional single-crystal cryocrystallography approach. Here we extend this comparison to include our Laue results. The data in Table 2 ▶ have been reprocessed to a resolution of 2.09 Å to enable direct comparison. As would be expected from a repetitive serial approach, our microfluidic strategy shows significantly higher redundancy than was observed for the single crystal. Objectively, the signal-to-noise ratio obtained on chip from crystals ranging in size from 50 to 200 µm is significantly lower than that from a much larger loop-mounted crystal of ∼500 µm under cryogenic conditions. Furthermore, the polychromatic nature of Laue crystallography results in a significantly higher background, compared to monochromatic methods, thus further exacerbating the differences.
Despite the various limitations associated with crystal size and background, the observed diffraction signal from our Laue data set was more than sufficient to produce electron density maps of comparable quality to those generated using single-crystal methods. Examination of the electron density maps generated using both Laue and monochromatic approaches again shows similar levels of structural detail, commensurate with the resolution cutoff of the data (Fig. 8 ▶). Between the various data sets we observe small variations in the resultant structures, such as the conformation of amino acid side chains and the location of bound water molecules, but the overall data quality is more than sufficient for the interpretation of fine structural details.
On the basis of these results, coupled with our previous successes in collecting single-wavelength anomalous diffraction data, we anticipate that extension of our current designs to time-resolved experiments will result in sufficient signal-to-noise ratio to observe structural variations as a function of time. Further optimization of device geometry is ongoing for applications related to both static and dynamic crystallography. Integrated microfluidic technology has the potential to introduce a chemical trigger, such as the addition of a ligand or substrate, an experiment that is challenging to perform at a large scale using traditional methods. However, signal-to-noise ratio is a particular concern for experiments involving the addition of a chemical trigger for time-resolved or multivariate dynamic experiments. Here, in addition to contributions from the device material, the triggering solution represents an additional source of background noise (Helliwell et al., 1998 ▶). For these experiments an optimization must be performed to balance delivery of the triggering chemical and integrated fluid handling strategies against signal-to-noise considerations. These strategies could also be easily applied to dynamic structural studies of irreversible biochemical reactions. Furthermore, recent work has suggested that fast Laue exposure times could help to outrun secondary radiation damage, such as radical generation and the breakage of chemical bonds (Warkentin et al., 2013 ▶), further enhancing the biological relevance of such studies.
4. Conclusions
We demonstrate the efficacy of a serial single-shot-per-crystal data collection strategy that takes advantage of the polychromatic Laue diffraction analysis of many protein crystals grown in a microfluidic device at room temperature. The resultant small slices of data can be successfully merged into a data set that generates high-quality electron density maps that are comparable to monochromatic data. Our data quality reflects the fact that the uniformity of a pool of crystals grown on chip is preserved by the absence of cryocooling, as well as manual handling and mounting of individual crystals. Our approach, coupling microfluidic platforms with serial Laue diffraction analysis, provides a realistic solution to the challenge of studying irreversible biochemical reactions using macroscopic crystals in dynamic crystallography. Our microfluidic design also suggests the potential for using integrated fluid handling to introduce chemical triggering to a broad range of protein targets that would otherwise be inaccessible to such analyses.
Acknowledgments
This work was funded by the National Institutes of Health grant GM086727. Use of the Advanced Photon Source was supported by the US Department of Energy Basic Energy Sciences, Office of Science, under contract No. DE-AC02-06CH11357. Use of BioCARS was supported by National Institutes of Health, National Institute of General Medical Sciences grant 1R24GM111072. We would like to acknowledge S. Nair and V. Agarwal for their generous gift of PhnA. We thank K. Moffat for critical reading of an early version of the manuscript.
References
- Adams, P. D., Afonine, P. V., Bunkóczi, G., Chen, V. B., Davis, I. W., Echols, N., Headd, J. J., Hung, L. W., Kapral, G. J. & Grosse-Kunstleve, R. W. (2010). Acta Cryst. D66, 213–221. [DOI] [PMC free article] [PubMed]
- Agarwal, V., Borisova, S. A., Metcalf, W. W., van der Donk, W. A. & Nair, S. K. (2011). Chem. Biol. 18, 1230–1240. [DOI] [PMC free article] [PubMed]
- Axford, D. et al. (2012). Acta Cryst. D68, 592–600. [DOI] [PMC free article] [PubMed]
- Barends, T. R. M., Foucar, L., Botha, S., Doak, R. B., Shoeman, R. L., Nass, K., Koglin, J. E., Williams, G. J., Boutet, S., Messerschmidt, M. & Schlichting, I. (2013). Nature, 505, 244–247. [DOI] [PubMed]
- Bourgeois, D., Wagner, U. & Wulff, M. (2000). Acta Cryst. D56, 973–985. [DOI] [PubMed]
- Boutet, S. et al. (2012). Science, 337, 362–364.
- Chapman, H. N., Fromme, P., Barty, A., White, T. A., Kirian, R. A., Aquila, A., Hunter, M. S., Schulz, J., DePonte, D. P., Weierstall, U. (2011). Nature, 469, 73–77.
- Cherezov, V., Rosenbaum, D. M., Hanson, M. A., Rasmussen, S. G., Thian, F. S., Kobilka, T. S., Choi, H.-J., Kuhn, P., Weis, W. I., Kobilka, B. K. & Stevens, R. C. (2007). Science, 318, 1258–1265. [DOI] [PMC free article] [PubMed]
- Collaborative Computational Project, Number 4 (1994). Acta Cryst. D50, 760–763.
- Cornaby, S., Szebenyi, D. M. E., Smilgies, D.-M., Schuller, D. J., Gillilan, R., Hao, Q. & Bilderback, D. H. (2010). Acta Cryst. D66, 2–11. [DOI] [PMC free article] [PubMed]
- Dejoie, C., McCusker, L. B., Baerlocher, C., Kunz, M. & Tamura, N. (2013). J. Appl. Cryst. 46, 1805–1816.
- Demirci, H. et al. (2013). Acta Cryst. F69, 1066–1069.
- Fry, E. E., Grimes, J. & Stuart, D. I. (1999). Mol. Biotechnol. 12, 13–23. [DOI] [PubMed]
- Graber, T. et al. (2011). J. Synchrotron Rad. 18, 658–670. [DOI] [PMC free article] [PubMed]
- Guha, S., Perry, S. L., Pawate, A. S. & Kenis, P. J. A. (2012). Sens. Actuators B Chem. 174, 1–9. [DOI] [PMC free article] [PubMed]
- Hedman, B., Hodgson, K. O., Helliwell, J. R., Liddington, R. & Papiz, M. Z. (1985). Proc. Natl Acad. Sci. USA, 82, 7604–7607. [DOI] [PMC free article] [PubMed]
- Helliwell, J. R., Habash, J., Cruickshank, D. W. J., Harding, M. M., Greenhough, T. J., Campbell, J. W., Clifton, I. J., Elder, M., Machin, P. A., Papiz, M. Z. & Zurek, S. (1989). J. Appl. Cryst. 22, 483–497.
- Helliwell, J. R., Nieh, Y. P., Raftery, J., Cassetta, A., Habash, J., Carr, P. D., Ursby, T., Wulff, M., Thompson, A. W., Niemann, A. C. & Alfons Hädener, M. (1998). Faraday Trans. 94, 2615–2622.
- Heymann, M., Opthalage, A., Wierman, J. L., Akella, S., Szebenyi, D. M. E., Gruner, S. M. & Fraden, S. (2014). IUCrJ, 1, 349–360. [DOI] [PMC free article] [PubMed]
- Hirata, K. et al. (2014). Nat. Methods, 11, 734–736. [DOI] [PubMed]
- Hunter, M. S. & Fromme, P. (2011). Methods, 55, 387–404. [DOI] [PMC free article] [PubMed]
- Johansson, L. C., Arnlund, D., Katona, G. et al. (2013). Nat. Commun. 4, 2911. [DOI] [PMC free article] [PubMed]
- Johansson, L. C., Arnlund, D., White, T. A. et al. (2012). Nat. Methods, 9, 263–265. [DOI] [PMC free article] [PubMed]
- Jung, Y. O., Lee, J. H., Kim, J., Schmidt, M., Moffat, K., Šrajer, V. & Ihee, H. (2013). Nat. Chem. 5, 212–220. [DOI] [PMC free article] [PubMed]
- Kern, J., Alonso-Mori, R. et al. (2013). Science, 340, 491–495. [DOI] [PMC free article] [PubMed]
- Kern, J., Tran, R. et al. (2014). Nat. Commun. 5, 4371. [DOI] [PMC free article] [PubMed]
- Khvostichenko, D. S., Kondrashkina, E., Perry, S. L., Pawate, A. S., Brister, K. & Kenis, P. J. A. (2013). Analyst, 138, 5384–5395. [DOI] [PMC free article] [PubMed]
- Kupitz, C. et al. (2014). Nature, 513, 261–265. [DOI] [PMC free article] [PubMed]
- Liu, Q., Dahmane, T., Zhang, Z.-N., Assur, Z., Brasch, J., Shapiro, L., Mancia, F. & Hendrickson, W. A. (2012). Science, 336, 1033–1037. [DOI] [PMC free article] [PubMed]
- Liu, Q., Liu, Q. & Hendrickson, W. A. (2013). Acta Cryst. D69, 1314–1332. [DOI] [PMC free article] [PubMed]
- Liu, Q., Zhang, Z. & Hendrickson, W. A. (2011). Acta Cryst. D67, 45–59. [DOI] [PMC free article] [PubMed]
- Liu, W. et al. (2013). Science, 342, 1521–1524.
- Liu, Z.-J., Chen, L., Wu, D., Ding, W., Zhang, H., Zhou, W., Fu, Z.-Q. & Wang, B.-C. (2011). Acta Cryst. A67, 544–549. [DOI] [PMC free article] [PubMed]
- Miller, R. J. D. (2014). Science, 343, 1108–1116. [DOI] [PubMed]
- Moffat, K. (1997). Methods Enzymol. 277, 433–447. [DOI] [PubMed]
- Moffat, K. (2014). Philos. Trans. R. Soc. London Ser. B, 369, 20130568. [DOI] [PMC free article] [PubMed]
- Neutze, R. & Moffat, K. (2012). Curr. Opin. Struct. Biol. 22, 651–659. [DOI] [PMC free article] [PubMed]
- Perry, S. L., Guha, S., Pawate, A. S., Bhaskarla, A., Agarwal, V., Nair, S. K. & Kenis, P. J. A. (2013). Lab Chip, 13, 3183–3187. [DOI] [PMC free article] [PubMed]
- Redecke, L. et al. (2013). Science, 339, 227–230.
- Ren, Z., Bourgeois, D., Helliwell, J. R., Moffat, K., Šrajer, V. & Stoddard, B. L. (1999). J. Synchrotron Rad. 6, 891–917.
- Ren, Z., Chan, P. W. Y., Moffat, K., Pai, E. F., Royer, W. E., Šrajer, V. & Yang, X. (2013). Acta Cryst. D69, 946–959. [DOI] [PMC free article] [PubMed]
- Ren, Z., Srajer, V., Knapp, J. E. & Royer, W. E. (2012). Proc. Natl Acad. Sci. USA, 109, 107–112. [DOI] [PMC free article] [PubMed]
- Schmidt, M., Srajer, V., Henning, R., Ihee, H., Purwar, N., Tenboer, J. & Tripathi, S. (2013). Acta Cryst. D69, 2534–2542. [DOI] [PMC free article] [PubMed]
- Schotte, F., Cho, H. S., Kaila, V. R., Kamikubo, H., Dashdorj, N., Henry, E. R., Graber, T. J., Henning, R., Wulff, M., Hummer, G., Kataoka, M. & Anfinrud, P. A. (2012). Proc. Natl Acad. Sci. USA, 109, 19256–19261. [DOI] [PMC free article] [PubMed]
- Smith, J. L., Fischetti, R. F. & Yamamoto, M. (2012). Curr. Opin. Struct. Biol. 22, 602–612. [DOI] [PMC free article] [PubMed]
- Šrajer, V., Crosson, S., Schmidt, M., Key, J., Schotte, F., Anderson, S., Perman, B., Ren, Z., Teng, T., Bourgeois, D., Wulff, M. & Moffat, K. (2000). J. Synchrotron Rad. 7, 236–244. [DOI] [PubMed]
- Stellato, F. et al. (2014). IUCrJ, 1, 204–212. [DOI] [PMC free article] [PubMed]
- Wang, X. et al. (2012). Nat. Struct. Mol. Biol. 19, 424–429. [DOI] [PMC free article] [PubMed]
- Yonath, A. et al. (1998). Acta Cryst. A54, 945–955. [DOI] [PubMed]
- Zarrine-Afsar, A., Barends, T. R. M., Müller, C., Fuchs, M. R., Lomb, L., Schlichting, I. & Miller, R. J. D. (2012). Acta Cryst. D68, 321–323. [DOI] [PubMed]