Abstract
The hippocampus is widely studied with neuroimaging techniques given its importance in learning and memory and its potential as a biomarker for brain disorders such as Alzheimer’s disease and epilepsy. However, its complex folding anatomy often presents analytical challenges. In particular, the critical hippocampal subfield information is usually ignored by hippocampal registration in detailed morphometric studies. Such an approach is thus inadequate to accurately characterize hippocampal morphometry and effectively identify hippocampal structural changes related to different conditions. To bridge this gap, we present our initial effort towards building a computational framework for subfield-guided hippocampal morphometry. This initial effort is focused on surface-based morphometry and aims to build a surface atlas of hippocampal subfields. Using the FreeSurfer software package, we obtain valuable hippocampal subfield information. Using the FIRST software package, we extract reliable hippocampal surface information. Using SPHARM, we develop an approach to create an atlas by mapping interpolated subfield information onto an average surface. The empirical result using ADNI data demonstrates the promise and good reproducibility of the proposed method.
I. Introduction
The hippocampus is widely studied with neuroimaging techniques (Fig. 1) given its importance in learning and memory and its potential as a biomarker for brain disorders such as Alzheimer’s disease (AD) and epilepsy. However, its complex folding anatomy often presents analytical challenges. In particular, the critical hippocampal subfield information is usually ignored in hippocampal morphometric studies. Most existing subfield studies employed high-field MR technologies, post-mortem data, and long scan times for extracting hippocampal subfield information [1]–[4], which could not be applied to a large cohort. Automated extraction of hippocampal subfields from 1.5T or 3T MRI brain scans is still a challenging task [5] and there are very few tools available. FreeSurfer (http://freesurfer.net/), a widely used brain segmentation and cortical parcellation software tool, recently released a promising routine (http://freesurfer.net/fswiki/HippocampalSubfieldSegmentation), where hippocampal subfields can be segmented from regular MRI scans automatically using a Bayesian approach [6].
Fig. 1.

MRI scan with highlighted left (brown) and right (red) hippocampi.
While many groups use FreeSurfer to obtain hippocampal volume measures, it is widely recognized that the hippocampal boundary generated by FreeSurfer is quite noisy (Fig. 2) and thus not suitable for detailed shape analysis [7]. On the other hand, FIRST (http://www.fmrib.ox.ac.uk/fsl/fsl/list.html) [8], an integrated surface registration and segmentation tool developed as part of the FMRIB Software Library (FSL), can yield satisfactory hippocampal segmentation results (Fig. 2), and has become a successful hippocampal segmentation tool used in several most recent hippocampal shape studies (e.g., [9], [10]). However, FIRST does not offer a hippocampal subfield segmentation capability. With these observations, in this work, we propose to use both FreeSurfer and FIRST to extract the entire hippocampus as well as its subfields.
Fig. 2.

Hippocampal segmentation: FIRST versus FreeSurfer.
The critical hippocampal subfield information is usually ignored by hippocampal registration in existing surface-based or voxel-based morphometric studies. Such an approach is thus inadequate to accurately characterize hippocampal morphometry and effectively identify hippocampal structural changes related to different conditions. To bridge this gap, we present our initial effort towards building a computational framework for subfield-guided hippocampal morphometry. This initial effort is focused on surface-based morphometry and aims to build a surface atlas of hippocampal subfields.
II. Methods
We start with n MRI scans. We first describe our approach to extract the hippocampus and its subfields from each scan. Then we discuss how to model the surface of each hippocampus using the spherical harmonic (SPHARM) method [11], [12]. Finally, we illustrate how to calculate a mean surface by averaging the n SPHARM models, assign subfield information to the mean surface, and define that as our surface atlas.
A. Segmentation of the Hippocampus and subfields
Freesurfer and FIRST (published as a part of FSL) are automatic segmentation tools based on Bayesian models. We first perform an initial segmentation of the subfields of the hippocampus from each MRI scan using FreeSurfer (see Fig. 3). The result includes 8 probability maps, one for each subfield. Then, we use FIRST to extract the left and right hippocampi, and the result is a 3D binary image (see Fig. 2 and Fig. 5). Next, we perform topology fix for the FIRST result to make sure the hippocampal object is simply-connected and its surface has a spherical topology (a requirement by SPHARM [12]). After topology fix, we use the fixed hippocampus to mask the 8 probability maps (i.e., values outside the mask are set to 0). We also identify “holes” in the mask, where all the 8 probability maps have 0 values. We smooth each probability map with a Gaussian kernel (Kernel size is [5 5 5] in our experiments) to get nonzero values and assign these values to voxels in the holes. We denote these updated probability maps as P1 – P8. Thus, for each hippocampus, the result of this step includes (1) a binary object to represent the entire hippocampus (its surface has a spherical topology), and (2) 8 probability maps P1 – P8, one for each subfield (see Fig. 4 for mapping it onto the surface, where nonzero values are colored in red). These are the input data to the next step.
Fig. 3.
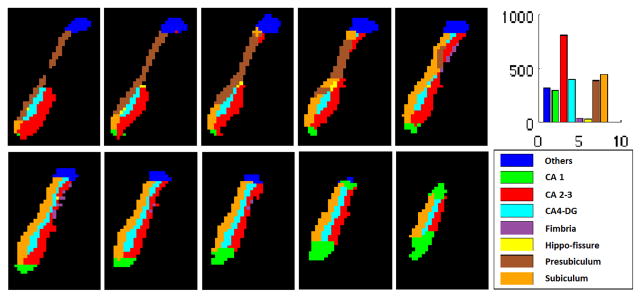
FreeSurfer subfield segmentation: Example slices. Histogram shows the number of voxels in each subfield.
Fig. 5.
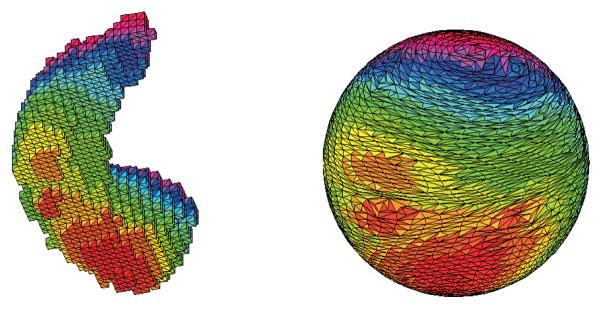
Hippocampal surface (left) and its spherical parameterization (right). Color indicates the correspondence between the surface and parameterization.
Fig. 4.

Subfields mapped on hippocampal surface segmented by FIRST. The label color map used here is the same as that in Fig. 3. Non-gray color indicates area with nonzero probability for the corresponding subfield based on the FreeSurfer subfield segmentation result.
B. Modeling Hippocampal Surfaces using SPHARM
Since the binary hippocampal objects cannot be compared directly, we employ the SPHARM method [12] to model their surfaces so that group analysis (e.g., computing an average shape) can be facilitated. The SPHARM method was proposed by Brechbuhlerüet al. [13] to model arbitrarily shaped but simply connected 3D objects. It is a Fourier transform technique that defines a 3D surface using three spherical functions and transforms them into three sets of Fourier coefficients in the frequency domain. Three steps are involved in our SPHARM processing pipeline: (1) spherical parameterization, (2) SPHARM expansion, and (3) SPHARM registration.
Spherical parameterization creates a continuous and uniform mapping from the object surface to the surface of a unit sphere, and its result is a bijective mapping between each point v on a surface and a pair of spherical coordinates θ and ϕ:
Fig. 5 shows an example spherical parameterization. This parameterization is an area preserving mapping computed using Brechbuhler’s method [13].
SPHARM expansion expands the object surface into a complete set of spherical harmonic basis functions , where denotes the spherical harmonic of degree l and order m and it is essentially a Fourier basis function defined on the sphere. The expansion takes the form:
| (1) |
where . The Fourier coefficients up to a user-desired degree can be estimated by solving a linear system. The object surface can be reconstructed using these coefficients, and using more coefficients leads to a more detailed reconstruction (see Fig. 6(a) for the degree 1 and degree 15 reconstructions of the same object).
Fig. 6.
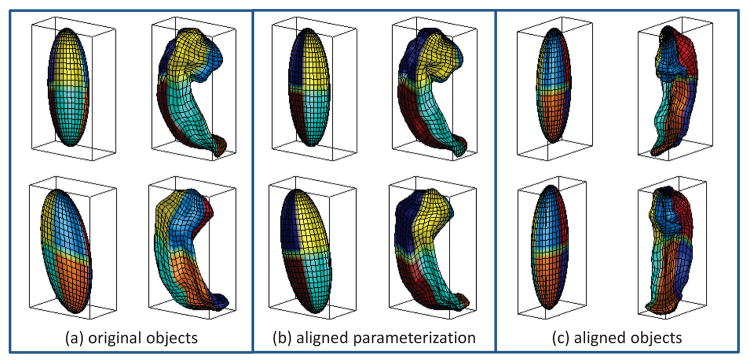
SPHARM registration using first order ellipsoids (FOEs). Each of (a–c) shows the FOE on left and degree 15 reconstruction on right. Parameterization is indicated by the mesh and color on the surface.
SPHARM registration creates a shape descriptor (i.e., excluding translation, rotation, and/or scaling) from a normalized set of SPHARM coefficients, which are comparable across objects. Scaling invariance can be achieved by adjusting the coefficients so that the object volume is normalized. Ignoring the degree 0 coefficient results in translation invariance. By design, the degree one reconstruction is an ellipsoid for any SPHARM model (Fig. 6). We call it the first order ellipsoid (FOE). Rotation invariance can be achieved by aligning the FOE [13]. Fig. 6 demonstrates the registration of SPHARM models by aligning the FOEs. Each of (a–c) shows the FOE on left and degree 15 reconstruction on right. In (a), the original pose and parameterization are shown. Note that the correspondence between two SPHARM models is implied by the underlying parameterization: two points with the same parameter pair (θ, ϕ) on two surfaces are defined to be a corresponding pair. Thus, in (b), the FOE is used to align the parameterization in the parameter space and establish the surface correspondence: although the object pose stays the same, the parameter net on each FOE is rotated to a canonical position such that the north pole is at one end of the longest main axis, and the crossing point of the zero meridian and the equator is at one end of the shortest main axis. In (c), the FOE is used to adjust the object pose in the object space: the FOE is rotated to make its main axes coincide with the coordinate axes, putting the shortest axis along x and longest along z. Now we can see that these two hippocampi are aligned to a canonical position in both parameter space and object space. Algorithmic details about this method are available in Brechbuhlerüet al. [13], [14].
C. Creating Surface Atlas of Hippocampal Subfields
Given n hippocampal SPHARM models, we can calculate a mean SPHARM model and use that as our surface atlas. Now we describe our approach to map the subfield information onto the mean surface. The main idea is to also use spherical harmonic basis functions to expand each subfield probability map. After that, for each surface location, we can assign it with the subfield label which has the largest probability among all eight subfields. In order to compute a SPHARM expansion for each probability map, we need to map a probability value to each vertex on the original voxel surface (see the left side of Fig. 7). Note that each original probability value is defined for each voxel, and thus each face on the original surface has a unique probability value. Based on this, we can calculate a probability value for each vertex by averaging the probability values of its adjacent faces.
Fig. 7.
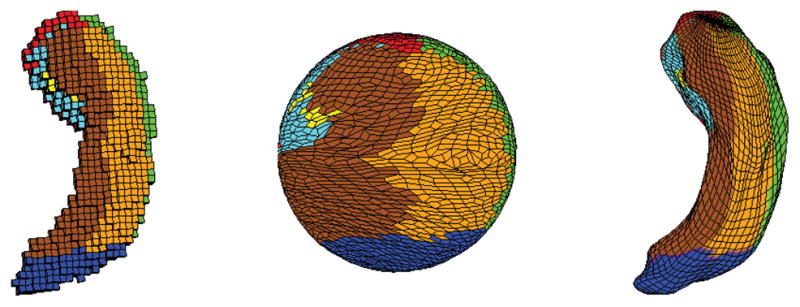
Subfields mapped on the original mesh (left), its spherical parameterization (middle), and SPHARM reconstruction after FOE registration (right). See Fig. 3 for the subfield color map.
III. Experimental Results
The magnetic resonance imaging (MRI) data were downloaded from the Alzheimer’s Disease Neuroimaging Initiative (ADNI) database. One goal of ADNI has been to test whether serial MRI, positron emission tomography, other biological markers, and clinical and neuropsychological assessment can be combined to measure the progression of mild cognitive impairment (MCI) and early AD. For up-to-date information, see www.adni-info.org.
In this work, we analyzed the baseline MRI scans of 26 randomly selected healthy controls from the ADNI GO/2 cohort, where each subject had a pair of repeated scans (say A and B). The experiments were performed on Dell Precision T7500 workstation running Unix OS, and Dell PWS670 workstation running WinXP.
Fig. 1 shows the axial, coronal, and sagittal views of an example MRI scan. Left and right hippocampi are colored in brown and red separately. Fig. 4 illustrates the probability distribution (non-gray color indicating area with nonzero probability) of each subfield on an example hippocampus. The probability maps were generated by Freesurfer, and mapped onto the surface of the hippocampus segmented by FIRST. Fig. 5 shows the voxel surface of an example hippocampus segmented by FIRST and its spherical parameterization. In order to map the surface to a spherical object, disconnected small components were removed, bad edge connectivity problem and bad vertex connectivity problem were fixed, and 3D holes were filled during the topology fix process.
Fig. 5 shows an example spherical parameterization. The hippocampal surface is mapped to a unit sphere. Color indicates the correspondence between the surface and the sphere. The goal of parameterization is to create a continuous and uniform mapping from the hippocampus surface to a unit sphere to establish surface correspondence across subjects. Fig. 6 shows the steps of FOE registration process. Figure7 shows the subfield mapping of an individual hippocampus, where subfields are mapped on the original mesh (left), its spherical parameterization (middle), and SPHARM reconstruction after FOE registration (right).
Fig. 8 shows surface atlases of hippocampal subfields created from MRI scans of 26 healthy controls, where each individual has two repeated scans (A and B): (a) Atlas generated from using both scans, (b) atlas generated from using Scan A only, and (c) atlas generated from using Scan B only. Each of (a–c) visualizes the atlas from two different views. We can see the results are pretty consistent, demonstrating decent reproducibility of the proposed method.
Fig. 8.
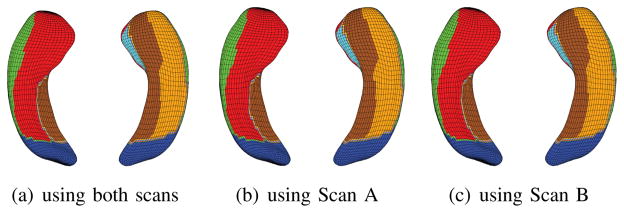
Surface atlases of hippocampal subfields created from MRI scans of 26 healthy controls, where each individual was scanned twice. (a) Atlas generated from using both scans, (b) atlas generated from using Scan A only, and (c) atlas generated from using Scan B only. Each of (a–c) visualizes the atlas from two different views. See Fig. 3 for the subfield color map.
IV. Conclusions
We have proposed a method for building a surface atlas of hippocampal subfields from MRI scans using FreeSurfer, FIRST and SPHARM methods and tools. Using FreeSurfer, we have obtained valuable hippocampal subfield information. Using FIRST, we have extracted reliable hippocampal surface information. Using SPHARM, we have developed an approach to create an atlas by mapping interpolated subfield information onto an average surface. The empirical result using ADNI data demonstrates good reproducibility of the proposed method. Based on this work, an interesting future direction is to build a computational framework for subfield-guided hippocampal morphometry.
Acknowledgments
This work was supported by NSF IIS-1117335, NIH R01 LM011360, U01 AG024904, RC2 AG036535, R01 AG19771, and P30 AG10133. Data collection and sharing for this project was funded by the Alzheimer’s Disease Neuroimaging Initiative (ADNI) (National Institutes of Health Grant U01 AG024904) and DOD ADNI (Department of Defense award number W81XWH-12-2-0012). ADNI is funded by the National Institute on Aging, the National Institute of Biomedical Imaging and Bioengineering, and through generous contributions from many other sources. Detailed Acknowledgements information is available in http://adni.loni.usc.edu/wp-content/uploads/howtoapply/ADNIManuscriptCitations.pdf.
Contributor Information
Shan Cong, Email: scong@iupui.edu, Dept. of Electrical and Computer Engineering, Purdue University Indianapolis, Indianapolis, IN 46202.
Maher Rizkalla, Email: mrizkall@iupui.edu, Dept. of Electrical and Computer Engineering, Purdue University Indianapolis, Indianapolis, IN 46202.
Eliza Y. Du, Email: yidu@iupui.edu, Dept. of Electrical and Computer Engineering, Purdue University Indianapolis, Indianapolis, IN 46202
John West, Email: jdwest@iupui.edu, Dept. of Radiology and Imaging Sciences, Indiana University School of Medicine, Indianapolis, IN 46202.
Shannon Risacher, Email: srisache@iupui.edu, Dept. of Radiology and Imaging Sciences, Indiana University School of Medicine, Indianapolis, IN 46202.
Andrew Saykin, Email: asaykin@iupui.edu, Dept. of Radiology and Imaging Sciences, Indiana University School of Medicine, Indianapolis, IN 46202.
Li Shen, Email: shenli@iu.edu, Dept. of Radiology and Imaging Sciences, Indiana University School of Medicine, Indianapolis, IN 46202.
References
- 1.Mueller SG, Stables L, Du AT, Schuff N, Truran D, Cashdollar N, Weiner MW. Measurement of hippocampal subfields and age-related changes with high resolution MRI at 4T. Neurobiol Aging. 2007;28(5):719–26. doi: 10.1016/j.neurobiolaging.2006.03.007. [DOI] [PMC free article] [PubMed] [Google Scholar]
- 2.Yushkevich PA, Avants BB, Pluta J, Das S, Minkoff D, Mechanic-Hamilton D, Glynn S, Pickup S, Liu W, Gee JC, Grossman M, Detre JA. A high-resolution computational atlas of the human hippocampus from postmortem magnetic resonance imaging at 9.4 T. Neuroimage. 2009;44(2):385–98. doi: 10.1016/j.neuroimage.2008.08.04. [DOI] [PMC free article] [PubMed] [Google Scholar]
- 3.La Joie R, Fouquet M, Mezenge F, Landeau B, Villain N, Mevel K, Pelerin A, Eustache F, Desgranges B, Chetelat G. Differential effect of age on hippocampal subfields assessed using a new high-resolution 3T MR sequence. Neuroimage. 2010;53(2):506–14. doi: 10.1016/j.neuroimage.2010.06.024. [DOI] [PubMed] [Google Scholar]
- 4.Wisse LE, Gerritsen L, Zwanenburg JJ, Kuijf HJ, Luijten PR, Biessels GJ, Geerlings MI. Subfields of the hippocampal formation at 7 T MRI: in vivo volumetric assessment. Neuroimage. 2012;61(4):1043–9. doi: 10.1016/j.neuroimage.2012.03.023. [DOI] [PubMed] [Google Scholar]
- 5.Winterburn JL, Pruessner JC, Chavez S, Schira MM, Lobaugh NJ, Voineskos AN, Chakravarty MM. A novel in vivo atlas of human hippocampal subfields using high-resolution 3 t magnetic resonance imaging. Neuroimage. 2013;74:254–65. doi: 10.1016/j.neuroimage.2013.02.003. [DOI] [PubMed] [Google Scholar]
- 6.Leemput KV, Bakkour A, Benner T, Wiggins G, Wald LL, Augustinack J, Dickerson BC, Golland P, Fischl B. Automated segmentation of hippocampal subfields from ultra-high resolution in vivo MRI. Hippocampus. 2009;19(6):549–57. doi: 10.1002/hipo.20615. [DOI] [PMC free article] [PubMed] [Google Scholar]
- 7.Shen L, Saykin AJ, Kim S, Firpi HA, West JD, Risacher SL, McDonald BC, McHugh TL, Wishart HA, Flashman LA. Comparison of manual and automated determination of hippocampal volumes in mci and early ad. Brain Imaging Behav. 2010;4(1):86–95. doi: 10.1007/s11682-010-9088-x. [DOI] [PMC free article] [PubMed] [Google Scholar]
- 8.Patenaude B, Smith SM, Kennedy DN, Jenkinson M. A Bayesian model of shape and appearance for subcortical brain segmentation. Neuroimage. 2011;56(3):907–922. doi: 10.1016/j.neuroimage.2011.02.046. [DOI] [PMC free article] [PubMed] [Google Scholar]
- 9.Luders E, Thompson PM, Kurth F, Hong JY, Phillips OR, Wang Y, Gutman BA, Chou YY, Narr KL, Toga AW. Global and regional alterations of hippocampal anatomy in long-term meditation practitioners. Hum Brain Mapp. 2013;34(12):3369–75. doi: 10.1002/hbm.22153. [DOI] [PMC free article] [PubMed] [Google Scholar]
- 10.Shi J, Thompson PM, Gutman B, Wang Y. Surface fluid registration of conformal representation: application to detect disease burden and genetic influence on hippocampus. Neuroimage. 2013;78:111–34. doi: 10.1016/j.neuroimage.2013.04.018. [DOI] [PMC free article] [PubMed] [Google Scholar]
- 11.Shen L, Farid H, McPeek MA. Modeling three-dimensional morphological structures using spherical harmonics. Evolution. 2009;63(4):1003–1016. doi: 10.1111/j.1558-5646.2008.00557.x. [DOI] [PMC free article] [PubMed] [Google Scholar]
- 12.Shen L, Kim S, Wan J, West JD, Saykin AJ. Fourier methods for 3D surface modeling and analysis. 2011:175–196. [Google Scholar]
- 13.Brechbühler C, Gerig G, Kubler O. Parametrization of closed surfaces for 3D shape description. Computer Vision and Image Und. 1995;61(2):154–170. [Google Scholar]
- 14.Brechbühler C. PhD dissertation. IKT/BIWI, ETH; Zurich: 1995. Description and analysis of 3-D shapes by parametrization of closed surfaces. [Google Scholar]


