

Abstract
In Escherichia coli, synthesis of the malonyl coenzyme A (malonyl-CoA) required for membrane lipid synthesis is catalyzed by acetyl-CoA carboxylase, a large complex composed of four subunits. The subunit proteins are needed in a defined stoichiometry, and it remains unclear how such production is achieved since the proteins are encoded at three different loci. Meades and coworkers (G. Meades, Jr., B. K. Benson, A. Grove, and G. L. Waldrop, Nucleic Acids Res. 38:1217–1227, 2010, doi:http://dx.doi.org/10.1093/nar/gkp1079) reported that coordinated production of the AccA and AccD subunits is due to a translational repression mechanism exerted by the proteins themselves. The AccA and AccD subunits form the carboxyltransferase (CT) heterotetramer that catalyzes the second partial reaction of acetyl-CoA carboxylase. Meades et al. reported that CT tetramers bind the central portions of the accA and accD mRNAs and block their translation in vitro. However, long mRNA molecules (500 to 600 bases) were required for CT binding, but such long mRNA molecules devoid of ribosomes seemed unlikely to exist in vivo. This, plus problematical aspects of the data reported by Meades and coworkers, led us to perform in vivo experiments to test CT tetramer-mediated translational repression of the accA and accD mRNAs. We report that increased levels of CT tetramer have no detectable effect on translation of the CT subunit mRNAs.
INTRODUCTION
Acetyl coenzyme A (acetyl-CoA) carboxylase (ACC) (EC 6.4.1.2) catalyzes the first committed step in fatty acid biosynthesis, the conversion of acetyl-CoA to malonyl-CoA (1). The best-understood multisubunit ACC is that of Escherichia coli, a large complex composed of four different subunits (1). The ACC reaction proceeds in two partial reactions (Fig. 1). The first partial reaction is catalyzed by the AccC (biotin carboxylase) subunit in which ATP activates bicarbonate to carboxylate the biotin moiety that is covalently bound to the AccB (biotin carboxyl carrier protein) subunit. In the second partial reaction, the biotin-bound carboxyl group is transferred to acetyl-CoA to form malonyl-CoA. The transfer reaction is catalyzed by a heterotetrameric complex of two additional subunits, AccA and AccD, often called the carboxyltransferase (CT) component (2–4). The complete ACC is thought to consist of a dimer of AccC, four copies of AccB, and the tetrameric AccA2-AccD2 CT component (1). In numerous bacteria, the four acc genes are found in an operon together with the genes encoding the enzymes catalyzing the subsequent reactions of fatty acid synthesis, which simplifies stoichiometric production of the ACC subunits. However, in E. coli, only the accB and accC genes are cotranscribed, with accB being the upstream gene (5), consistent with production of AccB in a 2:1 molar ratio as measured by several different assays (6–9). In contrast, the genome locations of the accA and accD genes are distant from the accBC operon and from one another. This raises the questions of how stoichiometric production of AccA and AccD to form the heterotetrameric CT complex is achieved. Proteomic analyses of E. coli and its very close relative, Shigella flexneri, indicate that equimolar amounts of AccA, AccC, and AccD are made, with the levels of AccB being twice that of AccC (7–9). The AccA and AccD subunits are consistently isolated from cell extracts as the AccA2-AccD2 heterotetramer (2–4), and proteomic analyses indicate that neither subunit exists in excess (7–9). A more recent total ribosome profiling study indicates that the two subunits are not only present at equimolar levels but are synthesized at similar rates (10). Note that all four acc genes are essential for growth (11).
FIG 1.
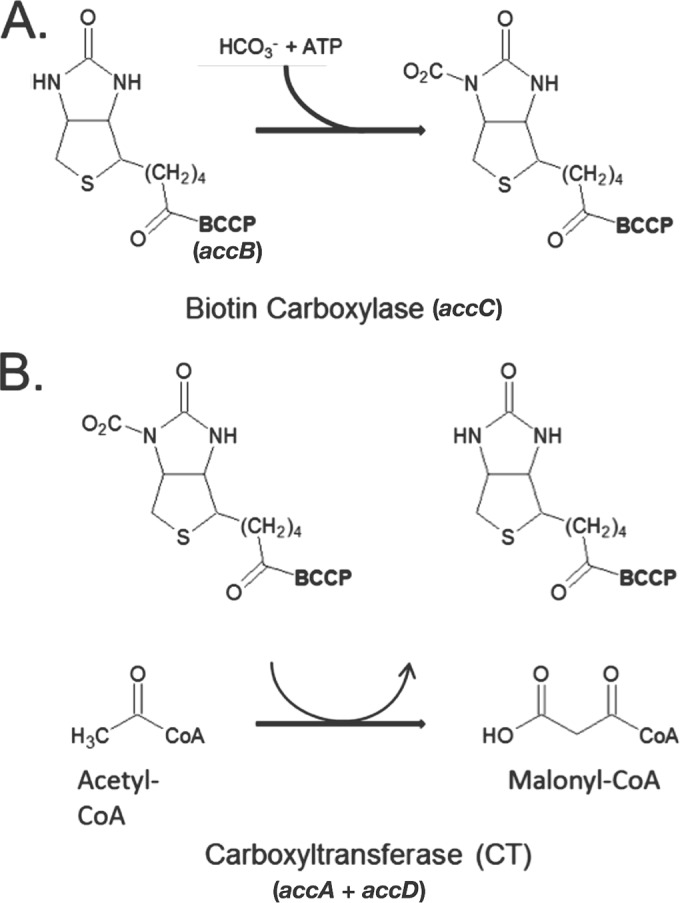
The acetyl-CoA carboxylase (ACC) reaction. The synthesis of malonyl-CoA is carried out in two distinct partial reactions. (A) The reaction is initiated by the carboxylation of the covalently bound biotin of the accB-encoded biotin carboxyl carrier protein (BCCP) by the accC-encoded biotin carboxylase (BC). (B) In the second partial reaction, the carbonyl group is transferred from the biotin moiety of the carrier protein to acetyl-CoA by the carboxyltransferase (CT) component (encoded by accA and accD) to give malonyl-CoA.
In 2010, Meades and coworkers (12) reported that production of AccA and AccD are coordinately regulated by a translational repression mechanism in which the CT heterotetramer binds the coding regions of the accA and accD mRNAs and thereby inhibits production of the CT subunits. The CT-mRNA interactions were reportedly mediated by a zinc finger structure present on the AccD subunit. Although this model has attractive aspects, it is based solely on in vitro results and stipulates that stretches of the accA and accD mRNAs 500 to 600 nucleotides long must be available for tight binding by the CT tetramer (12). However, if this were the case, these would be very atypical E. coli mRNA molecules, because in bacteria, nascent mRNAs immediately become substrates for the translation apparatus (13, 14). Numerous lines of evidence (e.g., transcriptional attenuation and polarity in operons) demonstrate that ribosomes are loaded onto nascent mRNAs as soon as the ribosome binding site and the first few codons have been transcribed. As RNA polymerase transcribes down the template, the chain of mRNA-bound ribosomes grows to form a polyribosome until an in-frame termination codon releases the ribosomes (15, 16). In addition, E. coli has an efficient mechanism to abort elongation of mRNAs that are not translated. The essential termination factor Rho binds to mRNA molecules that are not protected by ribosomes and disrupts the RNA polymerase-DNA template complex by a 5′-3′ procession mechanism that is responsible for polarity in operons (17, 18). The Rho protein requires only about 80 nucleotides of unprotected mRNA to act on RNA polymerase (19), and thus Rho action should preclude synthesis of the long mRNAs devoid of ribosomes used for the in vitro CT binding experiments. In the specific case of the accA and accD transcripts, ribosome profiling detects ribosome-protected fragments of both messages (10), and the two mRNAs are made and translated at essentially identical levels (9, 10). Therefore, multiple lines of evidence argue that mRNA species that bind the CT tetramer in vitro (12) are unlikely to exist in vivo. Moreover, the report by Meades at al. (12) contains data that argue against the specificity of the interactions between CT and the accA and accD mRNA. For example, the accA mRNA was <4-fold more effective in inhibition than was a non-ACC mRNA, that of tsf, an mRNA that is 6-fold more abundant than the accA and accD mRNAs (10). This weak binding specificity seems insufficient to play a regulatory role given the abundance of mRNAs in vivo. These considerations and what we believe are other shortcomings of the in vitro work (discussed below) led us to reexamine the question of accA-accD translational repression by in vivo experiments.
MATERIALS AND METHODS
Purification of CT tetramers.
The wild-type E. coli K-12 strain MG1655 containing the synthetic minioperon plasmid was grown in LB medium containing kanamycin. Overnight cultures grown in the same medium were used to inoculate 150-ml cultures. The cultures were grown at 37°C until an optical density at 600 nm (OD600) of 0.4 was reached. At this point, isopropyl-β-d-thiogalactoside (IPTG) was added to a final concentration of 0.5 mM, and the flasks were shifted to 25°C and allowed to express for approximately 4 h. The cells were harvested, and the cell pellet of each culture was split and frozen at −80°C. The CT was purified by methods similar to those of Blanchard and Waldrop (20), but with minor modifications of some buffers. The cell pellets were suspended in a lysis buffer of 20 mM Tris-HCl (pH 8.0), 500 mM NaCl, and 50 mM imidazole to make a 25-fold-concentrated cell lysate. Lysozyme was added to 1 mg/ml, and DNase I was added to 10 μg/ml. The cell suspensions were then incubated on ice for 1 h. The cells were lysed by freeze-thaw treatment. The cells were frozen in a dry ice-ethanol bath for 3 min and then thawed in a 20°C water bath for 3 min for a total of three cycles. The lysates were then centrifuged for 30 min at maximum speed in a microcentrifuge to separate soluble protein from insoluble cellular material. Qiagen Ni-nitrilotriacetic acid (NTA) slurry was then added to the cleared lysate, and the mixture was placed on a roller drum at 4°C overnight to allow protein binding. The mixture was then loaded on to a mini-spin column and centrifuged, and the column flowthrough was collected. The column was washed with three column volumes of wash buffer containing 50 mM KH2PO4 (pH 7.0), 300 mM NaCl, and 60 mM imidazole. The protein was eluted from the column by four washes with an elution buffer containing 20 mM Tris-HCl (pH 8.0), 500 mM NaCl, and 250 mM imidazole. The eluted protein was then dialyzed against 135 mM KCl, 1 mM Na2EDTA, and 10 mM KH2PO4 (pH 7.0) and subsequently against 500 mM KCl and 10 mM HEPES (pH 7.0). The purified protein was then concentrated using an Amicon Ultra centrifugal filter unit.
CT activity assays.
The CT activity of purified protein fractions was assayed by measuring NADH production spectrophotometrically in the reverse of the physiological reaction according to the method of Guchait et al. (3). The reaction mixture contained 100 mM Tris-HCl (pH 8.0), 0.1 mM malonyl-CoA, 10 mM l-malic acid, 0.5 mM NAD+, 0.6 mg bovine serum albumin, 4.16 units/ml malic dehydrogenase, 7.0 units/ml of citrate synthase, 10 mM d-biotin methyl ester, and carboxyltransferase in a volume of 0.5 ml. The reaction was initiated by the addition of biotin methyl ester as the carboxyl acceptor. NADH formation was measured at 340 nM on a Beckman DU800 spectrophotometer for 4 min. Biotin methyl ester was synthesized from d-biotin. Dry methanol (13.33 ml) was placed in a round-bottom flask on ice, and 66 μl of acetyl chloride was slowly added to generate approximately 3% HCl in methanol. d-Biotin (1.0 g) was added, and the mixture was allowed to stir overnight followed by rotary evaporation. The biotin methyl ester was then precipitated and subsequently dissolved in 40% ethanol.
Overall activities of strains containing the CT overproduction plasmids were compared with the wild-type strain through use of partially purified extracts. These extracts were assayed using the [14C]carboxyl transfer method of Guchait et al. (3). The strains were grown at 37°C in 500 ml of minimal medium E containing 0.4% glucose, 0.1% Casamino Acids, 0.002% uracil, and antibiotic when needed for plasmid maintenance. The cultures were grown to an OD600 of 0.4, at which time IPTG was added to a final concentration of 0.1 mM and the cultures continued growth for 30 min. The cells were then pelleted and stored at −80°C. The samples were suspended in 20 ml of 100 mM potassium phosphate buffer (pH 7.0) containing 1 mM EDTA and 5 mM 2-mercaptoethanol. The cells were lysed by freeze-thaw, and the cellular debris was removed as described above. The cell lysate supernatant was then fractionated with ammonium sulfate while stirred on ice. Ammonium sulfate (144 g/liter) was slowly added to the supernatant to bring the solution to 25% of saturation. The precipitated protein was removed by centrifugation and saved for analysis, while the supernatant was brought to 45% saturation by the addition of 125 g/liter of ammonium sulfate. The precipitated protein was removed by centrifugation and stored at −80°C. The 25 to 45% ammonium sulfate protein precipitate was suspended in buffer and dialyzed similarly to the purified CT complex. The activity of the partially purified extracts was assayed in the reverse of the physiological reaction by determination of acid-stable [14C]carboxyl group transfer from malonyl-CoA to biotin methyl ester. The enzymatic activity is determined by the loss of acid-stable radioactivity in the presence of biotin methyl ester. The reaction mixture contained 50 mM Tris (pH 8.0), 100 μM [14C]malonyl-CoA, 10 mM d-biotin methyl ester, 6 mg/ml bovine serum albumin, and up to 1 milliunit enzyme. The reaction was carried out in a volume of 0.5 ml and initiated by the addition of enzyme. Reaction mixtures lacking biotin methyl ester served as controls. The reaction mixture was incubated at 30°C, and 0.1 ml was withdrawn at 0, 5, 10, 15, and 20 min. The samples were transferred to a tube containing an equal volume of 6 N HCl to stop the reaction and release labile 14C compounds. The tubes were dried at 90°C and then transferred to a scintillation vial, where scintillation fluid was added and the amount of acid-stable 14C was measured. The activity was determined by loss of acid-stable radioactivity over time, and any loss seen in the biotin-free control reaction was subtracted.
Plasmid constructions.
Plasmids pACS229 and pACS230, which express accA and accD, respectively, from a T7 promoter, were constructed by PCR amplification of the individual genes from genomic DNA using primers 5′ accA NdeI, 3′ accA + HindIII, 5′ accD NdeI, and 3′ accD + HindIII. (Tables 1 and 2 list plasmids and primers, respectively.) The PCR product generated gave a 5′ NdeI site overlapping the initiation codon and a 3′ HindIII site located approximately 90 additional bp downstream of the coding sequence. The Pfu polymerase-amplified PCR products were inserted into the NdeI and HindIII sites of pVIET to generate plasmids pACS229 and pACS230. These plasmids were further modified to remove the lacO element yielding plasmids pACS243 and pACS245. Each plasmid construct was digested with XbaI and SgrAI. Because the XbaI site was blocked by Dam methylation, the plasmids were purified from the dam strain, ER2925 (21). Due to the significant SgrAI star activity, the plasmids were digested only briefly. The oligonucleotides T7 no LacO top and T7 no LacO bottom were annealed together by heating at 95°C in New England BioLabs T4 ligase buffer and slowly cooling to room temperature. The annealed double-stranded oligonucleotide was then gel purified and ligated to the XbaI-SgrAI digests to give pACS243 and pACS245. The resulting constructs contained each acc gene expressed from its own T7 promoter without additional regulation by the LacI encoded by the overexpression plasmids. Various carboxyltransferase minioperons were constructed, and the best was found to be pQE-80L-Kan as the vector and with accD followed by accA. The two genes were amplified using primers 5′ Bam accA plus 3′ SpHI accA and 5′ Bam accD plus 3′ SpHI accD. The products were then ligated to BamHI and SphI-digested pQE80KL to generate pACS251 (accA) and pACS254 (accD). The 5′ SphI RBS accA/accD pQE80 primer along with either the 3′ SacI accA or 3′ SacI accD primers were used to amplify either accA or accD using the previously generated pACS251 or pACS254 constructs as the templates. The 5′ SphI RBS accA/accD pQE80 primer contains a ribosome binding site for the second gene of the minioperon. The accA and accD PCR products generated from these primers were then ligated into the SphI and SacI sites of the pACS251 and pACS254 plasmids to generate pACS263 and pACS262, respectively. To test the effects of tag location, a C-terminal pentahistidine-tagged version of accD was made in the minioperon. The primers 5′ accD ScaI C His and 3′ accD ScaI C His were used to amplify the accD sequence. To prevent the N-terminal His tag coding sequence from being used as a template while preserving the spacing, a BamHI-to-SphI-digested fragment of pACS262 containing accD was used as the template. The resulting PCR product contained ScaI sites at either end and was digested with that enzyme and gel purified. The pACS262 construct was digested with EcoRI and SphI. The large fragment was gel purified and then blunt ended using T4 DNA polymerase and the four deoxynucleotide triphosphates. The ScaI-digested PCR product and the blunted vector were then ligated to give pACS275.
TABLE 1.
Plasmids used in this work
| Plasmid | Relevant characteristic | Source or reference | Primers used |
|---|---|---|---|
| pACS229 | pVIET encoding AccA | This work | 5′ accA NdeI, 3′ accA + HindIII |
| pACS230 | pVIET encoding AccD | This work | 5′ accD NdeI, 3′ accD + HindIII |
| pACS243 | pVIET ΔlacO encoding AccA | This work | T7 no LacO top, T7 no LacO bottom |
| pACS245 | pVIET ΔlacO encoding AccD | This work | T7 no LacO top, T7 no LacO bottom |
| pACS251 | pQE-80L-Kan encoding AccA | This work | 5′ Bam AccA, 3′ SpH accA |
| pACS254 | pQE-80L-Kan encoding AccD | This work | 5′ Bam accD, 3′ SpH accD |
| pACS262 | pQE-80L-Kan encoding AccD and AccA | This work | 5′ SpHI RBS accA/accD pQE80, 3′ SacI accA |
| pACS263 | pQE-80L-Kan encoding AccA and AccD | This work | 5′ SpHI RBS accA/accD pQE80, 3′ SacI accD |
| pACS275 | pQE-80L-Kan encoding C-term His-tagged AccD and AccA | This work | 5′ accD ScaI C HIS, 3′ accD ScaI C HIS |
| pACS280 | pQE-80L-Kan encoding C-term His-tagged AccD and AccA Δcat | This work | |
| pACS281 | pQE-80L-Kan encoding C-term His-tagged AccD (C27A C30A) and AccA Δcat | This work | C27/30A 5, C27/30A 3 |
| pACS285 | pQE-80L-Kan without cat | This work | |
| pQE-80L-Kan | T5 expression vector | Qiagen | |
| pVIET | T7 expression vector | 26 | |
| pTARA | pBAD33 expressing T7 polymerase | 27 |
TABLE 2.
Oligonucleotide primers
| Primer | Sequencea |
|---|---|
| 5′ accA NdeI | GGAATCATATGAGTCTGAATTTCCTTGATTTTGAACAGC |
| 3′ accA + HindIII | CATGTAAGCTTCCTGGAAAATCCTTCCTTAATCATAG |
| 5′ accD NdeI | GGTCCCATATGAGCTGGATTGAACGAATTAAAAG |
| 3′ accD + HindIII | GACGAAGCTTGAGGAGTGCGTTTGATAATC |
| T7 no LacO top | CCGGGATCCGCCGGTGCGAAATTAATACGACTCACTATAGGGGTCTAGACG |
| T7 no LacO bottom | CTAGGCGGCCACGCTTTAATTATGCTGAGTGATATCCCCAGATCTGCGATC |
| 5′ SpHI RBS accA/accD pQE80 | CACACAGCATGCATTAAAGAGGAGAAATTAACTATG |
| 5′ Bam AccA | CATCACGGATCCATGAGTCTGAATTTCCTTG |
| 3′ SpH accD | GAGCTCGCATGCTTATCAGGCCTCAG |
| 5′ Bam accD | CATCACGGATCCATGAGCTGGATTGAAC |
| 3′ SpH accA | GAGCTCGCATGCGAATTACGCGTAAC |
| 3′ SacI accA | GAGCTCGAGCTCGAATTACGCGTAAC |
| 3′ SacI accD | GAGCTCGAGCTCTTATCAGGCCTCAG |
| 5′ accD ScaI C HIS | GACATCAGTACTTAAAGAGGAGAAATTAACTATGAGCTGGATTGAACGAATTAAAAG |
| 3′ accD ScaI C HIS | CTTATAAGTACTTATTAGTGGTGGTGGTGGTGGTGCTCGAGGGCCTCAGGTTC |
| C27/30A 3 | ATAAAACCTGACCGGCGCTATCAGCCTTAG |
| C27/30A 5 | CTAAGGCTGATAGCGCCGGTCAGGTTTTAT |
Boldface indicates bases changed from the original sequence.
To allow selection of all three compatible plasmids, the chloramphenicol resistance sequence present in the backbone of the pQE80KL constructs was eliminated by digestion with NcoI and NheI. The digest reactions were heat inactivated, and the sticky ends were filled to blunt ends using T4 polymerase. The reaction mixture contained the digested plasmid as well as 10 mM deoxynucleoside triphosphates (dNTPs) and T4 polymerase. The reaction mixture was incubated at 12°C for 15 min and then heat inactivated by the addition of EDTA followed by heating at 80°C for 20 min. The large fragments of the digested and blunted plasmids were then gel purified. After purification, the plasmids were self-ligated to generate plasmid pACS280 lacking the chloramphenicol resistance gene. Plasmid pACS285 was generated similarly but from pQE80-K-L to serve as a vector control. Plasmid pACS281 was generated by site-directed mutagenesis using the QuikChange PCR protocol (Stratagene) on the plasmid pACS280. The primers C27/30A 5 and C27/30A 3 were used to introduce the cysteine-to-alanine substitution mutations at accD residues 27 and 30. The PCR products were then treated with DpnI and transformed into competent cells. The introduced mutations were verified by sequencing.
Overexpression of CT and radioactive labeling of translation products.
The labeling protocol was modified from published protocols (22, 23). MG1655 strains containing various plasmid combinations were first grown overnight in minimal E medium (24) containing 0.4% glucose, 0.1% Casamino Acids, and 0.002% uracil. For labeling, these strains were then subcultured into minimal E medium (26) containing 0.4% glucose and 0.002% uracil and supplemented with 0.5 g/liter of an 18-amino-acid mixture (0.1% of all amino acids, excluding methionine and cysteine). The medium was also supplemented with the antibiotics sodium ampicillin (100 μg/ml), kanamycin sulfate (20 μg/ml), and chloramphenicol (50 μg/ml). The cultures were grown to an OD600 of 0.4. Each culture was then split in half, and IPTG (0.1 mM) was added to one of the two cultures to induce CT tetramer overproduction. Both cultures were allowed to grow for approximately 30 min at 37°C to allow for the expression of the accD-accA minioperon in the IPTG-supplemented culture. After this interval, the cells were harvested by centrifugation and washed twice with and resuspended in the same medium minus IPTG. After 30 min of additional growth at 37°C, rifampin (200 μg/ml) was added, and the cultures were incubated an additional 30 min at 37°C to block host RNA polymerase activity (22, 23). The newly synthesized proteins specifically encoded by the T7 polymerase-transcribed mRNA were then labeled by removing 0.2 ml of each culture to a separate tube containing 4 μl of 1 mCi/ml [35S]methionine (1,175 Ci/mmol). The [35S]methionine labeling tube was transferred to a 30°C water bath for 5 min, and the labeling reaction was stopped by placing the tube on ice. After 10 min on ice, the labeled cells were harvested in a microcentrifuge, and the radioactive supernatant was discarded. The labeled cell pellets were suspended in 100 μl SDS cracking buffer (60 mM Tris-HCl [pH 6.8], 10% glycerol, 0.01% bromophenol blue, 1% SDS, 1% 2-mercaptoethanol), and the proteins were denatured at 100°C for 5 min before loading onto a polyacrylamide SDS polyacrylamide gel electrophoresis (PAGE) gel. The labeled protein bands were then quantitated by phosphorimaging of the dried gel and quantitated using Fujifilm Image Gauge data analysis software. At the time of radioactive labeling, optical density of the remaining culture was measured for normalization, and the cell pellets were saved for Western blot analysis.
Western blotting.
The samples were run in parallel to the 35S-labeled samples, with the nonradioactive culture being used for analysis. The proteins were separated on an SDS-PAGE gel and then transferred to an Immobilon polyvinylidene difluoride (PVDF) membrane (Millipore). The gel, along with blotting filter paper cut to size, was incubated in blotting buffer which contained 250 mM Tris base, 192 mM glycine, and 20% methanol (pH 7.5). The PVDF membrane was soaked in methanol briefly for activation. The membrane and gel were sandwiched together with the blotting filter paper and transferred using a semidry transfer apparatus (20 V for 30 min). After transfer, the membrane was washed in TTBS (10 mM Tris base, 0.09% NaCl, and 0.1% Tween 20 at pH 7.5). The membrane was then blocked in TTBS containing 5% dry milk with shaking at room temperature for 1 h. The blocking buffer was discarded and the membrane was incubated with primary antipentahistidine mouse antibody (GE Healthcare) diluted 1:3,000 in blocking buffer for 1 h at room temperature with orbital shaking. After incubation, the membrane was rinsed once with TTBS and then 3 times with orbital shaking for 10 min each. Anti-mouse IgG horseradish peroxidase-linked secondary antibody (GE Healthcare) was then incubated with the membrane in a 1:10,000 dilution in blocking buffer for 1 h at room temperature with orbital shaking. The membrane was then quickly rinsed once as described before and then 3 additional times for 10 min each. SuperSignal West Femto (Thermo Scientific) substrate was then added to the membrane and incubated for 5 min. The membrane was then imaged and quantitated using a Bio-Rad Chemidoc instrument with its accompanying software.
RESULTS
Experimental design.
The complexities of testing the effects of a translation product on the translation of its encoding mRNA in vivo required an experimental system in which the CT tetramer production could be distinguished from translation of the target mRNAs. The separation was achieved by the use of two RNA polymerases having different properties in the presence of the antibiotic, rifampin (Fig. 2). Note that more straightforward approaches were precluded by the fact that accA and accD genes are essential for growth of E. coli (11), and thus cells lacking CT cannot be obtained. E. coli RNA polymerase was used for overproduction of CT tetramers, whereas phage T7 RNA polymerase was used to produce the mRNAs targeted by the putative translational repression mechanism. The two RNA polymerases differ in their response to rifampin and in the ability of T7 polymerase to specifically recognize the T7 promoter. This antibiotic inactivates E. coli RNA polymerase, whereas T7 RNA polymerase is unaffected (22, 23, 25). Therefore, following accumulation of the CT tetramers and T7 RNA polymerase, further synthesis of these proteins could be blocked by rifampin addition. In contrast, the T7 RNA polymerase accumulated prior to rifampin addition would continue to produce the mRNAs that are the putative targets of translational repression. Labeling with [35S]methionine would specifically monitor translation of these mRNA molecules.
FIG 2.
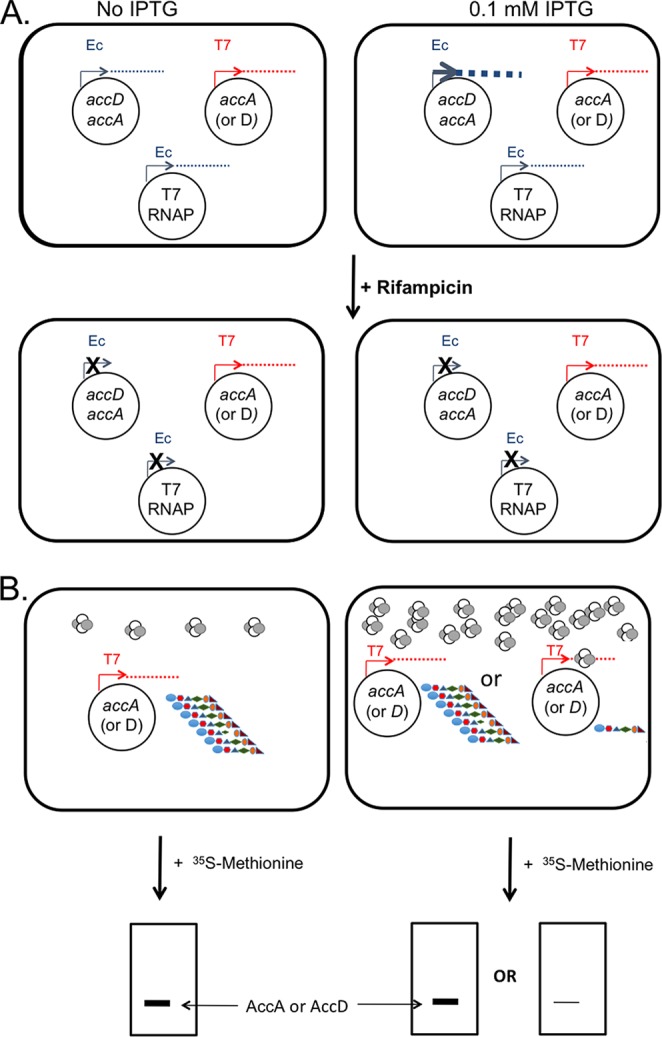
Experimental design. (A) The E. coli MG1655 host strain carried three compatible plasmids. The color of the promoter symbol denotes the RNA polymerase that transcribes the gene(s) of interest. These plasmids were a low-copy-number kanamycin-resistant plasmid encoding the two CT proteins under the control of the phage T5 promoter (in blue; pACS281), a medium-copy-number chloramphenicol-resistant plasmid encoding phage T7 RNA polymerase under the control of the arabinose (paraBAD) promoter (in blue; pTARA), and a low-copy-number plasmid encoding either AccA or AccD under the control of the phage T7 promoter (in red; pACS243 or pACS245, respectively). The phage T5 and araBAD promoters are recognized only by the rifampin-sensitive RNA polymerase of the E. coli host, whereas the phage T7 promoter is recognized only by the rifampin-insensitive T7 RNA polymerase. Cultures carrying the three plasmids were grown to mid-exponential phase and split in half. One half received IPTG to induce CT overexpression, whereas the other half received no inducer (low expression level denoted by the small dot size). Following growth to allow CT accumulation, IPTG was removed and the cells were resuspended in fresh medium and allowed to resume growth. Rifampin was then added to block utilization of E. coli promoters, and the cultures were incubated to allow degradation of nascent host mRNAs. (B) Following incubation, a small portion of each culture was briefly labeled with [35S]methionine to monitor translation (the proteins are denoted by the chain of multicolored shapes) of the accA or accD mRNA produced by T7 RNA polymerase to test whether or not the presence of higher concentrations of CT tetramers (the small tetrameric shapes) bound the mRNA and inhibited its translation. The labeled proteins were then separated by SDS-PAGE, and the band intensities were quantitated using a phosphoimager and cognate software. The cartoon gels at the bottom of the figure give the possible experimental outcomes (AccA and AccD are of similar size). The portions of the cultures that were not exposed to [35S]methionine were used to assay CT overexpression by Western blotting.
The system of three compatible plasmids (Fig. 2; see also Materials and Methods) allowed us to produce either the accA or accD mRNAs from the T7 promoter in the presence of high or low levels of the AccA2-AccD2 CT tetramer and specifically monitor translation of these mRNAs. Hence, following rifampin addition and subsequent addition of [35S]methionine, the only radioactive translation products formed were those encoded by the mRNAs produced by T7 RNA polymerase. In these experiments, the very low copy number (∼5) of the pVIET T7 expression vector (26) was used, and either accA or accD was placed downstream of the T7 polymerase promoter and ribosome binding site of the vector. These constructs included a large segment of DNA downstream of the acc gene coding sequence to ensure that the normal mRNA species minus the upstream untranslated segments would be available for regulation. Note that Meades et al. (12) reported that the untranslated segments played no role in CT binding. The vectors were modified to remove the lacO element of the promoter in order to avoid the complication of having two different IPTG-controlled promoters. T7 RNA polymerase was expressed from an arabinose promoter on a third compatible plasmid, pTARA (27). The pTARA promoter function was fully repressed by the presence of glucose (and absence of arabinose) in order to minimize the amount of T7 polymerase present. These growth conditions plus the low copy number of the T7 promoter vector were intended to keep the accA or accD mRNA levels low in order to allow sensitive detection of translational repression by CT.
CT overexpression.
A synthetic accD-accA minioperon plasmid (pACS280) was constructed to express CT from the powerful phage T5 promoter (28). This promoter is recognized by E. coli RNA polymerase but not by phage T7 RNA polymerase and is controlled by a pair of lacO operator sequences (the plasmid also encoded the LacI repressor). The minioperon was constructed such that both proteins carry a pentahistidine tag. AccD was C-terminally tagged, whereas AccA was N-terminally tagged, a tag configuration that gave the maximal CT activity (data not shown). Upon induction of the minioperon with IPTG, a large increase in CT expression was seen, as determined by Western blotting using an antibody against the pentahistidine tags of the CT subunits (Fig. 3). The samples analyzed were the portions of the cultures that had not been labeled with [35S]methionine (see below). For Western blotting, the nonradioactive samples were normalized by culture turbidity and the proteins were separated by SDS-PAGE. The protein bands were transferred from the gels to a PVDF membrane and processed by Western blotting with an antipentahistidine antibody (Fig. 3A, B, and C). Purified AccA was used for controls and quantitation standards (Fig. 3A, B, and C). For the [35S]methionine labeling, the strains also carried a plasmid encoding either pentahistidine-tagged AccA (pACS243) or AccD (pACS245) under T7 polymerase control. Basal expression from the T7 promoter gave a band visible in cultures lacking IPTG (e.g., Fig. 3A, bottom, lanes 5 and 8). However, these proteins should not contribute to the CT levels due to the lack of the other subunit, and the presence of these bands indicates that AccA and AccD are stable over this time interval when expressed alone. The IPTG-induced cultures showed 7- to 27-fold increases in tetramer expression from the phage T5 promoter plasmid relative to the uninduced cultures based on quantitation of the blot intensities (these are minimum overexpression levels based on the T7-expressed single subunits of the uninduced samples; the uninduced tetramer components were below levels detectable by Western blotting). The Western blotting results were confirmed both by the relative amounts of pentahistidine-tagged CT recovered from induced and uninduced cultures by Ni2+ chelate chromatography and the radioactive assay of partially purified extracts of the CT overexpression strain (66.4 ± 3.7 milliunits per mg) versus those of the wild-type strain (12.8 ± 0.4 milliunits per mg). The partial purification is likely to overstate the wild-type activity due to its increased relative abundance that results from the required fractionation (3). Proper assembly of the overexpressed CT was confirmed by assay of CT activity following purification using a coupled spectrophotometric assay (20). The wild-type CT tetramer preparation had an activity of 29.7 ± 0.6 units/mg, a value in good agreement with those reported elsewhere (20).
FIG 3.

Overproduction of the wild-type CT tetramer and its effect on translation of the accA or accD mRNA. (A to C) The upper phosphorimager scans of the gels show the results of [35S]methionine labeling (35S Met), whereas the lower gels are results from Western blotting assays of CT overexpression. The lanes in each panel of the two gels are in strict correspondence. The host strain was E. coli K-12 MG1655. Note that the loss of resolution resulting from the Western blotting transfer step obscures separation of the similarly sized AccA (35.2 kDa) and AccD (33.2 kDa) subunits. Both proteins are present as demonstrated by the high CT activity of the purified protein. (A) Upper gel, [35S]methionine labeling of AccA (lanes 5 to 7) or AccD (lanes 8 to 10) expressed from the mRNAs transcribed from the T7 promoter in the presence or absence of host RNA polymerase-expressed CT overproduction. The labeling of either AccA or AccD with [35S]methionine in the presence of rifampin was following cultures left without induction or induced for CT overproduction with IPTG (100 or 500 μM). The plasmid used for CT overproduction was pACS280, whereas the T7 promoter plasmids encoding AccA and AccD were pACS243 and pACS245, respectively. Lower gel, Western blot assays of CT overexpression. Extracts of the unlabeled cultures performed in parallel with the [35S]methionine-labeling experiments (see Materials and Methods). CT was expressed from plasmid pACS280 without or with induction by IPTG, as given. Either the accA or the accD T7 expression plasmid (pACS243 or pACS245, respectively) was present for assay of the encoded CT subunit expression by [35S]methionine labeling. The band intensity responses of the Western blot to differing levels of purified AccA and the relative CT overexpression in the absence or with IPTG induction are shown. Lanes 1 to 3 show quantitation standards of decreasing quantities of purified AccA (3.31, 0.882, and 0.441 μg). Lane 4 shows a control AccA protein produced from a T7 transcript that encodes a protein containing a thrombin tag adjacent to the pentahistidine tag that for unknown reasons results in a protein that migrates more slowly than the AccA species encoded by the CT expression plasmid. Basal expression from the T7 promoter produced the AccA subunit present in lanes 5 to 7 (migrating slower than the CT complex) and the AccD subunit present in lane 8 (which migrates similarly to the CT complex and is thus obscured in lanes 9 and 10). These subunits are unable to form CT tetramers due to the lack of overexpression of the other subunit. Comparison of the intensities of the tetramer bands to that of the “missing” subunit (that not present in the T7 expression plasmid) in the lanes that lacked IPTG gives a rough estimate of the extent of overproduction. In the uninduced samples, tetramer expression by the host RNA polymerase was below the level of detection, and thus direct comparison with the subunit expressed from the T7 expression plasmid gave minimum ratios of overexpression for lanes 6, 7, 9, and 10 of >7-fold, 14-fold, 14-fold, and 27-fold, respectively. (B) The effects of overproduction of this mutant CT on translation of the accA (lanes 5 and 6) or accD (lanes 7 and 8) mRNAs. This experiment is essentially identical to that of panel A except that the CT expressed was from plasmid pACS281, which encoded an AccD subunit that lacked zinc finger function due to two cysteine-to-alanine substitutions of residues 27 and 30 (12). The IPTG concentration was 100 μM, which gave minimum overexpression levels of 7-fold (accA experiment) and 9-fold (accD experiment). Lanes 1 to 3 of the Western blot shows the purified AccA standard (3.31, 0.882, and 0.441 μg) as well as AccA expressed by T7 polymerase in lane 4. (C) This experiment assayed translation of the accA (lanes 5 and 6) or accD (lanes 7 and 8) mRNAs in the absence of CT overexpression (the empty vector plasmid, pACS285, was used), and therefore the proteins labeled with [35S]methionine are the same as those detected by Western blotting. The four AccA quantitation standard lanes were loaded with 3.31, 0.882, 0.441, or 0.221 μg of protein (lanes 1 to 4). (D) The relative changes in intensity of the 35S-labeled protein bands from uninduced samples and those induced with 100 μM IPTG are given. No significant decreases in 35S-labeled protein levels were found. The intensity values were 1.16 ± 0.14, 1.1 ± 0.03, 1.1 ± 0.09, 1.02 ± 0.066, 1.09 ± 0.072, and 0.96 ± 0.11. These data were obtained from three biological replicates and are given as standard errors. D*A denotes the CT tetramer containing the mutant (C27A C30A) AccD protein. In the figure, WB denotes Western blot.
Effects of CT overexpression on translation of accA or accD mRNA produced by T7 polymerase.
The triple-plasmid system (Fig. 2) allowed IPTG-dependent manipulation of CT tetramer levels, whereas T7 polymerase transcription of either accA or accD mRNAs in the presence of rifampin allowed selective assay of translation of these mRNAs by [35S]methionine labeling. The strains were grown in a chemically defined medium (see Materials and Methods) lacking sulfur amino acids. At mid-exponential growth phase, the E. coli strain MG1655 cultures (containing either the T7 accA or accD expression plasmid) were split in half. One half received IPTG to induce CT expression, while the other half was left unsupplemented. Following a period of growth to allow CT overexpression, IPTG was removed and the cultures were treated with rifampin. The cultures were then incubated for 30 min to allow full inactivation of the host RNA polymerase and decay of host-encoded mRNAs (22, 23). A small portion of each culture was then briefly labeled with [35S]methionine (Fig. 3A, B, and C), and the remaining culture volumes were used to assay CT levels by Western blotting. The radioactive samples were then processed for SDS-PAGE, and the intensities of the radioactive bands were determined by phosphorimaging. The lack of labeled proteins other than the CT subunits indicates the mRNAs present at the time of rifampin addition had decayed as expected (22, 23). Note that the AccA and AccD subunits produced from the CT minioperon plasmid are of similar size, and the loss of resolution resulting from transfer from gel to membrane during Western blotting obscures the separation (Fig. 3C).
The data given in Fig. 3A to C consist of two aligned gels. The upper gel in each panel is the autoradiogram from [35S]methionine labeling, whereas the lower gel is the Western blot quantitation of the level of CT overexpression in the remainder of same cultures from [35S]methionine labeling. Each of the Western blot gels also contained various levels of purified AccA subunit to serve as an internal quantitation standard. Note that although the similarly sized AccA (35.2 kDa) and AccD (33.2 kDa) subunits are resolved on the autoradiograms due to the addition of a thrombin site on the T7-controlled subunits, the lack of thrombin site and diffusional spreading of the bands during the transfer step of Western blotting results in merging of the two bands of the CT tetramer. Hence, the AccA subunit expressed alone from the T7 promoter plasmid was also detected by Western blotting as a band that migrated slower than the merged CT bands due to the thrombin tag.
Interpretation of these experiments was straightforward. As depicted in the cartoon in Fig. 2B, if translational repression is exerted, the high levels (7- to 27-fold) of CT resulting from IPTG induction should decrease the levels of radioactive AccA or AccD synthesized, whereas in the absence of translational repression, the levels of labeled protein would be unaffected by the amount of CT tetramer present. We observed no visible decrease in the synthesis of radioactive AccA (Fig. 3A, lanes 5 to 7) or AccD (Fig. 3A, lanes 8 to 10) in the presence of the high levels of CT engendered by IPTG induction. Quantitation of these data (Fig. 3D) indicates that elevated levels of the CT (AccA2-AccD2) tetramer did not repress translation of the accA and accD mRNAs.
We performed experiments to guard against indirect effects of our experimental protocol (results shown in Fig. 3B and C). We constructed a plasmid that expressed CT tetramers containing an AccD subunit lacking the zinc finger moiety. Such mutant CT tetramers are reported to lack nucleic acid binding ability and to be severely deficient in CT activity (12). In agreement with the prior report, we purified the mutant CT tetramers and found only a barely detectable CT activity (0.3 ± 0.1 units/mg). The experiment of Fig. 3A was repeated with the plasmid encoding the mutant CT construct (pACS281) and gave essentially identical results to those obtained with the active CT (compare Fig. 3A and B). Quantitation (Fig. 3D) showed that overproduction of the mutant CT had no effect on translation of the accA and accD mRNAs produced by T7 polymerase. Finally, in Fig. 3C, an experiment in the absence of CT overexpression was performed (the empty CT expression vector pACS285 was used). The levels of [35S]methionine-labeled AccA and AccD proteins were essentially identical to those obtained in the presence of CT overexpression (Fig. 3D).
It should be noted that T7 RNA polymerase transcribes at a rate about 5-fold faster than E. coli RNA polymerase (25), and this could affect polyribosome formation (although this could be offset by the absence of other mRNAs to compete for ribosome binding). A deficiency in polyribosome assembly would expose more RNA to CT binding and thus should increase the putative translational repression by CT. Despite this possibility, we observed no repression of translation of the accA or accD mRNA.
DISCUSSION
As outlined in the introduction, transcription and translation are very strongly coupled in bacteria, and the coupling is maintained by at least two different mechanisms. We have no discrete explanation for the translational repression observed in vitro by Meades et al. (12) and the lack of such an effect in our in vivo experiments. However, we have noted several problematical features of the prior work and describe several of these. Meades and coworkers (12) initiated their studies by showing that CT bound to DNA and that the zinc finger structure was required for binding. They proceeded to find that various RNA preparations inhibited DNA binding and stated that the accA and accD mRNAs were more effective than other RNA preparations, although no data were given. However, the other RNA preparations tested (a total RNA extract from E. coli and tRNA from yeast) would consist largely of double-stranded RNA molecules (rRNA and tRNA) and thus were not strictly comparable. In other work, both DNA and RNA were found to inhibit CT enzyme activity, and the weak specificity of mRNA binding (see the introduction) casts further doubt on the physiological relevance of their observations. To test for translation repression, Meades and coworkers (12) used a commercial E. coli in vitro transcription-translation kit (now discontinued by the supplier). Unfortunately, the resulting data were not quantitated, and as recently pointed out (29), these transcription-translation preparations are designed for protein production and not properly constituted such that all RNA polymerase molecules are coupled to translation and all ribosomes are coupled to nascent mRNAs. Hence, these systems do not accurately mimic the in vivo situation. Indeed, development of an in vitro expression system in which translation is strictly coupled to transcription required detailed analysis of the intermediate steps of expression and purification of several components (29). Finally, Meades and coworkers (12) reported the interesting result that CT inhibition of translation of the accA and accD mRNAs was reversed by the addition of acetyl-CoA. However, very high acetyl-CoA concentrations were required (∼1 mM), and these data are difficult to interpret, because only acetyl-CoA was tested (and not free CoA, malonyl-CoA, or an acyl-CoA unrelated to fatty acid synthesis, such as succinyl-CoA). Since CT binding of mRNAs was reported to be sensitive to ionic conditions (24), the effects of acetyl-CoA could be the result of altering the ionic environment of the system.
ACKNOWLEDGMENT
This work was supported by National Institutes of Health (NIH) grant AI15650 from the National Institute of Allergy and Infectious Diseases (NIAID).
Footnotes
Published ahead of print 25 August 2014
REFERENCES
- 1.Cronan JE, Jr, Waldrop GL. 2002. Multi-subunit acetyl-CoA carboxylases. Prog. Lipid Res. 41:407–435. 10.1016/S0163-7827(02)00007-3. [DOI] [PubMed] [Google Scholar]
- 2.Bilder P, Lightle S, Bainbridge G, Ohren J, Finzel B, Sun F, Holley S, Al-Kassim L, Spessard C, Melnick M, Newcomer M, Waldrop GL. 2006. The structure of the carboxyltransferase component of acetyl-CoA carboxylase reveals a zinc-binding motif unique to the bacterial enzyme. Biochemistry 45:1712–1722. 10.1021/bi0520479. [DOI] [PubMed] [Google Scholar]
- 3.Guchhait RB, Polakis SE, Dimroth P, Stoll E, Moss J, Lane MD. 1974. Acetyl coenzyme A carboxylase system of Escherichia coli. Purification and properties of the biotin carboxylase, carboxyltransferase, and carboxyl carrier protein components. J. Biol. Chem. 249:6633–6645. [PubMed] [Google Scholar]
- 4.Li SJ, Cronan JE., Jr 1992. The genes encoding the two carboxyltransferase subunits of Escherichia coli acetyl-CoA carboxylase. J. Biol. Chem. 267:16841–16847. [PubMed] [Google Scholar]
- 5.Li SJ, Cronan JE., Jr 1992. The gene encoding the biotin carboxylase subunit of Escherichia coli acetyl-CoA carboxylase. J. Biol. Chem. 267:855–863. [PubMed] [Google Scholar]
- 6.Choi-Rhee E, Cronan JE. 2003. The biotin carboxylase-biotin carboxyl carrier protein complex of Escherichia coli acetyl-CoA carboxylase. J. Biol. Chem. 278:30806–30812. 10.1074/jbc.M302507200. [DOI] [PubMed] [Google Scholar]
- 7.Ishihama Y, Schmidt T, Rappsilber J, Mann M, Hartl FU, Kerner MJ, Frishman D. 2008. Protein abundance profiling of the Escherichia coli cytosol. BMC Genomics 9:102. 10.1186/1471-2164-9-102. [DOI] [PMC free article] [PubMed] [Google Scholar]
- 8.Kuntumalla S, Braisted JC, Huang ST, Parmar PP, Clark DJ, Alami H, Zhang Q, Donohue-Rolfe A, Tzipori S, Fleischmann RD, Peterson SN, Pieper R. 2009. Comparison of two label-free global quantitation methods, APEX and 2D gel electrophoresis, applied to the Shigella dysenteriae proteome. Proteome Sci. 7:22. 10.1186/1477-5956-7-22. [DOI] [PMC free article] [PubMed] [Google Scholar]
- 9.Lu P, Vogel C, Wang R, Yao X, Marcotte EM. 2007. Absolute protein expression profiling estimates the relative contributions of transcriptional and translational regulation. Nat. Biotechnol. 25:117–124. 10.1038/nbt1270. [DOI] [PubMed] [Google Scholar]
- 10.Li GW, Burkhardt D, Gross C, Weissman JS. 2014. Quantifying absolute protein synthesis rates reveals principles underlying allocation of cellular resources. Cell 157:624–635. 10.1016/j.cell.2014.02.033. [DOI] [PMC free article] [PubMed] [Google Scholar]
- 11.Baba T, Ara T, Hasegawa M, Takai Y, Okumura Y, Baba M, Datsenko KA, Tomita M, Wanner BL, Mori H. 2006. Construction of Escherichia coli K-12 in-frame, single-gene knockout mutants: the Keio collection. Mol. Syst. Biol. 2:2006.0008. 10.1038/msb4100050. [DOI] [PMC free article] [PubMed] [Google Scholar]
- 12.Meades G, Jr, Benson BK, Grove A, Waldrop GL. 2010. A tale of two functions: enzymatic activity and translational repression by carboxyltransferase. Nucleic Acids Res. 38:1217–1227. 10.1093/nar/gkp1079. [DOI] [PMC free article] [PubMed] [Google Scholar]
- 13.Gowrishankar J, Harinarayanan R. 2004. Why is transcription coupled to translation in bacteria? Mol. Microbiol. 54:598–603. 10.1111/j.1365-2958.2004.04289.x. [DOI] [PubMed] [Google Scholar]
- 14.Squires CL, Zaporojets D. 2000. Proteins shared by the transcription and translation machines. Annu. Rev. Microbiol. 54:775–798. 10.1146/annurev.micro.54.1.775. [DOI] [PubMed] [Google Scholar]
- 15.Mitarai N, Sneppen K, Pedersen S. 2008. Ribosome collisions and translation efficiency: optimization by codon usage and mRNA destabilization. J. Mol. Biol. 382:236–245. 10.1016/j.jmb.2008.06.068. [DOI] [PubMed] [Google Scholar]
- 16.Noll H. 2008. The discovery of polyribosomes. Bioessays 30:1220–1234. 10.1002/bies.20846. [DOI] [PubMed] [Google Scholar]
- 17.Peters JM, Vangeloff AD, Landick R. 2011. Bacterial transcription terminators: the RNA 3′-end chronicles. J. Mol. Biol. 412:793–813. 10.1016/j.jmb.2011.03.036. [DOI] [PMC free article] [PubMed] [Google Scholar]
- 18.Roberts JW. 2010. Molecular biology. Syntheses that stay together. Science 328:436–437. 10.1126/science.1189971. [DOI] [PubMed] [Google Scholar]
- 19.Koslover DJ, Fazal FM, Mooney RA, Landick R, Block SM. 2012. Binding and translocation of termination factor Rho studied at the single-molecule level. J. Mol. Biol. 423:664–676. 10.1016/j.jmb.2012.07.027. [DOI] [PMC free article] [PubMed] [Google Scholar]
- 20.Blanchard CZ, Waldrop GL. 1998. Overexpression and kinetic characterization of the carboxyltransferase component of acetyl-CoA carboxylase. J. Biol. Chem. 273:19140–19145. 10.1074/jbc.273.30.19140. [DOI] [PubMed] [Google Scholar]
- 21.Woodcock DM, Crowther PJ, Doherty J, Jefferson S, DeCruz E, Noyer-Weidner M, Smith SS, Michael MZ, Graham MW. 1989. Quantitative evaluation of Escherichia coli host strains for tolerance to cytosine methylation in plasmid and phage recombinants. Nucleic Acids Res. 17:3469–3478. 10.1093/nar/17.9.3469. [DOI] [PMC free article] [PubMed] [Google Scholar]
- 22.Tabor S. 2001. Expression using the T7 RNA polymerase/promoter system. Curr. Protoc. Mol. Biol. Chapter 16:Unit 16.2. 10.1002/0471142727.mb1602s11. [DOI] [PubMed] [Google Scholar]
- 23.Studier FW, Moffatt BA. 1986. Use of bacteriophage T7 RNA polymerase to direct selective high-level expression of cloned genes. J. Mol. Biol. 189:113–130. 10.1016/0022-2836(86)90385-2. [DOI] [PubMed] [Google Scholar]
- 24.Vogel HJ, Bonner DM. 1956. Acetylornithinase of Escherichia coli: partial purification and some properties. J. Biol. Chem. 218:97–106. [PubMed] [Google Scholar]
- 25.Chamberlin MJ, Ring J. 1972. Studies of the binding of Escherichia coli RNA polymerase to DNA. V. T7 RNA chain initiation by enzyme-DNA complexes. J. Mol. Biol. 70:221–237. [DOI] [PubMed] [Google Scholar]
- 26.Hoang TT, Ma Y, Stern RJ, McNeil MR, Schweizer HP. 1999. Construction and use of low-copy number T7 expression vectors for purification of problem proteins: purification of Mycobacterium tuberculosis RmlD and Pseudomonas aeruginosa LasI and RhlI proteins, and functional analysis of purified RhlI. Gene 237:361–371. 10.1016/S0378-1119(99)00331-5. [DOI] [PubMed] [Google Scholar]
- 27.Wycuff DR, Matthews KS. 2000. Generation of an AraC-araBAD promoter-regulated T7 expression system. Anal. Biochem. 277:67–73. 10.1006/abio.1999.4385. [DOI] [PubMed] [Google Scholar]
- 28.Brunner M, Bujard H. 1987. Promoter recognition and promoter strength in the Escherichia coli system. EMBO J. 6:3139–3144. [DOI] [PMC free article] [PubMed] [Google Scholar]
- 29.Castro-Roa D, Zenkin N. 2012. In vitro experimental system for analysis of transcription-translation coupling. Nucleic Acids Res. 40:e45. 10.1093/nar/gkr1262. [DOI] [PMC free article] [PubMed] [Google Scholar]