

Abstract
Clothing textiles protect our human body against external factors. These textiles are not sterile and can harbor high bacterial counts as sweat and bacteria are transmitted from the skin. We investigated the microbial growth and odor development in cotton and synthetic clothing fabrics. T-shirts were collected from 26 healthy individuals after an intensive bicycle spinning session and incubated for 28 h before analysis. A trained odor panel determined significant differences between polyester versus cotton fabrics for the hedonic value, the intensity, and five qualitative odor characteristics. The polyester T-shirts smelled significantly less pleasant and more intense, compared to the cotton T-shirts. A dissimilar bacterial growth was found in cotton versus synthetic clothing textiles. Micrococci were isolated in almost all synthetic shirts and were detected almost solely on synthetic shirts by means of denaturing gradient gel electrophoresis fingerprinting. A selective enrichment of micrococci in an in vitro growth experiment confirmed the presence of these species on polyester. Staphylococci were abundant on both cotton and synthetic fabrics. Corynebacteria were not enriched on any textile type. This research found that the composition of clothing fibers promotes differential growth of textile microbes and, as such, determines possible malodor generation.
INTRODUCTION
Clothing textiles are in close contact with the microorganisms of the skin and those of the environment. The clothes create a warm and often moist environment on the skin, which leads to the growth of bacteria. In some cases, these microorganisms lead to unpleasant odors, staining, fabric deterioration, and even physical irritation, such as skin allergies and skin infections (1). The skin consists of various niches, each with its specific bacterial community present (2, 3). Very dry areas, such as the forearm, trunk, and legs, harbor only 102 bacteria per cm2, while the axillae, umbilicus, and toe web spaces contain up to 107 bacteria per cm2 (4). The human skin contains up to 19 different phyla (5) and even in one niche, the axillae, up to 9 different phyla are present (6). Skin microorganisms transfer to the clothing fibers and interact with these in several phases: adherence, growth, and damage to the fibers. Growth of bacteria is due to sweat secretions, skin desquamation, natural particles present in the clothing fibers or on the fibers itself, or nutrition from elsewhere in the environment. An important factor determining bacterium-fiber interaction is the origin and the composition of the clothing textile. A large discrepancy exists in the way bacteria adhere to natural versus synthetic fibers. It is posed that natural fibers are more easily affected by the microbiota due to the natural nutrients present in the clothing and the ability to adsorb sweat components (1). Cellulose fibers are degraded by a range of bacteria and fungi, possessing cellulolytic enzymes (7). Synthetic fibers gather moisture in the free space between the fibers but do not adsorb it on the fibers themselves. Synthetic fibers are therefore less susceptible toward bacterial breakdown, also due to the polyethylene terephthalate (PET) basis of the fiber (1).
Axillary malodor does not only emanate from the axillary skin but also from the textiles near the axillary region (8, 9). Dravniek et al. (9) refers to this as the primary odor, originating from the axilla itself, and the secondary odor, originating from clothing in contact with the axilla. The odor would then differ between the two sites (10). It is found that a stronger body odor is generated by wearing synthetic clothing textiles compared to natural textiles (10). This is held as a common belief; nevertheless, very few published data support this finding. Much research has nonetheless been conducted on controlling body odor by adding antimicrobials to textile fabrics (11–14).
Corynebacterium spp. are determined as the odor causing microorganisms in the human axilla (15). It is yet unclear which microorganisms are associated with the odor formation in clothing textiles. Few studies have been performed on determining the microbiota living in clothes. Therefore, this research focuses on (i) the determination of the microbial communities living in clothes, (ii) determining whether different textiles host different communities, and (iii) determining the odor profile of different used fabrics after a sport session. This study focuses primarily on cotton (natural, consisting mainly of cellulose) versus polyester (synthetic) clothing textiles. An in vivo case study is performed on 26 healthy people, wearing 100% cotton, 100% polyester, and intermediate cotton/synthetic clothing, doing a bicycle spinning session for 1 h. A period of 28 h was left between fitness and odor assessment, in order to let the bacteria grow on the textiles. A selected and trained odor panel assessed the odor of the individual T-shirts. The bacterial community is analyzed by means of denaturing gradient gel electrophoresis (DGGE). An in vitro growth experiment is performed to analyze the selective enrichment of isolates on different clothing fabrics.
MATERIALS AND METHODS
Study design.
First, an in vivo experiment was conducted with 26 healthy subjects, wearing cotton, synthetic, and mixed cotton-synthetic T-shirts, participating in an intensive bicycle spinning session of 1 h. The T-shirts were collected, sealed in plastic bags, and stored at room temperature in the dark, so bacterial growth occurred. Axillary swabs were taken to analyze the bacterial community on the skin. Odor assessment by a trained odor panel and subsequent bacterial extraction was performed on the whole T-shirt. The individual samples were plated to obtain pure colonies for sequencing. The DNA was extracted from axillary and T-shirt samples and the microbial community was investigated by means of DGGE. Descriptive diversity and dynamics analysis was performed on the results. Second, an in vitro growth experiment was conducted in which typical skin/textile microbial isolates were incubated on a range of sterile textile fibers in order to identify the selective growth or inhibition on the textiles. Third, contact angle measurements were performed to detect the affinity of micrococci toward polyester and cotton textiles.
Sampling.
Samples were taken from the T-shirt and the armpit skin of 26 healthy subjects (13 males and 13 females), participating in an intensive bicycle spinning session of 1 h. The median age was 39 years old (range, 20 to 60 years old) (Table 1). Every subject wore a freshly washed T-shirt. All were in good health and had not received any antibiotics for at least 2 months. The participants had no history of dermatological disorders or other chronic medical disorders and had no current skin infections. No attempts were made to control the subjects' diet or hygiene habits. All participants were residents living in the area of Willebroek (Belgium), with a temperate maritime climate by the North Sea and Atlantic Ocean. After 1 h of intensive bicycle spinning, the T-shirts were aseptically collected and separately sealed in plastic bags. The bags were kept at room temperature (20°C) in the dark for 28 h. This was done to simulate the home conditions and to let the microbial community grow on the specific clothing textiles. An axillary swab was taken from each participant, using a sterile cotton swab (Biolab, Belgium) that was formerly moistened with sterile physiological water. The swab was thoroughly swabbed for 15 s in the axillary region to detach and absorb the microorganisms, after which the tip was broken in a sterilized reaction tube filled with 1.0 ml of sterile physiological water (16). The bacterial samples were pelletized and frozen at −20°C until DNA extraction.
TABLE 1.
Metadata of the participating subjects
| Subject | Gender | Age (yr) | No. of washes/wk | No. of deo/wka | Textile type |
|---|---|---|---|---|---|
| 1 | M | 36 | 10 | 1 | 100% polyester |
| 2 | F | 28 | 10 | 7 | 82% polyester + 18% elastane |
| 3 | M | 29 | 12 | 7 | 100% cotton |
| 4 | M | 52 | 7 | 7 | 100% cotton |
| 6 | M | 40 | 7 | 7 | 100% polyester |
| 8 | M | 44 | 9 | 7 | 100% polyester |
| 9 | M | 36 | 7 | 10 | 100% polyester |
| 10 | F | 43 | 7 | 7 | 100% cotton |
| 11 | M | 42 | 7 | 9 | 100% polyester |
| 12 | M | 32 | 7 | 0 | 100% polyester |
| 13 | F | 35 | 7 | 0 | 100% polyester |
| 14 | F | 42 | 7 | 0 | 100% cotton |
| 15 | F | 41 | 7 | 10 | 34% cotton + 28% lyocell + 35% polyester + 3% elastane |
| 16 | F | 60 | 7 | 14 | 95% cotton + 5% elastane |
| 17 | M | 42 | 12 | 0 | 100% cotton |
| 18 | F | 54 | 7 | 7 | 95% cotton + 5% elastane |
| 19 | M | 21 | 7 | 10 | 100% cotton |
| 20 | M | 56 | 7 | 7 | 100% cotton |
| 21 | F | 30 | 7 | 9 | 95% cotton + 5% elastane |
| 22 | F | 49 | 14 | 7 | 100% cotton |
| 23 | F | 20 | 6 | 7 | 100% polyester |
| 24 | M | 31 | 10 | 5 | 100% cotton |
| 25 | F | 43 | 7 | 10 | 100% cotton |
| 26 | M | 38 | 4 | 9 | 100% polyester |
| 27 | F | 37 | 7 | 7 | 100% polyester |
| 30 | F | 36 | 4 | 9 | 95% cotton + 5% elastane |
deo, deodorant or antiperspirant applications.
Odor assessment.
Individual T-shirts in the plastic bags were presented to a panel of seven selected and screened human assessors. Assessors were selected by means of sensitivity to dilutions of n-butanol and wastewater and by means of the triangle test (17). Each member of the panel was presented three flasks, two of which were the same while the third contained a different odor. The flask was shaken, the stopper was removed, after which the vapors were sniffed. The panelists had to correctly identify the different flask. The triangle test was repeated three times, with a minimum of 2 days in between each measurement. The room in which the tests were conducted was free from extraneous odor stimuli, e.g., such as odors caused by smoking, eating, soaps, perfume, etc. A representative team of odor assessors was chosen from the pool of assessors. The odor assessors were familiar with the olfactometric procedures and met the following conditions: (i) older than 16 years and willing to follow the instructions; (ii) no smoking, eating, drinking (except water), or using chewing gum or sweets for 30 min before olfactometric measurement; (iii) free from colds, allergies, or other infections; (iv) no interference by perfumes, deodorants, body lotions, cosmetics, or personal body odor; and (v) no communication during odor assessment. The samples were assessed by seven odor characteristics: hedonic value (between −4 and +4), intensity (scale 0 to 6), musty (scale 0 to 10), ammonia (scale 0 to 10), “strongness” (scale 0 to 10), sweatiness (scale 0 to 10), and sourness (scale 0 to 10). A control odor measurement, a clean cotton T-shirt with random number, was served to the odor panel together with the other samples.
Statistical analysis odor characteristics.
The generated data set from the odor assessment was statistically analyzed and visualized in R (18). A heat map and scatterplot were generated to visually interpret the correlations between sensory variables. Significance cutoff values were set at 95% (α = 0.05), unless otherwise mentioned in the manuscript. Both a multivariate comparison of means as well as univariate analysis were run after assessment of the hypothesis. Univariate normality was assessed using a Shapiro-Wilk normality test. If normality could not be assumed, the Mann-Whitney (or Wilcoxon rank sum) test was executed to assess null hypothesis of a location shift μ = 0. The alternative hypotheses were selected based upon exploratory data analysis. Nonavailable observations were handled by case-wise deletions. Multivariate data sets were analyzed on their normal distribution using Mahalanobis distances in quantile-quantile (QQ) plots. Also, an E-statistic test of multivariate normality was executed (19). Multivariate homogeneity of group dispersions (variances) was assessed using the betadisper function from the package Vegan (20), an implementation of the PERMDISP2 procedure (21). Euclidean distance measures were used, as well as the spatial median for the group centroid. A Hotelling's T2 test was used to compare the multivariate data sets, comparing the multivariate means of each population (22). When necessary a chi-squared approximation was used for the test to allow for relaxation of the normality assumption.
Bacterial extraction from T-shirts.
The bacterial extraction occurred on the complete T-shirt, using TNE buffer (10 mM Tris-HCl [pH 8.0], 10 mM NaCl, 10 mM EDTA) (23). A 300-ml portion of TNE buffer was added to the plastic bag with the T-shirt, firmly sealed with tape, and vortexed for 10 min. The buffer was subsequently manually pressed out of the T-shirt and transferred into sterile 50-ml reaction tubes. The extracts were respectively used for isolation of bacteria and for DNA extraction. The bacterial extraction procedure was chosen after an optimization procedure (see Fig. S1 in the supplemental material). The method focused on the extraction of the bacteria of the whole T-shirt. It was not possible to extract the bacteria from one region (e.g., axillary region) of the T-shirt. A clean T-shirt was extracted, together with the other samples, as a control measurement.
Sanger sequencing of bacterial isolates.
The microorganisms were isolated from the T-shirts by the standard method of dilution plating on nutrient agar. Incubation of all plates was performed at 37°C in aerobic conditions and facultative anaerobic conditions using a gas-pack cultivation jar. The colonies were plated three times on new agar plates using the streak plate method to obtain bacterial isolates. A total of 91 isolates was obtained. The isolates were transferred into a 1.5-ml Eppendorf with 50 μl of sterile PCR water, vortexed, and stored at −20°C to extract DNA. Dereplication was done using DGGE after amplification by PCR using the 338F and 518R primers (24, 25). The analysis involved 31 nucleotide sequences. The 16S rRNA genes were subsequently amplified by PCR using 63F and 1378R (26). The PCR program were performed and checked as described below. Sanger sequencing was performed on the 16S rRNA amplicons, aligned, and compared to sequences from the National Center for Biotechnology Information (NCBI) database. The closest match of each isolate was identified. The bacterial isolates were constructed in an evolutionary taxonomic circular tree (see Fig. 2) using the neighbor-joining method (27), conducted in MEGA5 (28). The tree has branch lengths in the same units as those of the evolutionary distances used to infer the phylogenetic tree. The evolutionary distances were computed using the Jukes-Cantor method (29) and are in the units of the number of base substitutions per site. The codon positions included were first + second + third + noncoding. All ambiguous positions were removed for each sequence pair. There were a total of 1,172 positions in the final data set.
FIG 2.

Bacterial isolates obtained from the T-shirts after the spinning session represented in an evolutionary taxonomic circular tree, using the neighbor-joining method.
DNA extraction, PCR, and DGGE.
The bacterial solution in the TNE buffer was centrifuged for 5 min at 6,000 × g. The supernatant was discarded, and the obtained pellet was used for further DNA extraction. Total DNA extraction was performed using an UltraClean water DNA isolation kit (Mo Bio, USA). The DNA was stored at −20°C until further analysis. The DNA extraction was chosen after a comparative study of different DNA extraction methods (see Fig. S2 in the supplemental material). The 16S rRNA gene regions were amplified by PCR using 338F and 518R (24, 25). A GC clamp of 40 bp (24, 25) was added to the forward primer. The PCR program consisted of 10 min 95°C, followed by 35 cycles of 1 min at 94°C, 1 min at 53°C, and 2 min at 72°C, with a final elongation for 10 min at 72°C. Amplification products were analyzed by electrophoresis in 1.5% (wt/vol) agarose gels stained with ethidium bromide. DGGE was performed as previously reported (6). A control measurement was taken into account. To process and compare the different gels, a homemade marker of different PCR fragments was loaded onto each gel (6). Normalization and analysis of DGGE gel patterns was done with the BioNumerics software 5.10 (Applied Maths, Sint-Martens-Latem, Belgium). The different lanes were defined, the background was subtracted, differences in the intensity of the lanes were compensated for during normalization, and bands and band classes were detected.
Selective growth of bacteria on textiles.
To analyze the selective growth of pure bacterial strains on different clothing textiles, bacteria were inoculated and incubated on a sterile piece of textile in an in vitro growth experiment. A wide range of clothing textiles was screened: polyester, acryl, nylon, fleece, viscose, cotton, and wool. Five common skin bacteria were grown on the textiles: Staphylococcus epidermidis CC6 (GenBank accession no. KJ016246), Micrococcus luteus CC27 (GenBank accession no. KJ016267), Enhydrobacter aerosaccus (LMG 21877), Corynebacterium jeikeium (LMG 19049), and Propionibacterium acnes (LMG 16711). The bacteria were cultivated for 48 h in nutrient broth, washed in M9 medium and finally dissolved in fresh M9 medium. A sterile piece of textile of 25 cm2 was inoculated with 100 μl of the bacterial culture in a petri dish. The inoculated bacteria were incubated for 3 days at 37°C. The bacteria were subsequently extracted using 10 ml of TNE buffer (23). The bacterial suspensions were measured using flow cytometry. To verify the extraction efficiency of the different clothing textiles, the bacterial strains were immediately extracted after inoculation using 10 ml of TNE buffer. All experiments were carried out in triplicate. A control measurement, where bacteria were grown without textiles, was each time taken into account and deducted from the measurements.
Flow cytometry.
Flow cytometry was used as a fast microbial measurement technique. The laser detection point of the device beams one cell at the time (λmax = 488 nm), while the forward and side light scatter are detected. The samples were diluted 100 times in filtered Evian water (Danone Group, Paris, France) and stained with 1/100 SYBR green I dye (Invitrogen), as described in previous studies (30). The DNA-dye complex absorbs blue light (λmax = 497 nm) and emits green light (λmax = 520 nm). Prior to flow cytometric analysis, the stained samples were incubated for 15 min in the dark at room temperature. Every sample was measured in triplicate, using a BD Accuri C6 flow cytometer (BD Biosciences, Belgium). The measurements were processed using the BD Accuri C6 software.
Contact angle measurements.
The affinity of micrococci (Micrococcus luteus) toward specific clothing textiles (cotton and polyester) was measured by means of contact angle measurements on the fabrics and the micrococci, as described earlier (31). Drops of three different solutes were applied on the tissues to determine Lifshitz-Van der Waals and electron-donor and -acceptor components of the surface tension, using the Young-Dupré equation and the extended DLVO approach (31). The solutes (Milli-Q water, diiodomethane, and glycerol) had different physicochemical properties with known physicochemical parameters. Since the textile fabrics absorbed much moisture due to the large voids between the fibers, contact angles were carried out on substitute materials: PET plastic to simulate polyester fibers, since PET is the basic substance for polyester, and cardboard (cellulose) for cotton. Micrococcus luteus was cultivated in nutrient broth for 3 days at 37°C. The bacteria were filtered on a 0.45-μm-pore-size filter until a firm layer of micrococci was obtained, on which the contact angles were measured. Drop measurements were repeated at least 10 times for each liquid, whereby the average was taken. Anomalous measurements were rejected. All contact angles were measured using contact angle equipment (Krüss DSA10 goniometer; Krüss GmbH, Hamburg, Germany) equipped with contact angle calculation software (Drop Shape Analysis; Krüss GmbH).
Ethics statement.
The study was approved by the Ghent University Ethical Committee with approval number B670201112035. All participants gave their written consent to participate in this study, as well as consent to publish these case details.
Nucleotide sequence accession numbers.
Sequences for all of the strains were submitted to GenBank under accession numbers KJ016241 to KJ016271.
RESULTS
Odor differences between cotton and polyester clothing textiles.
The hedonic value (i.e., the pleasantness of the odor) was qualified by the odor panel on a scale from −4 (very unpleasant) to +4 (very pleasant). The average hedonic value of 100% cotton T-shirts was −0.61 ± 1.08, while for 100% polyester T-shirts, a significantly lower value of −2.04 ± 0.90 was determined (see Table S1 in the supplemental material). Polyester clothing after the spinning session smelled significantly less pleasant, and additionally, more intense, more musty, more ammonia, more strong, more sweaty and more sour (Fig. 1). The qualitative differences were the largest for the sourness, strongness, and mustiness. The data set of the odor analysis was examined on its multivariate normal distribution by means of Mahalanobis QQ-plots (data not shown). Deviation from the bisector and, as such, from multivariate normality was observed, as confirmed formally by the E-statistic test (P < 0.05). The multivariate means of cotton and polyester were compared to each other with the Hotelling two-sample T2 test. This gave a P value of 5.72 × 10⁻⁶, meaning that a significant difference was found between the multivariate means of the cotton and polyester samples. The correlations between the different variables are visually represented in the heat map in Fig. S3 in the supplemental material. The t test indicated no differences in deodorant/antiperspirant use among the 100% cotton and 100% polyester group (P = 0.86) (Table 1).
FIG 1.

Odor characterization of cotton (green) and polyester (red) clothing after a fitness experiment, assessed by the odor panel. The hedonic value was assessed between a value −4 (very unpleasant), 0 (neutral), and +4 (very pleasant) and rescaled between 0 and 8. The intensity represents the quantity of the odor, in a value between 0 (no odor) and 10 (very strong/intolerable). The qualitative odor characteristics musty, ammonia, strongness, sweatiness, and sourness were assessed between 0 and 10. The odor assessment is represented in box plots, with the middle black line as the median odor value and the small circles as the outliers. Polyester clothing smelled significantly more after a fitness session than cotton.
Bacterial isolation and identification.
Isolates of pure bacterial colonies were identified and are represented in Fig. 2. A total of 91 isolates was obtained from aerobic and anaerobic plating. The isolates were screened by DGGE and sequenced to allow identification. Figure 2 represents 31 unique species found on the T-shirts. Not only Gram-positive but also many Gram-negative bacteria were found. Many skin-resident staphylococci were isolated from the textiles. Isolates also belonged to the Gram-positive Bacillus spp., Gram-positive Micrococcus spp., and Gram-negative Acinetobacter spp. and to the Gram-negative Enterobacteriaceae family, among others, which are generally not found on the axillary skin. The isolates were classified into three bacterial phyla: Firmicutes, Actinobacteria, and Proteobacteria.
Bacterial fingerprinting of the textile microbiome.
DGGE fingerprinting analyses showed large diversities among the individual shirts. Although similar bacterial species were noticed, every textile microbiome was rather unique. Figure 3 shows the fingerprinting results of the 26 individual T-shirts. Apparent differences were found between cotton and synthetic clothing textiles after the fitness session. Particular bands were identified that correlated more with specific clothing fibers. Micrococcus spp. were predominantly found in synthetic clothing fabrics. Many micrococci were found on 100% polyester clothes, but they were also on mixed synthetic textiles, such as 82% polyester plus 18% elastane. Micrococci were also found on mixed synthetic/natural textiles, such as 95% cotton + 5% elastane and 35% polyester + 34% cotton + 28% lyocell + 3% elastane (Fig. 3). Staphylococcus hominis bands were solely present on the 100% cotton clothing. Staphylococcus spp. were detected in relatively large amounts in practically all T-shirts. Individual DGGE fingerprinting was performed on both textiles and axillary skin (see Fig. S4 in the supplemental material). The axillary region was chosen as a representative skin area and compared to the textile microbiome, since both are known to generate malodor. Large differences were seen in the bacterial fingerprint patterns between the axillary and textile microbiome. An enrichment of skin bacteria on the textile was frequently observed, such as the apparent enrichment of Staphylococcus epidermidis (Fig. 3). The fingerprint results show that selective bacterial growth occurs in synthetic and cotton clothing.
FIG 3.

DGGE bacterial profile of 26 individual T-shirts after the bicycle spinning session. The legend on the right represents the subject number, and the textile fibers are indicated as follows: P, polyester; C, cotton; E, elastane; and L, lyocell. The samples were separated between cotton and synthetic clothing fibers.
Selective bacterial growth on clothing textiles.
The selective growth of pure bacterial cultures was examined by means of an in vitro growth experiment on a range of different fabrics. The results, presented in Table 2, clearly indicated selective growth and inhibition for several species on the different fabrics. Enhydrobacter aerosaccus and Propionibacterium acnes were able to grow on almost every textile. Under the same conditions, Corynebacterium jeikeium was not able to grow on the textiles, as the log counts decreased. Staphylococcus epidermidis was able to grow on almost every textile, except viscose and fleece. Propionibacterium acnes showed a remarkable growth on nylon textile, with bacterial counts up to 2.25 × 10⁸ CFU per cm2. The log count difference among textiles was the most dissimilar for Micrococcus luteus. The largest growth was noted on polyester textiles (1-log growth increase; up to 1.72 × 10⁷ CFU per cm2), whereas the largest inhibition was noted on fleece textiles. This experiment confirmed the finding of selective growth of Micrococcus spp. on polyester clothing textiles, as well as no selective growth of Micrococcus spp. on cotton textiles. According to these results, viscose did not permit any growth of bacterial species. Wool, on the other hand, supported the growth of almost all bacteria. Nylon showed very selective bacterial growth. The growth of Staphylococcus, Propionibacterium, and Enhydrobacter spp. was enhanced, while the growth of Micrococcus and Corynebacterium spp. was inhibited. Growth on fleece likewise showed a selective profile. Enhydrobacter spp. were enhanced, Propionibacterium and Corynebacterium spp. remained at the same level, and Staphylococcus and Micrococcus spp. were inhibited. No growth (or inhibition) was observed on acryl textile for practically all species. Cotton textile indicated a growth for Propionibacterium, Staphylococcus, and Enhydrobacter spp., while practically no growth (or inhibition) was noted for Micrococcus and Corynebacterium spp. Polyester textile was associated the greatest growth for Propionibacterium, Enhydrobacter, and Micrococcus spp. Inhibition was recorded for Corynebacterium spp. on polyester. No growth (or inhibition) was noted for Staphylococcus spp.
TABLE 2.
Growth or inhibition (in log numbers) of bacterial species after a 3-day inoculation on different clothing textilesa
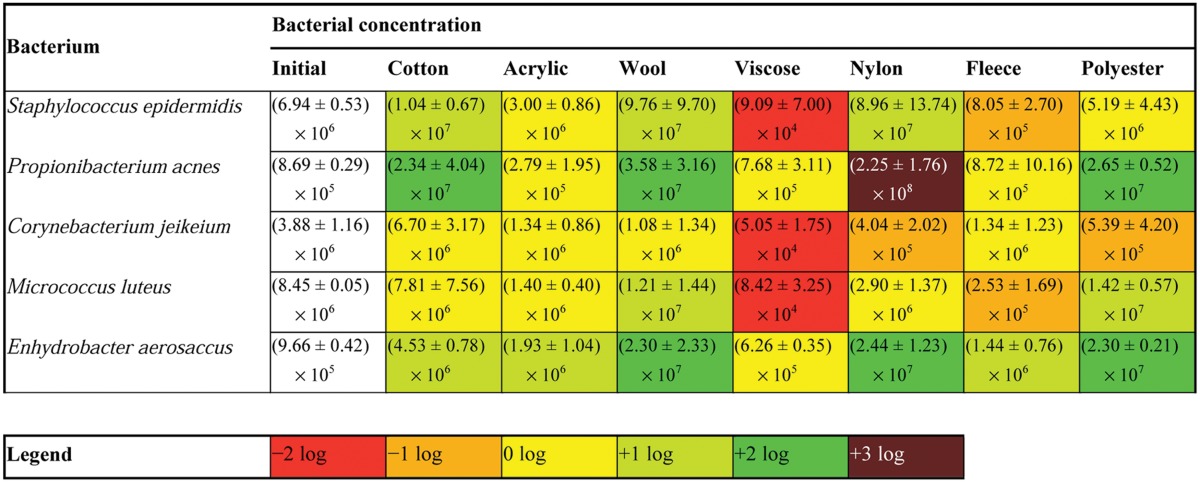
Average CFU/cm2 of the triplicates are represented, together with the standard deviations. A color code is given according to the log growth or reduction compared to the initial bacterial concentration.
Contact angle measurements.
A potential explanation for the selective growth is a dissimilar nonelectrostatic attraction between the bacterium and the different textile surfaces. Contact angle measurements were carried out (see Table S2 in the supplemental material) to determine the attraction or repulsion for Micrococcus luteus toward cotton (cellulose) and polyester (PET). Using the Young-Dupré equation, the contact angles were transformed into surface tension components, represented in Table S3 in the supplemental material. The interaction energy between micrococci and cotton (ΔG = −1.22 ± 1.00 J) was in the same range as the interaction energy between micrococci and polyester (ΔG = 0.24 ± 1.00 J). Both values were determined to be around 0. No differences were found in the interaction energies for micrococci and cotton and for micrococci and polyester.
DISCUSSION
It is generally accepted that the choice of clothing has an impact on malodor formation (10). This research showed that polyester clothes create a significantly higher malodor compared to cotton clothing after a fitness session and an incubation period. Significant differences were found for the hedonic value and the intensity of the odor, as well as all qualitative odor characteristics (musty, ammonia, strongness, sweatiness, and sourness). This corroborates earlier findings, where higher odor intensities were detected in polyester fabrics (10). The first reason for the different odor profile is explained by the difference in odor adsorbance. Polyester is a petroleum-based synthetic fiber and has no natural properties. Synthetic fibers hence have a very poor adsorbing capacity, due to their molecular structure. Cotton is a natural fiber, originating from the Gossypium cotton plants. These cotton fibers almost purely consist of cellulose, which has a high adsorbing capacity (32). Next to moisture, odors are adsorbed, and less malodor is emitted. A second reason can be explained by the dissimilar bacterial growth on the different textiles, where the malodor causing Micrococcus spp. tends to grow better on synthetic textiles. The poor adsorbing properties and the selective bacterial growth of micrococci may account for the malodor emission by certain synthetic sport clothes.
The microbial community of the textiles differs with the community living on the axillary skin (see Fig. S4 in the supplemental material). While the axillary microbiome is generally dominated by Staphylococcus and Corynebacterium species (6), the textile microbiome was rather dominated by Staphylococcus and Micrococcus spp. (Fig. 3). The three main bacterial phyla found in the textiles (Firmicutes, Actinobacteria, and Proteobacteria) are also three important phyla of the skin microbiome (5). Certain species were able to grow in more abundant quantities on the textile fibers. It is suggested that malodor generation is associated with the selective growth of those species. The bacterial enrichment was studied and differed depending on the bacterial species and the type of clothing textile, as shown by an in vitro growth experiment (Table 2). Micrococci were selectively enriched on polyester and wool but were inhibited on fleece and viscose. Polyester textiles showed an enrichment for Micrococcus, for Enhydrobacter, and Propionibacterium spp. These enrichments can have an important impact on the malodor creation from excreted sweat compounds. Staphylococcus epidermidis was enriched on both cotton and polyester textiles, as seen in the fitness clothes (Fig. 3). These results are in close correlation with previous findings, where a high affinity of Staphylococcus spp. for cotton and polyester was reported (33, 34). The enrichment was confirmed by the in vitro growth experiment, with a growth reaching up to 107 CFU per cm2 textile for cotton, wool, and nylon. On polyester, the presence was maintained on a level of 106 CFU per cm2. In addition, Staphylococcus hominis was often able to gain dominance on cotton textiles, as seen in the fitness experiment. This was not seen for synthetic clothing textiles. No bacterial enrichment was seen on viscose, a textile made from regenerated wood cellulose. Viscose showed very low bacterial extraction efficiencies. Further research is needed to confirm the absence of bacterial growth on viscose. If bacterial growth is indeed impeded on these fiber types, viscose could be used as bacterium- and odor-preventing textile in functional clothes. Wool, on the other hand, promoted the growth of almost all bacteria. This is in correlation with earlier findings, where the highest bacterial growth was noted for wool compared to the other tested clothing textiles. Although wool was associated with high bacterial counts, the odor intensity ratings were the lowest for wool (10). nylon showed a very selective bacterial growth, with the biggest enrichment noted for Propionibacterium spp. (up to 108 CFU per cm2). Staphylococcus and Enhydrobacter spp. were enhanced as well, whereas the growth of Micrococcus and Corynebacterium spp. were inhibited. The Propionibacterium spp. are known to cause an acidic, intense foot odor (35). The enrichment of these species on nylon socks has an important consequence on the foot malodor generation.
The Corynebacterium genus was not able to grow under the circumstances of the in vitro growth experiment. The genus was likewise not detectable by DGGE, nor could it be isolated from any clothing textile after the fitness experiment, although it was initially present in the axillae of many subjects (see Fig. S4 in the supplemental material). These findings are consistent with previous findings, where no growth of corynebacteria on clothing textiles was found (10, 34). Corynebacteria are generally known as the most important species causing axillary malodor (36). These bacterial species are thought to be involved in the conversion of sweat compounds into volatile short branched-chain fatty acids, steroid derivatives, and sulfanylalkanols—the three main axillary malodor classes (15). The results of the present study, together with former research, indicated that corynebacteria are not the abundant bacterial species on clothing textiles. The absence or inability of corynebacteria to grow on clothing textiles implies that there are other bacterial types involved in the malodor creation in fabrics.
This research showed an overall enrichment of micrococci on the synthetic fabrics after the fitness session and incubation period. The bands were clearly visible on DGGE, meaning that the bacteria were present for at least more than 1% of the bacterial community (37). Isolates of Micrococcus spp. were identified not only in 100% polyester textiles but also in almost every shirt where synthetic fibers were present (Fig. 3). The results were confirmed by the in vitro growth experiment (Table 2). Of the seven tested textile types, micrococci were able to gain the highest abundance on polyester fabrics (up to 107 CFU per cm2). No selective growth was found for micrococci on cotton textiles after 3 days. Previous research found a single enrichment of micrococci on polyester (34). These findings confirm that micrococci are selectively enriched on polyester fabrics. It is hypothesized that the circumstances on synthetic clothing textiles are favorable for the growth and activity of Micrococcus spp. Their enrichment was not caused by a higher nonelectrostatic adsorption affinity for polyester. Other factors play a role in the enrichment of the micrococci. The aerobic growth conditions on polyester favor the growth of aerobic micrococci. Bacteria in clothing textiles are no longer suppressed by the innate immune system present on the skin. The nutritious environment, as well as quorum sensing (38, 39), can additionally play a role in the growth of micrococci. A multiplicity of these favorable situations causes the selective enrichment of micrococci on polyester fabrics. Micrococcus spp. are known for their ability to create malodor from sweat secretions. They are able to fully catabolize saturated, monounsaturated, and methyl-branched fatty acids into malodor compounds (4, 40). Next to corynebacteria, micrococci have been held responsible for the formation of body odor. These species have a high GC% content and are related to corynebacteria (both are members of the Actinobacteria phylum). Micrococci were frequently found in the axillary region, yet always by means of culturing techniques (4, 41). In molecular studies, micrococci have not been found in large quantities on the human axillary skin (6, 42). We suggest that micrococci were detected as they preferentially grow on the textiles worn close to the axillae and due to the practice of culturing techniques, which favor the growth of micrococci. It is suggested that micrococci prefer the aerobic environment of the textile fibers, whereas corynebacteria prefer the lipid-rich and more anaerobic environment on/in the (axillary) skin (43). This may also explain the odor differences frequently perceived between axillary skin and the textile worn at the axillary skin. The use of underarm cosmetics may additionally impact the skin microbiome and the subjects body odor. Stopping or resuming deodorant/antiperspirant usage leads toward an altered underarm microbiome. Especially the use of antiperspirants causes significant changes (44). Other factors include the general hygiene habits (frequency of washing, soap/shower gel type, etc.), the occupational lifestyle (physical activities, food habits, etc.), and the environment (place of residence and work, climate, humidity, etc.) which can impact the skin microbiome.
This research indicated that enrichment of micrococci occurred on polyester and, in general, on synthetic clothing textiles. Micrococci were frequently isolated, identified by means of DGGE fingerprinting, and enriched by an in vitro growth experiment on these textiles. The odor of the synthetic textiles was perceived as remarkably less pleasant after an intensive sport session. Microbial exchange occurs from skin to clothing textiles. A selective bacterial enrichment takes place, resulting in another microbiome compared to the autochthonous skin microbiome. The enrichment depended on the type of clothing textile and the type of bacterial species. With the current knowledge, the textile industry can design adjusted clothing fabrics that promote a non-odor-causing microbiome. This research opens perspectives toward better and functionalized sports clothing, which emit less malodor after use. Antimicrobial agents may be added to washing machine powders specifically against the odor causing microbiota, rather than using broad-spectrum antimicrobials. The enhancement of the non-odor-causing bacteria and the inhibition of the odor-causing bacteria, which are enriched on certain textiles, could greatly improve the quality of the fabrics.
Supplementary Material
ACKNOWLEDGMENTS
This research was funded by the Flemish Government and Ghent University through the assistantship of C.C. F.-M.K. was supported by a research grant from the Geconcerteerde Onderzoeksactie (GOA) of Ghent University (BOF09/GOA/005).
C.C., E.D.M., T.V.D.W., and N.B. designed the experiments. E.D.M. and C.C. performed the experiments and analyzed the data. The statistical analysis was done by F.-M.K. The contact angle measurements and analysis was made possible by A.V. C.C. wrote the paper. A.V., T.V.D.W., and N.B. commented on the manuscript.
We acknowledge the odor panel and the persons attending the spinning session for their willingness to participate in this research. We thank Tim Lacoere for his assistance during the molecular work. We thank Francis de los Reyes III and Eleni Vaiopoulou for their critical review of the manuscript and the inspiring discussions.
The authors declare that they have no conflict of interest.
Footnotes
Published ahead of print 15 August 2014
Supplemental material for this article may be found at http://dx.doi.org/10.1128/AEM.01422-14.
REFERENCES
- 1.Szostak-Kotowa J. 2004. Biodeterioration of textiles. Int. Biodeterior. Biodegrad. 53:165–170. 10.1016/S0964-8305(03)00090-8. [DOI] [Google Scholar]
- 2.Marples MJ. 1969. Life on the human skin. Sci. Am. 220:108–115. 10.1038/scientificamerican0169-108. [DOI] [PubMed] [Google Scholar]
- 3.Fredricks DN. 2001. Microbial ecology of human skin in health and disease. J. Invest. Dermatol. Symp. Proc. 6:167–169. 10.1046/j.0022-202x.2001.00039.x. [DOI] [PubMed] [Google Scholar]
- 4.Leyden JJ, McGinley KJ, Holzle E, Labows JN, Kligman AM. 1981. The microbiology of the human axilla and its relationship to axillary odor. J. Invest. Dermatol. 77:413–416. 10.1111/1523-1747.ep12494624. [DOI] [PubMed] [Google Scholar]
- 5.Grice EA, Kong HH, Conlan S, Deming CB, Davis J, Young AC, Bouffard GG, Blakesley RW, Murray PR, Green ED, Turner ML, Segre JA, Progra NCS. 2009. Topographical and temporal diversity of the human skin microbiome. Science 324:1190–1192. 10.1126/science.1171700. [DOI] [PMC free article] [PubMed] [Google Scholar]
- 6.Callewaert C, Kerckhof FM, Granitsiotis MS, van Gele M, van de Wiele T, Boon N. 2013. Characterization of Staphylococcus and Corynebacterium clusters in the human axillary region. PLoS One 8:e50538. 10.1371/journal.pone.0070538. [DOI] [PMC free article] [PubMed] [Google Scholar]
- 7.Buschlediller G, Zeronian SH, Pan N, Yoon MY. 1994. Enzymatic hydrolysis of cotton, linen, ramie, and viscose rayon fabrics. Text. Res. J. 64:270–279. 10.1177/004051759406400504. [DOI] [Google Scholar]
- 8.Shelley WB, Hurley HJ, Nicholas AC. 1953. Axillary odor: experimental study of the role of bacteria, apocrine sweat, and deodorants. Arch. Dermatol. Syphilol. 68:430–446. [DOI] [PubMed] [Google Scholar]
- 9.Dravniek A, Krotoszy B, Lieb WE, Jungerma E. 1968. Influence of an antibacterial soap on various effluents from axillae. J. Soc. Cosmet. Chem. 19:611–626. [Google Scholar]
- 10.McQueen RH, Laing RM, Brooks HJL, Niven BE. 2007. Odor intensity in apparel fabrics and the link with bacterial populations. Text. Res. J. 77:449–456. 10.1177/0040517507074816. [DOI] [Google Scholar]
- 11.Alonso D, Gimeno M, Olayo R, Vazquez-Torres H, Sepulveda-Sanchez JD, Shirai K. 2009. Cross-linking chitosan into UV-irradiated cellulose fibers for the preparation of antimicrobial-finished textiles. Carbohydr. Polym. 77:536–543. 10.1016/j.carbpol.2009.01.027. [DOI] [Google Scholar]
- 12.Lee J, Broughton RM, Akdag A, Worley SD, Huang TS. 2007. Antimicrobial fibers created via polycarboxylic acid durable press finishing. Text. Res. J. 77:604–611. 10.1177/0040517507081832. [DOI] [Google Scholar]
- 13.El-Tahlawy KF, El-Bendary MA, Elhendawy AG, Hudson SM. 2005. The antimicrobial activity of cotton fabrics treated with different cross-linking agents and chitosan. Carbohydr. Polym. 60:421–430. 10.1016/j.carbpol.2005.02.019. [DOI] [Google Scholar]
- 14.Kathirvelu S, D'Souza L, Dhurai B. 2009. A study on functional finishing of cotton fabrics using nano-particles of zinc oxide. Mater. Sci. (Medziagotyra) 15:75–79. [Google Scholar]
- 15.Barzantny H, Brune I, Tauch A. 2012. Molecular basis of human body odour formation: insights deduced from corynebacterial genome sequences. Int. J. Cosmet. Sci. 34:2–11. 10.1111/j.1468-2494.2011.00669.x. [DOI] [PubMed] [Google Scholar]
- 16.Evans CA, Stevens RJ. 1976. Differential quantitation of surface and subsurface bacteria of normal skin by combined use of cotton swab and scrub methods. J. Clin. Microbiol. 3:576–581. [DOI] [PMC free article] [PubMed] [Google Scholar]
- 17.Amoore JE, Venstrom D, Nutting MD. 1972. Sweaty odor in fatty acids: measurements of similarity, confusion, and fatigue. J. Food Sci. 37:33–35. 10.1111/j.1365-2621.1972.tb03378.x. [DOI] [Google Scholar]
- 18.R Development Core Team. 2013. R: a language and environment for statistical computing, 3rd ed. R Foundation for Statistical Computing, Vienna, Austria. [Google Scholar]
- 19.Szekely GJ, Rizzo ML. 2005. A new test for multivariate normality. J. Multivariate Anal. 93:58–80. 10.1016/j.jmva.2003.12.002. [DOI] [Google Scholar]
- 20.Oksanen J, Blanchet FG, Kindt R, Legendre P, Minchin PR, O'Hara RB, Simpson GL, Solymos P, Stevens MHH, Wagner H. 2013. Package “vegan”: community ecology package. R package version 2.0-7. http://cran.r-project.org/web/packages/vegan/vegan.pdf.
- 21.Anderson MJ. 2006. Distance-based tests for homogeneity of multivariate dispersions. Biometrics 62:245–253. 10.1111/j.1541-0420.2005.00440.x. [DOI] [PubMed] [Google Scholar]
- 22.Curran J. 2012. Package “Hotelling”: Hotelling's T-squared test and variants. R package version 1.0-0. http://cran.r-project.org/web/packages/Hotelling/Hotelling.pdf.
- 23.Teufel L, Schuster KC, Merschak P, Bechtold T, Redl B. 2008. Development of a fast and reliable method for the assessment of microbial colonization and growth on textiles by DNA quantification. J. Mol. Microbiol. Biotechnol. 14:193–200. 10.1159/000108657. [DOI] [PubMed] [Google Scholar]
- 24.Muyzer G, de Waal EC, Uitterlinden AG. 1993. Profiling of complex microbial populations by denaturing gradient gel electrophoresis analysis of polymerase chain reaction-amplified genes coding for 16S rRNA. Appl. Environ. Microbiol. 59:695–700. [DOI] [PMC free article] [PubMed] [Google Scholar]
- 25.Ovreas L, Forney L, Daae FL, Torsvik V. 1997. Distribution of bacterioplankton in meromictic Lake Saelenvannet, as determined by denaturing gradient gel electrophoresis of PCR-amplified gene fragments coding for 16S rRNA. Appl. Environ. Microbiol. 63:3367–3373. [DOI] [PMC free article] [PubMed] [Google Scholar]
- 26.Lane DJ. 1991. 16S/23S rRNA sequencing, p 115–175 In Stackebrandt E, Goodfellow M. (ed), Nucleic acid techniques in bacterial systematics. John Wiley & Sons, Chichester, United Kingdom. [Google Scholar]
- 27.Saitou N, Nei M. 1987. The neighbor-joining method: a new method for reconstructing phylogenetic trees. Mol. Biol. Evol. 4:406–425. [DOI] [PubMed] [Google Scholar]
- 28.Tamura K, Peterson D, Peterson N, Stecher G, Nei M, Kumar S. 2011. MEGA5: molecular evolutionary genetics analysis using maximum likelihood, evolutionary distance, and maximum-parsimony methods. Mol. Biol. Evol. 28:2731–2739. 10.1093/molbev/msr121. [DOI] [PMC free article] [PubMed] [Google Scholar]
- 29.Jukes TH, Cantor CR. 1969. Evolution of protein molecules, p 21–132 In Munro HN. (ed), Mammalian protein metabolism. Academic Press, Inc, New York, NY. [Google Scholar]
- 30.De Roy K, Clement L, Thas O, Wang YY, Boon N. 2012. Flow cytometry for fast microbial community fingerprinting. Water Res. 46:907–919. 10.1016/j.watres.2011.11.076. [DOI] [PubMed] [Google Scholar]
- 31.Verliefde ARD, Cornelissen ER, Heijman SGJ, Hoek EMV, Amy GL, Van der Bruggen B, Van Dijk JC. 2009. Influence of solute-membrane affinity on rejection of uncharged organic solutes by nanofiltration membranes. Environ. Sci. Technol. 43:2400–2406. 10.1021/es803146r. [DOI] [PubMed] [Google Scholar]
- 32.Shorter SA. 1924. The thermodynamics of water absorption by textile materials. J. Text. Inst. Trans. 15:T328–T336. 10.1080/19447022408661305. [DOI] [Google Scholar]
- 33.Hsieh YL, Merry J. 1986. The adherence of Staphylococcus aureus, Staphylococcus epidermidis, and Escherichia coli on cotton, polyester, and their blends. J. Appl. Bacteriol. 60:535–544. 10.1111/j.1365-2672.1986.tb01093.x. [DOI] [PubMed] [Google Scholar]
- 34.Teufel L, Pipal A, Schuster KC, Staudinger T, Redl B. 2010. Material-dependent growth of human skin bacteria on textiles investigated using challenge tests and DNA genotyping. J. Appl. Microbiol. 108:450–461. 10.1111/j.1365-2672.2009.04434.x. [DOI] [PubMed] [Google Scholar]
- 35.Ara K, Hama M, Akiba S, Koike K, Okisaka K, Hagura T, Kamiya T, Tomita F. 2006. Foot odor due to microbial metabolism and its control. Can. J. Microbiol. 52:357–364. 10.1139/w05-130. [DOI] [PubMed] [Google Scholar]
- 36.James AG, Austin CJ, Cox DS, Taylor D, Calvert R. 2013. Microbiological and biochemical origins of human axillary odour. FEMS Microbiol. Ecol. 83:527–540. 10.1111/1574-6941.12054. [DOI] [PubMed] [Google Scholar]
- 37.Muyzer G, Smalla K. 1998. Application of denaturing gradient gel electrophoresis (DGGE) and temperature gradient gel electrophoresis (TGGE) in microbial ecology. Antonie Van Leeuwenhoek 73:127–141. [DOI] [PubMed] [Google Scholar]
- 38.Miller MB, Bassler BL. 2001. Quorum sensing in bacteria. Annu. Rev. Microbiol. 55:165–199. 10.1146/annurev.micro.55.1.165. [DOI] [PubMed] [Google Scholar]
- 39.Mukamolova GV, Kormer SS, Kell DB, Kaprelyants AS. 1999. Stimulation of the multiplication of Micrococcus luteus by an autocrine growth factor. Arch. Microbiol. 172:9–14. 10.1007/s002030050733. [DOI] [PubMed] [Google Scholar]
- 40.James AG, Casey J, Hyliands D, Mycock G. 2004. Fatty acid metabolism by cutaneous bacteria and its role in axillary malodour. World J. Microbiol. Biotechnol. 20:787–793. 10.1007/s11274-004-5843-8. [DOI] [Google Scholar]
- 41.Taylor D, Daulby A, Grimshaw S, James G, Mercer J, Vaziri S. 2003. Characterization of the microflora of the human axilla. Int. J. Cosmet. Sci. 25:137–145. 10.1046/j.1467-2494.2003.00181.x. [DOI] [PubMed] [Google Scholar]
- 42.Costello EK, Lauber CL, Hamady M, Fierer N, Gordon JI, Knight R. 2009. Bacterial community variation in human body habitats across space and time. Science 326:1694–1697. 10.1126/science.1177486. [DOI] [PMC free article] [PubMed] [Google Scholar]
- 43.Marples RR, McGinley KJ. 1974. Corynebacterium acnes and other anaerobic diphteroids from human skin. J. Med. Microbiol. 7:349–352. 10.1099/00222615-7-3-349. [DOI] [PubMed] [Google Scholar]
- 44.Callewaert C, Hutapea P, Van de Wiele T, Boon N. 2014. Deodorants and antiperspirants affect the axillary bacterial community. Arch. Dermatol. Res. 2014:1–10. 10.1007/s00403-014-1487-1. [DOI] [PubMed] [Google Scholar]
Associated Data
This section collects any data citations, data availability statements, or supplementary materials included in this article.