

Abstract
The biosynthetic pathway for the production of phenylacetonitrile (PAN), which has a wide variety of uses in chemical and pharmaceutical industries, was constructed in Escherichia coli utilizing enzymes from the plant glucosinolate-biosynthetic and bacterial aldoxime-nitrile pathways. First, the single-step reaction to produce E,Z-phenylacetaldoxime (PAOx) from l-Phe was constructed in E. coli by introducing the genes encoding cytochrome P450 (CYP) 79A2 and CYP reductase from Arabidopsis thaliana, yielding the E,Z-PAOx-producing transformant. Second, this step was expanded to the production of PAN by further introducing the aldoxime dehydratase (Oxd) gene from Bacillus sp. strain OxB-1, yielding the PAN-producing transformant. The E,Z-PAOx-producing transformant also produced phenethyl alcohol and PAN as by-products, which were suggested to be the metabolites of E,Z-PAOx produced by E. coli enzymes, while the PAN-producing transformant accumulated only PAN in the culture broth, which suggested that the CYP79A2 reaction (the conversion of l-Phe to E,Z-PAOx) was a potential bottleneck in the PAN production pathway. Expression of active CYP79A2 and concentration of biomass were improved by the combination of the autoinduction method, coexpression of groE, encoding the heat shock protein GroEL/GroES, N-terminal truncation of CYP79A2, and optimization of the culture conditions, yielding a >60-fold concentration of E,Z-PAOx (up to 2.9 mM). The concentration of PAN was 4.9 mM under the optimized conditions. These achievements show the potential of this bioprocess to produce nitriles and nitrile derivatives in the absence of toxic chemicals.
INTRODUCTION
Phenylacetonitrile (PAN; a synonym of benzyl cyanide) and its derivatives are widely utilized in chemical and pharmaceutical industries (1). Chemical manufacturers currently synthesize PAN using CN−, which was shown to be highly toxic to animals (2, 3) and may cause serious environmental pollution. Although alternative synthetic pathways for the CN−-free production of nitriles have been reported (4–8), they also require strong chemicals and/or high energetic loads. The production of PAN via biocatalysis in the absence of toxic chemicals has the potential to reduce environmental burden. Accordingly, we launched metabolic engineering studies on the construction of a CN−-free production pathway from l-Phe to PAN in Escherichia coli.
The formation of PAN has been found in several secondary metabolic pathways initiating from l-Phe in plants. The biosynthetic pathway of R,S-mandelonitrile (MAN; 2-hydroxy-2-phenylacetonitrile), a defensive substance of some cyanogenic plants, has long been studied; l-Phe is first converted to E,Z-phenylacetaldoxime (PAOx), and then E,Z-PAOx is converted to MAN, probably via formation of PAN as an intermediate (Fig. 1, top) (9–12). Recently, similar pathways from l-Phe to PAN via E,Z-PAOx were also identified in Populus nigra and Fallopia sachalinensis, which activate the pathway in response to stress induced by herbivores to generate volatile PAN as a defensive substance (13, 14). On the other hand, the biosynthetic pathway of glucosinolate also includes the formation of E,Z-PAOx from l-Phe but not PAN (Fig. 1) (15). Cytochrome P450 (CYP) 79A2 (EC 1.14.13.124) of the glucosinolate biosynthetic pathway in Arabidopsis thaliana has been identified as the enzyme that converts l-Phe to E,Z-PAOx (16), and CYP79D6 and D7 from P. nigra were also recently found to have the same function (13). Biochemical studies have demonstrated that CYP79A2 specifically acts on l-Phe (16), while CYP79D6 and D7 have broad substrate specificity for l-Phe, l-Trp, l-Tyr, l-Leu, and l-Ile (13). CYP71AN24 from Prunus mume was recently identified as the enzyme that converts E,Z-PAOx to MAN (17). Additionally, CYP71E1 (EC 1.14.13.68) from Sorghum bicolor, which catalyzes a similar sequential reaction from E,Z-p-hydroxy-PAOx to p-hydroxyl-MAN (18), has broad substrate specificity for several aldoximes, including Z-PAOx (19).
FIG 1.

Plant cyanogenic glycoside and glucosinolate synthetic pathway (top) and bacterial aldoxime-nitrile pathway (bottom), initiating from l-Phe. E,Z-PAOx, E,Z-phenylacetaldoxime; PAN, phenylacetonitrile; MAN, R,S-mandelonitrile; FMO, flavin-containing monooxygenase. The involvement of FMO (bottom, dashed arrow) was predicted by the recent studies of S. coelicolor FMO acting on l-Trp (24). The pathways used for the production of PAN in this study are shown in gray boxes.
The formation of PAN in the marine bacteria of the clade Roseobacter and Z-PAOx-utilizing Bacillus sp. strain OxB-1 has also been reported (20, 21). The pathway of the latter strain, which metabolizes exogenous Z-PAOx, has been studied in detail and is referred to as the aldoxime-nitrile pathway (9, 20, 22) (Fig. 1, bottom). In this pathway, Z-PAOx is converted to PAN by aldoxime dehydratase (Oxd) (EC 4.99.1.7) (22, 23), and the product is further converted to phenylacetic acid by nitrilase to generate NH4+ as a nitrogen source (9, 20). A bacterial enzyme that forms E,Z-PAOx from l-Phe has not been identified yet, although a flavin-containing monooxygenase forming indole-3-acetaldoxime from l-Trp (a similar reaction from l-Phe to E,Z-PAOx) was found in Streptomyces coelicolor recently (24).
In the present study, we constructed a CN−-free PAN production pathway in E. coli by utilizing CYP79A2 for the conversion of l-Phe to E,Z-PAOx and Oxd for the conversion of E,Z-PAOx to PAN, respectively (Fig. 1, gray boxes). In addition, several parameters were optimized to increase the concentrations of the products, such as the coexpression of groE (which encodes the heat shock proteins GroEL/GroES), N-terminal modification of P450, and optimization of growth conditions.
MATERIALS AND METHODS
Materials.
The cDNA library of Arabidopsis thaliana was purchased from Life Technologies (Carlsbad, CA), Kod Plus DNA polymerase was from Toyobo (Osaka, Japan), the pGro7 chaperone plasmid was from TaKaRa Bio (Otsu, Japan), pETDuet-1 and pCDF-1b were from Novagen (Darmstadt, Germany), and OverExpress E. coli C41(DE3) was from Lucigen (Middleton, WI). All other materials and reagents for molecular biology were purchased from TaKaRa Bio, New England BioLabs (Ipswich, MA), and Life Technologies. Bacto tryptone, Bacto peptone, Casamino Acids, and yeast extract were purchased from BD Bioscience (Franklin Lakes, NJ), acetonitrile and formic acid (high-performance liquid chromatography [HPLC] grade) were from Kanto Kagaku (Tokyo, Japan), and authentic PAN and all other chemicals were from Wako Pure Chemical (Osaka, Japan). Authentic Z-PAOx was synthesized from phenylacetaldehyde and hydroxylamine, as described previously (20, 25). The mixture of E,Z-PAOx isomers was prepared by heating authentic Z-PAOx for 90 min at 80°C, as described previously (23).
Construction of expression plasmids and transformants.
The Arabidopsis thaliana cDNA library was used as a template for PCR. The cDNAs encoding A. thaliana P450 reductase (ATR; GenBank accession number X66017) and CYP79A2 (accession number AF245302), including their N-terminally truncated and site-directed mutagenesis variants, were amplified using KOD plus DNA polymerase and the primers listed in Table 1. The cDNA encoding the N-terminal chloroplast-targeting sequence of ATR (2 to 44 residues) was truncated to yield the Δ44atr variant (26) (Fig. 2A). Two mutations were introduced into the Δ44atr variant: an unexpected Ala2 insertion by the addition of an NcoI site at the 5′ end and a silent mutation at 500 to 505 to delete the internal NdeI site.
TABLE 1.
Primers used in this study
| Purpose and target | Primer name | Sequence (5′ to 3′)a |
|---|---|---|
| Cloning of cyp79A2 and its variants | ||
| C terminus | 79A2XhoI-A | TACCTCGAGTTAGGTTGGATACACATGTGGA |
| N terminus of CYP79A2 | 79A2fullNdeI-S | TACCATATGCTCGCGTTTATTATAGGTTT |
| N terminus of Δ14CYP79A2 | 79A2d14NdeI-S | TACCATATGAAGCGTAAGGAGAAGAAGA |
| N terminus of Δ23CYP79A2 | 79A2d23NdeI-S | TACCATATGTTAATTAGCCCTACGAGAAA |
| N terminus of Δ14CYP79A2-2A3 | d14A3-NdeI-S | TACCATATGAAACGTAAGGAGAAGAAGA |
| N terminus of Δ14CYP79A2-K2A | d14K2A-NdeI-S | TACCATATGGCTCGTAAGGAGAAGAAGA |
| Cloning of Δ44atr | ||
| N terminus of 44ATR | ATR2-NcoI-F | TACCCATGGCTCTTATAGAGAATCGTCAATTCGC |
| C terminus of ATR | ATR2-BamHI-R | TAGGGATCCTTACCATACATCTCTAAGATATCTTCCAC |
| Silent mutation at NdeI site in Δ44atr | ||
| Sense primer | ATR-NdeI-rev-S | AGCCACCTATGGAGATGGTGAGCCTACC |
| Antisense primer | ATR-NdeI-rev-A | TCCATAGGTGGCTAAGAAGAAGAAAGCC |
Italics indicate restriction enzyme recognition sites; mutation sites are in bold.
FIG 2.

Schematic representations of N-terminal sequences in ATR (A) and CYP79A2 (B). (A) N-terminal sequence of ATR containing 2 to 44 residues of the transmembrane sequence (gray box), followed by a functional domain. (B) N-terminal membrane-binding domain of CYP79A2 constituting a transmembrane region, basic region, and Pro-rich region (gray boxes), followed by a functional domain. The N-terminal sequences of Δ14CYP79A2, Δ23CYP79A2, Δ14CYP79A2-2A3, and Δ14CYP79A2-K2A are also shown. Sites of point mutations are indicated by underlining.
In addition to the full-length cyp79A2, two cDNAs encoding the N-terminally truncated CYP79A2s were generated: one for Δ14CYP79A2, lacking the N-terminal transmembrane region, and one for Δ23CYP79A2, lacking the N-terminal transmembrane and basic regions (Fig. 2B). Two variants containing a point mutation at the second codon of the Δ14cyp79A2 sequence (AAG, encoding Lys) were also generated: the Δ14cyp79A2-2A3 variant, containing a silent mutation of the second codon by a substitution with AAA, showing higher codon frequency (27), and the Δ14cyp79A2-K2A variant, containing a K2A mutation, which is the conventional modification of CYP genes for E. coli expression (28, 29).
pETDuet-Δ44atr-cyp79A2 was constructed by the insertion of the Δ44atr variant and cyp79A2 into multicloning sites 1 and 2 of pETDuet-1, respectively. pCDF-oxd was constructed by the insertion of cDNA encoding Oxd (GenBank accession number AB028892) into pCDF-1b, which was excised from pOxd-90F, which was previously constructed (30) using PstI and HindIII. pGro7 was used for the coexpression of groE. These plasmids were transformed into E. coli C41(DE3), which possesses tolerance to the toxicity associated with heterologous expression of membrane proteins.
Growth conditions for the production of E,Z-PAOx and PAN.
Induction by isopropyl-β-d-1-thiogalactopyranoside (IPTG) was carried out as follows. The transformant was grown in LB medium containing appropriate antibiotics (50 μg/ml ampicillin for pETDuet derivatives, 34 μg/ml chloramphenicol for pGro7, or 50 μg/ml streptomycin for pCDF derivatives) at 26°C on a rotary shaker at 300 rpm until the optical density at 600 nm (OD600) reached 0.6. Protein expression was induced by a final concentration of 1 mM IPTG. A total of 0.5 mM δ-aminolevulinic acid (ALA) was simultaneously supplied to promote heme synthesis. The expression of groE using pGro7 was induced by 2 mg/ml arabinose.
Autoinduction was performed as follows. The transformant was streaked on an LB plate containing 1% glucose and the antibiotics described above. A single colony was inoculated into autoinduction medium and grown at 26°C on a rotary shaker at 300 rpm. The LB-based autoinduction medium (control conditions) contained 1% Bacto tryptone, 0.5% yeast extract, 0.05% glucose, 0.5% glycerol, 0.2% α-lactose, 25 mM ammonium sulfate, 100 mM KH2PO4-Na2PO4 buffer (pH 7.0), 1 mM MgSO4, 0.5 mM ALA, metal mixture (50 μM FeCl3·6H2O, 20 μM CaCl2, 10 μM MnCl2·4H2O, 10 μM ZnSO4·7H2O, 2 μM CoCl2·6H2O, 2 μM CuCl2·2H2O, 2 μM NiCl2·6H2O, 2 μM Na2MoO4·2H2O, 2 μM Na2SeO3·5H2O, and 2 μM H3BO3), and the antibiotics described above (31). To optimize the autoinduction medium, organic components (0 to 3% Casamino Acids, peptone, and tryptone and 0.5% yeast extract), nitrogen sources (0 to 50 mM ammonium sulfate or urea), cultivation temperatures (16 to 37°C), and the addition of l-Phe (0 to 40 mM) were examined.
Quantification of active P450s in bacterial cells using the CO-reduced difference spectra.
The transformant cultivated under the given conditions was harvested by centrifugation at 6,000 × g and 4°C for 10 min, washed with 50 mM HEPES-NaOH buffer (pH 7.5), and resuspended in the same buffer. The cell suspension was divided into two cuvettes. A small amount of sodium dithionite was added to both cuvettes. The cuvettes were inverted and incubated for 3 min at 25°C. Five milliliters of carbon monoxide was injected slowly into the sample cuvette. Difference spectra were measured with a Shimadzu UV-2600 spectrophotometer equipped with an ISR-2600 integrating sphere attachment. The active CYP concentration in the cell suspension was estimated from ΔA450–490 using an extinction coefficient of 91 mM−1 cm−1 (32).
Identification of products.
Gas chromatography-mass spectrometry (GC-MS) analysis was carried out to identify the products. Samples were prepared as follows. The bacterial culture broth (3 ml) was extracted with equal volumes of n-hexane three times, and the collected hexane phase was concentrated to 1 ml by a stream of N2 gas. The concentrated sample was applied to a gas chromatograph-mass spectrometer (GCMS-QP-2010 Plus; Shimadzu, Kyoto, Japan) equipped with a TC-70 capillary column (GL Science, Tokyo, Japan). The oven temperature was programmed from 60 to 280°C at a rate of 10°C/min. The products were identified by comparing retention times and mass fragmentation patterns with those of authentic compounds.
Quantification of E,Z-PAOx and PAN in the culture broth of the transformants.
The concentrations of E,Z-PAOx and PAN were quantified by ultrafast liquid chromatography (UFLC) using a photo diode array detector (Nexera; Shimadzu) and a Cosmosil 2.5 C18-MS-II column (2 mm [inside diameter] by 75 mm; Nacalai Tesque, Kyoto, Japan). Samples were prepared as follows. Four hundred microliters of the bacterial culture broth was transferred to 1.5-ml tubes. Twenty microliters of 100% trichloroacetic acid and 380 μl of methanol were added and vortexed vigorously. The sample was centrifuged at 16,000 × g and 4°C for 10 min to remove debris and then subjected to UFLC analysis. The mobile phase was 25% acetonitrile containing 0.1% formic acid at a 0.4-ml/min flow rate. The amounts of E,Z-PAOx and PAN were estimated from the peak areas of the 258-nm and 257-nm absorbance chromatograms, respectively, using each standard curve.
RESULTS
Preparation of expression vectors and transformants.
In the present study, CYP79A2 was selected as the enzyme to catalyze the conversion of l-Phe to E,Z-PAOx. Since CYP reductase is needed to supply electrons for the activation of oxygen molecules in the catalytic cycle of CYPs, a coexpression system consisting of the Δ44atr variant and cyp79A2 was constructed using pETDuet-Δ44atr-cyp79A2. In addition, since CYP79A2 is a membrane-binding protein that is expressed at very low levels in E. coli, cDNAs encoding CYP79A2 variants with N-terminal truncation and modification were prepared (see Materials and Methods for details) and inserted into multicloning site 2 of the Duet vector described above. Oxd was selected as the biocatalyst for the dehydration of E,Z-PAOx to PAN in this study. The cDNA encoding Oxd was inserted into pCDF-1b, which is suitable for coexpression with pETDuet-Δ44atr-cyp79A2. The transformant harboring pETDuet-Δ44atr-cyp79A2 was constructed for the production of E,Z-PAOx from l-Phe, and the transformant harboring pETDuet-Δ44atr-cyp79A2 and pCDF-oxd was constructed for the production of PAN from l-Phe via E,Z-PAOx. SDS-PAGE showed that each transformant produced recombinant Δ44ATR, CYP79A2, and Oxd proteins, respectively (see Fig. S1 in the supplemental material).
Production of E,Z-PAOx and PAN by the transformants.
First, the products from the transformant expressing cyp79A2 and the Δ44atr variant were analyzed. The doublet peaks with retention times (at 20.0 and 20.3 min) and MS fragmentation patterns identical to those of authentic E,Z-PAOx were detected from the culture broth of the transformant harboring pETDuet-Δ44atr-cyp79A2 by GC-MS analysis (Fig. 3). These peaks were not detected from the culture broth of the transformant with pETDuet-Δ44atr (Fig. 3). Thus, it was confirmed that the CYP79A2 catalysis to form E,Z-PAOx from l-Phe was reconstituted in E. coli.
FIG 3.

GC-MS analysis of the products by the transformants. (A) Total ion chromatograms for the hexane extracts from the culture broth of the transformants with pETDuet-Δ44atr-cyp79A2 (top), pETDuet-Δ44atr (middle), and pETDuet-Δ44atr-cyp79A2 and pCDF-oxd (bottom). (B) MS spectra of E,Z-PAOx (peak 1), PAN (peak 2), and phenethyl alcohol (peak 3).
As by-products, phenethyl alcohol (at 17.5 min) and PAN (at 19.0 min) were also detected in the culture broth of the E,Z-PAOx-producing transformant but not in the culture broth of the transformants harboring pETDuet-Δ44atr (Fig. 3), suggesting that the by-products were generated by the degradation of E,Z-PAOx by E. coli enzymes. The formation of phenethyl alcohol from E,Z-PAOx may be catalyzed by some dehydrogenases, as previously described for bacterial alcohol dehydrogenase (33). The dehydration of E,Z-PAOx was not detected in E. coli in the previous screening study (22).
Second, the products from the transformant coexpressing cyp79A2, the Δ44atr variant, and oxd were analyzed. By introducing pCDF-oxd, the peak with the retention time and mass fragmentation pattern identical to those of PAN was detected from the culture broth (Fig. 3). Thus, it was confirmed that the biosynthetic pathway for the production of PAN from l-Phe was constructed in E. coli. The transformant producing PAN did not accumulate phenethyl alcohol or E,Z-PAOx, suggesting that E,Z-PAOx formed by CYP79A2 was efficiently consumed by Oxd, thereby avoiding the degradation of E,Z-PAOx to phenethyl alcohol by E. coli enzymes. These results indicated that the activity of CYP79A2 that forms E,Z-PAOx from l-Phe was rate limiting in the engineered pathway.
Autoinduction and coexpression of groE.
Culture conditions were optimized for the production of E,Z-PAOx by the transformant harboring pETDuet-Δ44atr-cyp79A2, because the CYP79A2 reaction appeared to be rate limiting in the engineered pathway. The initial concentration of E,Z-PAOx was only 47 μM (μmol/liter of the culture broth) upon induction with IPTG in LB medium (Fig. 4A). The concentration of E,Z-PAOx was increased up to 2.3-fold (108 μM) by using the LB-based autoinduction medium (Fig. 4A), which causes protein expression with high cell density (31, 34). The OD600s indicative of the biomass concentration in the LB-based autoinduction medium were also 2.2-fold higher than those in LB medium (Fig. 4A). Additionally, the coexpression of groE (using pGro7) in the LB-based autoinduction medium containing 2 mg/ml arabinose further increased the concentration of E,Z-PAOx more than 4.6-fold (500 μM) (Fig. 4A), whereas the final biomass concentration was not significantly affected (1.2-fold increase) by the coexpression of groE.
FIG 4.

Time course of the concentrations of biomass, E,Z-PAOx, and PAN. (A) Time courses of E,Z-PAOx concentration (closed symbols) and OD600 (open symbols). Circles, transformant with pETDuet-Δ44atr-cyp79A2 grown in LB, followed by the induction with IPTG; diamonds, transformant with pETDuet-Δ44atr-cyp79A2 grown in the LB-based autoinduction medium; triangles, transformant with pETDuet-Δ44atr-cyp79A2 and pGro7 grown in the LB-based autoinduction medium containing 2 mg/ml arabinose. (B) Time courses of PAN concentration (closed symbols) and OD600 (open symbols). Triangles, transformant with pETDuet-Δ44atr-cyp79A2 and pGro7; squares, transformant with pETDuet-Δ44atr-cyp79A2, pCDF-oxd, and pGro7. Both transformants were grown in LB-based autoinduction medium containing 2 mg/ml arabinose. Values are means and error bars show 95% confidence limits from replicate assays.
Under the optimal conditions described above, the concentration of PAN produced by the transformant harboring pETDuet-Δ44atr-cyp79A2, pCDF-oxd, and pGro7 was 600 μM (Fig. 4B). The biomass concentration curve of the PAN-producing transformant was similar to that of the E,Z-PAOx-producing strain (Fig. 4B). Under these conditions, the PAN-producing transformant did not accumulate any products other than PAN, as determined by the detection methods in this work.
Optimization of the culture medium conditions.
The culture medium conditions were further optimized for the production of E,Z-PAOx by the transformant with pETDuet-Δ44atr-cyp79A2 and pGro7. Of the combinations of organic components examined (see Table S1 in the supplemental material), the autoinduction medium containing 2% Casamino Acids without yeast extract gave the highest concentration of E,Z-PAOx (see Table S1 in the supplemental material). The results obtained also confirmed that the transformant harboring pETDuet-Δ44atr-cyp79A2 and pGro7 could produce E,Z-PAOx in inorganic salt autoinduction medium, although the concentration was very low (6 μM). The optimal pH was found to be 6.0 (see Table S2 in the supplemental material). As the nitrogen source, 12.5 mM urea gave the highest concentration of E,Z-PAOx, whereas the addition of ammonium sulfate negatively affected the production of E,Z-PAOx (see Table S3 in the supplemental material). Under these optimized culture medium conditions, the concentrations of E,Z-PAOx and PAN produced by the corresponding transformants reached 720 and 880 μM, respectively.
Effects of cultivation temperature shifts.
The effects of cultivation temperatures on the concentrations of E,Z-PAOx and PAN produced by the corresponding transformants were investigated. Autoinduction medium was designed as follows. Glucose is consumed in the first phase of cultivation, in which the biomass concentration increases but protein is not expressed by glucose catabolite repression. In the next phase of the cultivation after depletion of glucose, lactose is metabolized and protein expression is initiated. From the time courses of the biomass concentration (the OD600) and the concentrations of E,Z-PAOx and PAN (Fig. 4), it was assumed that the transition from glucose metabolism to lactose metabolism would occur at 24 h of incubation. Hence, the cultivation temperatures were shifted from 26°C to 16 to 37°C after the first 24 h of cultivation. As shown in Fig. 5, the concentrations of E,Z-PAOx and PAN increased at the lower cultivation temperature, reaching 1.45 mM and 1.91 mM at 16°C, respectively. The temperature shift did not affect the concentration of the biomass. The CO-reduced difference spectrum, indicative of active CYP, was detected from cells cultivated at 16°C (see Fig. S2 in the supplemental material) but not from cells cultivated at higher temperatures (data not shown), which suggested that the expression of active CYP79A2 by E. coli was improved by the temperature shift, resulting in the higher concentration of E,Z-PAOx.
FIG 5.
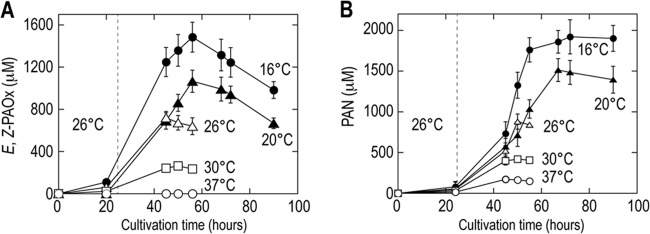
Effects of the cultivation temperature shift on the concentrations of E,Z-PAOx (A) and PAN (B). The transformants with pETDuet-Δ44atr-cyp79A2 and pGro7 (A) and pETDuet-Δ44atr-cyp79A2, pCDF-oxd, and pGro7 (B) were grown in optimized 2% Casamino Acids autoinduction medium at 26°C for the first 24 h (until the time indicated by the dashed line), and the cultivation temperatures were then shifted to 16°C (closed circles), 20°C (closed triangles), 26°C (open triangles), 30°C (open squares), and 37°C (open circles). Values are means and error bars show 95% confidence limits from replicate assays.
N-terminal truncation and modification of CYP79A2.
Since CYP79A2 contains the N-terminal transmembrane sequence, two N-terminally truncated variants, Δ14CYP79A2 and Δ23CYP79A2, were examined in the fermentative production of E,Z-PAOx. As summarized in Table 2, the concentrations of E,Z-PAOx produced by the transformants expressing the Δ14cyp79A2 and Δ23cyp79A2 variants were 139 and 118%, respectively, that of the concentration obtained with the transformant expressing the full-length cyp79A2. The CO-reduced difference spectra of the cell suspensions revealed that the active CYP concentrations of Δ14CYP79A2 and Δ23CYP79A2 were 155 and 127% that of the full-length CYP79A2, respectively (Table 2), which closely matched the pattern of the concentrations of E,Z-PAOx.
TABLE 2.
Effects of CYP79A2 mutations on the concentrations of E,Z-PAOx and the protein expression levels of active CYP
| Construct | E,Z-PAOx concn (μM)a | Concn of active CYP79A2 (μmol/liter of culture broth)a,b | OD600 |
|---|---|---|---|
| CYP79A2 | 1,450 ± 241 | 0.11 ± 0.02 | 12.7 ± 0.3 |
| Δ14CYP79A2 | 2,021 ± 281 | 0.17 ± 0.03 | 12.8 ± 0.4 |
| Δ23CYP79A2 | 1,708 ± 198 | 0.14 ± 0.02 | 13.3 ± 0.4 |
| Δ14CYP79A2-2A3 | 977 ± 105 | 0.08 ± 0.02 | 13.2 ± 0.3 |
| Δ14CYP79A2-K2A | 917 ± 131 | 0.09 ± 0.02 | 12.8 ± 0.3 |
Means and 95% confidence limits are shown.
The concentration of active CYP was estimated from the CO-reduced difference spectra of the transformant cell suspension (see Fig. S2 in the supplemental material). The incubation temperatures were 26°C for the first 24 h and 16°C for the next 30 h.
Additionally, point mutations at the second codon of the Δ14cyp79A2 variant were also examined. Previous studies have demonstrated that the second-codon frequency significantly affected the protein expression level in the E. coli expression system (27) and that the expression of CYPs in E. coli was actually improved by the substitution of the second codon with one encoding Ala (28, 29). Therefore, Δ14CYP79A2-2A3, which has higher codon frequency at the second codon, and Δ14CYP79A2-K2A, with the K2A mutation of Δ14CYP79A2, were examined. However, the concentration of E,Z-PAOx was not improved by these point mutations (Table 2).
Thus, it was determined that Δ14CYP79A2 without mutation was the optimal form among the variants examined for production of E,Z-PAOx by E. coli. The concentrations of E,Z-PAOx and PAN produced by the transformants harboring pETDuet-Δ44atr-Δ14cyp79A2 and pGro7 were 2.02 mM and those produced by the transformants harboring pETDuet-Δ44atr-Δ14cyp79A2, pCDF-oxd, and pGro7 were 2.75 mM. The conversion yields relative to l-Phe concentration (4.1 mM) of the 2% Casamino Acids-based autoinduction medium were 49% for E,Z-PAOx and 67% for PAN, respectively.
Other potential bottlenecks in the E. coli production of E,Z-PAOx and PAN.
We investigated several potential bottlenecks which needed to be resolved to further improve the production of E,Z-PAOx and PAN in E. coli. In order to assess if enough l-Phe (the substrate of the engineered pathway) was supplied in the culture broths, addition of l-Phe was examined (Table 3). The concentrations of E,Z-PAOx and PAN were significantly increased by the addition of l-Phe; the highest concentrations of E,Z-PAOx and PAN produced by the transformants harboring pETDuet-Δ44atr-Δ14cyp79A2 and pGro7 were 2.9 mM and those produced by the transformants harboring pETDuet-Δ44atr-Δ14cyp79A2, pCDF-oxd, and pGro7 were 4.9 mM when 20 mM l-Phe was added. Thus, it was suggested that the concentration of l-Phe in the culture broth would be rate limiting in the engineered biosynthesis pathway. Since the increases of the conversion yields relative to the concentration of l-Phe added were low, the capacity for l-Phe uptake by the host cell would also be rate limiting.
TABLE 3.
Effects of the exogenous addition of l-Phe on the concentrations of E,Z-PAOx and PAN by the transformants
| Concn (mM) of l-Phe added | Concn (mM) of E,Z-PAOxa,b | OD600a | Concn (mM) of PANa,c | OD600a |
|---|---|---|---|---|
| 0 | 2.02 ± 0.28 | 12.8 ± 0.4 | 2.75 ± 0.38 | 12.6 ± 0.3 |
| 5 | 2.48 ± 0.32 | 12.6 ± 0.4 | 3.88 ± 0.48 | 12.02 ± 0.4 |
| 10 | 2.71 ± 0.27 | 12.6 ± 0.3 | 4.15 ± 0.64 | 12.2 ± 0.2 |
| 20 | 2.92 ± 0.39 | 12.1 ± 0.4 | 4.87 ± 0.59 | 11.2 ± 0.3 |
| 40 | 2.82 ± 0.36 | 12.2 ± 0.3 | 4.67 ± 0.51 | 11.6 ± 0.3 |
Means and 95% confidence limits are shown.
Concentration of E,Z-PAOx produced by the transformant with pETDuet-Δ44atr-Δ14cyp79A2 and pGro7, grown in optimized 2% Casamino Acids-based autoinduction medium. The incubation temperatures were 26°C for the first 24 h and 16°C for the next 30 h.
Concentration of PAN produced by the transformant with pETDuet-Δ44atr-Δ14cyp79A2, pCDF-oxd, and pGro7, grown in optimized 2% Casamino Acids-based autoinduction medium. The incubation temperatures were 26°C for the first 24 h and 16°C for the next 30 h.
Additionally, since the toxicities of E,Z-PAOx and PAN were considered another factor limiting the concentrations of the products, growth inhibition by the products was tested. As shown in Fig. 6, the biomass concentrations were decreased in a concentration-dependent manner by E,Z-PAOx and PAN in millimolar ranges. Thus, it was suggested that the toxicity of E,Z-PAOx and PAN damaged the host cell and delimited the concentration of the products.
FIG 6.

Inhibition of E. coli growth by E,Z-PAOx and PAN. The culture broth of E. coli C41(DE3) (without any plasmid) cultivated in LB medium at 37°C for 12 h with shaking at 300 rpm was diluted in fresh LB medium containing different concentrations of E,Z-PAOx and PAN to an OD600 of 0.01. OD600 was measured after another 12-h cultivation under the same conditions.
DISCUSSION
In the present study, we successfully constructed a metabolic pathway for the production of PAN from l-Phe in E. coli by utilizing plant CYP79A2 and bacterial Oxd (Fig. 1). Since nitriles are compounds that are generally used in industries, the cyanide-free microbial production of nitrile in the present study has the potential to reduce environmental burden.
To date, A. thaliana CYP79A2, which specifically acts on l-Phe, and P. nigra CYP79D6 and -D7, which have broad substrate specificities for different amino acids, are the enzymes that have been identified as converting l-Phe to E,Z-PAOx (13, 16). CYP79A2 was selected in the present study due to its specificity for l-Phe, in order to avoid unexpected reactions or side products potentially damaging the host cell. Enzymes for the dehydration of E,Z-PAOx to PAN—CYP71AN24 from Prunus mume (17), CYP71E1 from Sorghum bicolor (19), mammalian liver CYPs (35), and Oxd from Bacillus sp. strain OxB-1 (22)—have been reported previously. Among them, it has been revealed that mammalian liver CYPs converted aldoximes to nitriles under anaerobic conditions (35), and CYP71AN24 and CYP71E1 were able to further convert PAN to MAN, which is spontaneously degraded to benzaldehyde and toxic CN−; therefore, these CYPs were considered unsuitable for pathway engineering for the production of PAN. In contrast, Oxd catalyzes the single-step dehydration of Z-PAOx to PAN and has already been overexpressed in E. coli, yielding whole-cell catalysts showing high conversion efficiency (100% yield of PAN from 0.5 M Z-PAOx) (36). Thus, Oxd was selected as the enzyme to convert E,Z-PAOx to PAN in this study.
Different trials were examined specifically to increase the concentrations of E,Z-PAOx, because the CYP79A2 reaction (the conversion of l-Phe to E,Z-PAOx) was suggested to be rate limiting in the engineered pathway. By changing the induction method from the use of IPTG to autoinduction, the concentration of E,Z-PAOx and the biomass were increased 2.3- and 2.2-fold, respectively (Fig. 4A), suggesting that the increase in E,Z-PAOx concentration was due to the higher cell density in the autoinduction medium. On the other hand, the coexpression of groE improved the concentration of E,Z-PAOx but did not significantly affect the final biomass concentration (Fig. 4A). This result suggested that GroEL/GroES may have promoted the correct folding and/or stabilization of CYP79A2. Improving E. coli expression by the coexpression of groE has also been described for several eukaryotic microsomal CYPs (37–39).
Two-step cultivation temperatures (26°C for the first 24 h and 16°C for the following period) were found to significantly increase the concentrations of E,Z-PAOx and PAN (Fig. 5). The CO-reduced difference spectrum was observed from the E. coli cells incubated at 16°C (see Fig. S2 in the supplemental material) but not at 26°C (data not shown). These observations suggested that CYP79A2 would be unstable and rapidly inactivated under mesophilic conditions, as previously described for S. bicolor CYPs (19), which was in agreement with the improved E,Z-PAOx concentration by the coexpression of groE.
Among the N-terminally truncated variants, Δ14CYP79A2 initiating from the basic region showed the highest concentration of E,Z-PAOx, which may have been due to the higher expression level of active CYP79A2 (Table 2; also, see Fig. S2 in the supplemental material). It has also been reported that N-terminally truncated forms initiating from the basic regions improved E. coli expression of fungal P450s (40). The positively charged residues of the N-terminal basic region have been proposed to play a role as a “halt translocation” signal to place the C-terminal functional domains in the cytosol, possibly by interacting with charges at or near the translocon (41). Although elucidation of a detailed mechanism will be necessary for understanding the role of the N-terminal basic region of Δ14CYP79A2 in E. coli expression, it is likely that the interaction between the N-terminal basic region and translocon or lipid bilayer membrane may contribute to the production and/or stabilization of this enzyme, yielding higher concentrations of E,Z-PAOx.
This study also assessed other potential bottlenecks in the E. coli production of E,Z-PAOx and PAN. As shown in Table 3, it was confirmed that the concentration of l-Phe in the culture broth significantly affected the concentration of E,Z-PAOx and PAN. From these observations, it was expected that the l-Phe-overproducing strain E. coli ATCC 31882 would be a suitable host cell for further increasing the concentration of the products. However, the concentrations of E,Z-PAOx and PAN in the culture broths of the ATCC 31882 transformants were far lower than those of the C41(DE3) transformants, probably due to the lower biomass concentrations of the ATCC 31882 transformants than the C41 transformants. These negative results for the ATCC 31882 transformants can be explained by its lower tolerance of heterologous expression of the membrane proteins than the C41 strain (42). Thus, it was suggested that in addition to the ability to biosynthesize l-Phe, the tolerance of a host cell for heterologous expression of membrane protein has to be improved to increase the concentrations of E,Z-PAOx and PAN.
Additionally, it was confirmed that E,Z-PAOx and PAN in millimolar ranges inhibited growth of E. coli (Fig. 6). Probable mechanisms of the toxicity of E,Z-PAOx and PAN are as follows. As shown in Fig. 3, E,Z-PAOx was converted to phenethyl alcohol in the E. coli culture broth, probably via formation of phenylacetaldehyde and hydroxylamine (33). Both phenylacetaldehyde and hydroxylamine show toxicities for organisms by modifying DNA and proteins. PAN seemed to be more stable than E,Z-PAOx in the culture broths, and any product from PAN was not detected under the analytical conditions in this study (Fig. 5). However, PAN is slowly degraded and liberates CN−, which damages aerobic respiration, which would delimit the production of PAN. Thus, breeding host cells with high resistance against these toxic compounds and/or developing a method for removal of toxic compounds from the culture broth would be necessary for increasing the concentration of E,Z-PAOx and PAN.
Although CYP79A2 and other CYPs involved in secondary metabolism of plants have potential for industrial applications (43), the utilization of plant CYPs has been limited because of low yields from natural sources, instabilities, and low protein expression levels even in heterologous E. coli expression (43, 44). In this study, we succeeded in reconstituting the reaction of CYP79A2 in E. coli and improving E. coli expression of CYP79A2 by the combination of coexpression of GroEL/GroES, optimization of culture conditions, and truncation of the N-terminal sequence. These may also be applicable to E. coli expression of other plant CYPs. Additionally, PAN is an intermediate of different value-added and bioactive compounds; therefore, this engineered pathway has the potential to be applied to the microbial production of PAN derivatives such as amides, carboxylic acids, and cyanohydrins from l-Phe by the introduction of other plant and bacterial enzymes (9, 12). The production of other amino acid-derived nitriles (such as l-Trp, l-Tyr, and aliphatic nitriles) may also be possible by replacing CYP79A2 and Oxd with the corresponding plant and bacterial enzymes (9, 10, 12, 22).
Supplementary Material
ACKNOWLEDGMENT
We thank Toshiyuki Sakaki at the Biotechnology Research Center and Department of Biotechnology, Toyama Prefectural University, for his valuable suggestions on the expression of cyp79A2 by E. coli.
Footnotes
Published ahead of print 29 August 2014
Supplemental material for this article may be found at http://dx.doi.org/10.1128/AEM.01623-14.
REFERENCES
- 1.Pollak P, Romeder G, Hagedorn F, Gelbke H-P. 2000. Nitriles, p 363–376 In Elvers B, Hawkins S, Schulz G. (ed), Ullmann's encyclopedia of industrial chemistry. Wiley-VCH Verlag, Weinheim, Germany. [Google Scholar]
- 2.Adams RT, Thal AF. 1922. Benzyl cyanide. Org. Synth. Coll. 2:9. 10.15227/orgsyn.002.0009. [DOI] [Google Scholar]
- 3.Hamel J. 2011. A review of acute cyanide poisoning with a treatment update. Crit. Care Nurse 31:72–82. 10.4037/ccn2011799. [DOI] [PubMed] [Google Scholar]
- 4.Botteghi C, Chelucci G, Marchetti M. 1982. Synthesis of optically active aliphatic nitriles from aldehydes and acids. Synth. Commun. 12:25–33. 10.1080/00397918208080062. [DOI] [Google Scholar]
- 5.Fenselau AH, Hamamura EH, Moffatt JG. 1970. Carbodiimide-sulfoxide reactions. VIII. Reactions of oximes and hydroxylamines. J. Org. Chem. 35:3546–3552. [Google Scholar]
- 6.Foley HG, Dalton DR. 1973. Neutral conversion of aldoximes into nitriles at low temperature. J. Chem. Soc. Chem. Commun. 1973:628–629. 10.1039/C39730000628. [DOI] [Google Scholar]
- 7.Maruoka K, Yamamoto H. 1991. Functional group transformations via carbonyl derivatives, p 763–793 In Trost BM, Fleming I. (ed), Comprehensive organic synthesis. Pergamon, Oxford, United Kingdom. [Google Scholar]
- 8.Oxley P, Partridge MW, Robson TD, Short WF. 1946. Amidines. Part II. Preparation of cyanides, amides, and amidines from carboxylic acids. J. Chem. Soc. 1946:763–771. [DOI] [PubMed] [Google Scholar]
- 9.Asano Y. 2010. Tools for enzyme discovery, p 441–452 In Baltz RH, Davies JE, Demain A. (ed), Manual of industrial microbiology and biotechnology, 3rd ed. American Society for Microbiology, Washington, DC. [Google Scholar]
- 10.Legras JL, Chuzel G, Arnaud A, Galzy P. 1990. Natural nitriles and their metabolism. World J. Microbiol. Biotechnol. 6:83–108. 10.1007/BF01200927. [DOI] [PubMed] [Google Scholar]
- 11.Seigler DS. 1991. Cyanide and cyanogenic glycosides, p 35–77 In Rosenthal GA, Berenbaum MR. (ed), Herbivores: their interactions with secondary plant metabolites, 2nd ed. Academic Press, San Diego, CA. [Google Scholar]
- 12.Sønderby IE, Geu-Flores F, Halkier BA. 2010. Biosynthesis of glucosinolates—gene discovery and beyond. Trends Plant Sci. 15:283–290. 10.1016/j.tplants.2010.02.005. [DOI] [PubMed] [Google Scholar]
- 13.Irmisch S, McCormick AC, Boeckler GA, Schmidt A, Reichelt M, Schneider B, Block K, Schnitzler JP, Gershenzon J, Unsicker SB, Köllner TG. 2013. Two herbivore-induced cytochrome P450 enzymes CYP79D6 and CYP79D7 catalyze the formation of volatile aldoximes involved in poplar defense. Plant Cell 25:4737–4754. 10.1105/tpc.113.118265. [DOI] [PMC free article] [PubMed] [Google Scholar]
- 14.Noge K, Tamogami S. 2013. Herbivore-induced phenylacetonitrile is biosynthesized from de novo-synthesized l-phenylalanine in the giant knotweed, Fallopia sachalinensis. FEBS Lett. 587:1811–1817. 10.1016/j.febslet.2013.04.038. [DOI] [PubMed] [Google Scholar]
- 15.Naur P, Petersen BL, Mikkelsen MD, Bak S, Rasmussen H, Olsen CE, Halkier BA. 2003. CYP83A1 and CYP83B1, two nonredundant cytochrome P450 enzymes metabolizing oximes in the biosynthesis of glucosinolates in Arabidopsis. Plant Physiol. 133:63–72. 10.1104/pp.102.019240. [DOI] [PMC free article] [PubMed] [Google Scholar]
- 16.Wittstock U, Halkier BA. 2000. Cytochrome P450 CYP79A2 from Arabidopsis thaliana L. catalyzes the conversion of l-phenylalanine to phenylacetaldoxime in the biosynthesis of benzylglucosinolate. J. Biol. Chem. 275:14659–14666. 10.1074/jbc.275.19.14659. [DOI] [PubMed] [Google Scholar]
- 17.Yamaguchi T, Asano Y. 2014. Identification and characterization of CYP79D16 and CYP71AN24 catalyzing the first and second steps in l-phenylalanine-derived cyanogenic glycoside biosynthesis in the Japanese apricot, Prunus mume Sieb. et Zucc. Plant Mol. Biol. 86:215–223. 10.1007/s11103-014-0225-6. [DOI] [PubMed] [Google Scholar]
- 18.Kahn RA, Bak S, Svendsen I, Halkier BA, Møller BL. 1997. Isolation and reconstitution of cytochrome P450ox and in vitro reconstitution of the entire biosynthetic pathway of the cyanogenic glucoside dhurrin from Sorghum. Plant Physiol. 115:1661–1670. 10.1104/pp.115.4.1661. [DOI] [PMC free article] [PubMed] [Google Scholar]
- 19.Kahn RA, Fahrendorf T, Halkier BA, Møller BL. 1999. Substrate specificity of the cytochrome P450 enzymes CYP79A1 and CYP71E1 involved in the biosynthesis of the cyanogenic glucoside dhurrin in Sorghum bicolor (L.) Moench. Arch. Biochem. Biophys. 363:9–18. 10.1006/abbi.1998.1068. [DOI] [PubMed] [Google Scholar]
- 20.Asano Y, Kato Y. 1998. Z-Phenylacetaldoxime degradation by a novel aldoxime dehydratase from Bacillus sp. strain OxB-1. FEMS Microbiol. Lett. 158:185–190. 10.1111/j.1574-6968.1998.tb12818.x. [DOI] [Google Scholar]
- 21.Thiel V, Brinkhoff T, Dickschat JS, Wickel S, Grunenberg J, Wagner-Dobler I, Simon M, Schulz S. 2010. Identification and biosynthesis of tropone derivatives and sulfur volatiles produced by bacteria of the marine Roseobacter clade. Org. Biomol. Chem. 8:234–246. 10.1039/b909133e. [DOI] [PubMed] [Google Scholar]
- 22.Kato Y, Ooi R, Asano Y. 2000. Distribution of aldoxime dehydratase in microorganisms. Appl. Environ. Microbiol. 66:2290–2296. 10.1128/AEM.66.6.2290-2296.2000. [DOI] [PMC free article] [PubMed] [Google Scholar]
- 23.Kato Y, Nakamura K, Sakiyama H, Mayhew SG, Asano Y. 2000. Novel heme-containing lyase, phenylacetaldoxime dehydratase from Bacillus sp. strain OxB-1: purification, characterization, and molecular cloning of the gene. Biochemistry 39:800–809. 10.1021/bi991598u. [DOI] [PubMed] [Google Scholar]
- 24.Ozaki T, Nishiyama M, Kuzuyama T. 2013. Novel tryptophan metabolism by a potential gene cluster that is widely distributed among Actinomycetes. J. Biol. Chem. 288:9946–9956. 10.1074/jbc.M112.436451. [DOI] [PMC free article] [PubMed] [Google Scholar]
- 25.Kato Y, Ooi R, Asano Y. 1998. Isolation and characterization of a bacterium possessing a novel aldoxime-dehydration activity and nitrile-degrading enzymes. Arch. Microbiol. 170:85–90. 10.1007/s002030050618. [DOI] [PubMed] [Google Scholar]
- 26.Hull AK, Celenza JL. 2000. Bacterial expression and purification of the Arabidopsis NADPH-cytochrome P450 reductase ATR2. Protein Expr. Purif. 18:310–315. 10.1006/prep.1999.1195. [DOI] [PubMed] [Google Scholar]
- 27.Looman AC, Bodlaender J, Comstock LJ, Eaton D, Jhurani P, de Boer HA, van Knippenberg PH. 1987. Influence of the codon following the AUG initiation codon on the expression of a modified lacZ gene in Escherichia coli. EMBO J. 6:2489–2492. [DOI] [PMC free article] [PubMed] [Google Scholar]
- 28.Barnes HJ, Arlotto MP, Waterman MR. 1991. Expression and enzymatic activity of recombinant cytochrome P450 17 alpha-hydroxylase in Escherichia coli. Proc. Natl. Acad. Sci. U. S. A. 88:5597–5601. 10.1073/pnas.88.13.5597. [DOI] [PMC free article] [PubMed] [Google Scholar]
- 29.Guo ZY, Gillam EMJ, Ohmori S, Tukey RH, Guengerich FP. 1994. Expression of modified human cytochrome P450 1A1 in Escherichia coli: effects of 5′ substitution, stabilization, purification, spectral characterization, and catalytic properties. Arch. Biochem. Biophys. 312:436–446. 10.1006/abbi.1994.1330. [DOI] [PubMed] [Google Scholar]
- 30.Kato Y, Asano Y. 2003. High-level expression of a novel FMN-dependent heme-containing lyase, phenylacetaldoxime dehydratase of Bacillus sp. strain OxB-1, in heterologous hosts. Protein Expr. Purif. 28:131–139. 10.1016/S1046-5928(02)00638-1. [DOI] [PubMed] [Google Scholar]
- 31.Studier FW. 2005. Protein production by auto-induction in high-density shaking cultures. Protein Expr. Purif. 41:207–234. 10.1016/j.pep.2005.01.016. [DOI] [PubMed] [Google Scholar]
- 32.Omura T, Sato R. 1964. The carbon monoxide-binding pigment of liver microsomes: II. Solubilization, purification, and properties. J. Biol. Chem. 239:2379–2385. [PubMed] [Google Scholar]
- 33.Ferreira-Silva B, Lavandera I, Kern A, Faber K, Kroutil W. 2010. Chemo-promiscuity of alcohol dehydrogenases: reduction of phenylacetaldoxime to the alcohol. Tetrahedron 66:3410–3414. 10.1016/j.tet.2010.03.050. [DOI] [Google Scholar]
- 34.Ichinose H, Wariishi H. 2012. Heterologous expression and mechanistic investigation of a fungal cytochrome P450 (CYP5150A2): involvement of alternative redox partners. Arch. Biochem. Biophys. 518:8–15. 10.1016/j.abb.2011.12.010. [DOI] [PubMed] [Google Scholar]
- 35.Boucher J-L, Delaforge M, Mansuy D. 1994. Dehydration of alkyl- and arylaldoximes as a new cytochrome P450-catalyzed reaction: mechanism and stereochemical characteristics. Biochemistry 33:7811–7818. 10.1021/bi00191a008. [DOI] [PubMed] [Google Scholar]
- 36.Xie S-X, Kato Y, Asano Y. 2001. High yield synthesis of nitriles by a new enzyme, phenylacetaldoxime dehydratase, from Bacillus sp. strain OxB-1. Biosci. Biotechnol. Biochem. 65:2666–2672. 10.1271/bbb.65.2666. [DOI] [PubMed] [Google Scholar]
- 37.Mitsuda M, Iwasaki M. 2006. Improvement in the expression of CYP2B6 by co-expression with molecular chaperones GroES/EL in Escherichia coli. Protein Expr. Purif. 46:401–405. 10.1016/j.pep.2005.10.017. [DOI] [PubMed] [Google Scholar]
- 38.Uchida E, Kagawa N, Sakaki T, Urushino N, Sawada N, Kamakura M, Ohta M, Kato S, Inouye K. 2004. Purification and characterization of mouse CYP27B1 overproduced by an Escherichia coli system coexpressing molecular chaperonins GroEL/ES. Biochem. Biophys. Res. Commun. 323:505–511. 10.1016/j.bbrc.2004.08.110. [DOI] [PubMed] [Google Scholar]
- 39.Wu ZL, Qiao J, Zhang ZG, Guengerich FP, Liu Y, Pei XQ. 2009. Enhanced bacterial expression of several mammalian cytochrome P450s by codon optimization and chaperone coexpression. Biotechnol. Lett. 31:1589–1593. 10.1007/s10529-009-0059-5. [DOI] [PMC free article] [PubMed] [Google Scholar]
- 40.Ichinose H, Wariishi H. 2013. High-level heterologous expression of fungal cytochrome P450s in Escherichia coli. Biochem. Biophys. Res. Commun. 438:289–294. 10.1016/j.bbrc.2013.07.057. [DOI] [PubMed] [Google Scholar]
- 41.Goder V, Spiess M. 2003. Molecular mechanism of signal sequence orientation in the endoplasmic reticulum. EMBO J. 22:3645–3653. 10.1093/emboj/cdg361. [DOI] [PMC free article] [PubMed] [Google Scholar]
- 42.Wagner S, Baars L, Ytterberg AJ, Klussmeier A, Wagner CS, Nord O, Nygren P-Å, van Wijk KJ, de Gier J-W. 2007. Consequences of membrane protein overexpression in Escherichia coli. Mol. Cell. Proteomics 6:1527–1550. 10.1074/mcp.M600431-MCP200. [DOI] [PubMed] [Google Scholar]
- 43.Chemler JA, Koffas MAG. 2008. Metabolic engineering for plant natural product biosynthesis in microbes. Curr. Opin. Biotechnol. 19:597–605. 10.1016/j.copbio.2008.10.011. [DOI] [PubMed] [Google Scholar]
- 44.Julsing MK, Cornelissen S, Bühler B, Schmid A. 2008. Heme-iron oxygenases: powerful industrial biocatalysts? Curr. Opin. Chem. Biol. 12:177–186. 10.1016/j.cbpa.2008.01.029. [DOI] [PubMed] [Google Scholar]
Associated Data
This section collects any data citations, data availability statements, or supplementary materials included in this article.