

ABSTRACT
Influenza A virus (IAV) uses the low pH in late endocytic vacuoles as a cue for penetration by membrane fusion. Here, we analyzed the prefusion reactions that prepare the core for uncoating after it has been delivered to the cytosol. We found that this priming process occurs in two steps that are mediated by the envelope-embedded M2 ion channel. The first weakens the interactions between the matrix protein, M1, and the viral ribonucleoprotein bundle. It involves a conformational change in a linker sequence and the C-terminal domain of M1 after exposure to a pH below 6.5. The second step is triggered by a pH of <6.0 and by the influx of K+ ions. It causes additional changes in M1 as well as a loss of stability in the viral ribonucleoprotein bundle. Our results indicate that both the switch from Na+ to K+ in maturing endosomes and the decreasing pH are needed to prime IAV cores for efficient uncoating and infection of the host cell.
IMPORTANCE The entry of IAV involves several steps, including endocytosis and fusion at late endosomes. Entry also includes disassembly of the viral core, which is composed of the viral ribonucleoproteins and the RNA genome. We have found that the uncoating process of IAV is initiated long before the core is delivered into the cytosol. M2, an ion channel in the viral membrane, is activated when the virus passes through early endosomes. Here, we show that protons entering the virus through M2 cause a conformational change in the matrix protein, M1. This weakens interactions between M1 and the viral ribonucleoproteins. A second change was found to occur when the virus enters late endosomes. The preacidified core is then exposed to a high concentration of K+, which affects the interactions between the ribonucleoproteins. Thus, when cores are finally delivered to the cytosol, they are already partially destabilized and, therefore, uncoating competent and infectious.
INTRODUCTION
Influenza is a highly infectious acute respiratory illness causing seasonal epidemics and occasional global pandemics (1). With the emergence of highly virulent avian influenza viruses, the threat of new human influenza A virus (IAV) pandemics has increased over the past decade. Due to their high mutation rate, these viruses are capable of rapid genetic variation and host species shift.
IAV is an enveloped virus belonging to the Orthomyxoviridae. Common to all members of this virus family is a segmented, negative-strand RNA genome, where the RNAs are individually encapsidated in viral ribonucleoproteins (vRNPs). Each of the eight vRNPs consists of an RNA segment associated with the viral nucleoprotein (NP) and polymerase complex (PA, PB1, and PB2). Together with the matrix protein, M1, the vRNPs compose the core of the particle stabilized by interactions between the vRNPs and between vRNPs and the M1 matrix. By binding to the membrane and to the vRNPs, the M1 layer functions as an endoskeleton that provides structure and stability (2–7).
Entry of IAV into cells begins with binding of viral hemagglutinin (HA) to terminal sialic acid residues on host cell glycoproteins (8) and internalization by clathrin-mediated and clathrin-independent endocytosis (9–14). The virus then travels along the endocytic system to late endosomes (LEs) (15, 16), where exposure to an acidic environment (pH <5.5) induces a conformational change in HA that mediates fusion of the viral envelope with the endosomal membrane (17, 18). Fusion is followed by disassembly of the viral core in the cytosol and import of vRNPs into the nucleus, where replication and transcription take place (7, 19–21).
Prior to HA activation, the decreasing pH during endocytic trafficking triggers another essential change in the virus: it renders the core uncoating competent (6, 7, 22). This is triggered by the activation of ion channels in the viral envelope composed of the M2 protein (23–25). The resulting influx of protons alters the core so that M1 and the vRNPs can dissociate once the core is delivered to the cytosol by fusion (6, 7, 26, 27). If the M2 channel is blocked by the drug amantadine, fusion still occurs but the core does not uncoat, nor does it dissociate from the cytosolic surface of the endosome (7). Virus mutants devoid of M2 have been shown to be attenuated in animals and tissue culture (28).
IAV core-specific protein interactions and their disruption at acidic pH have mainly been studied in vitro (26, 27, 29–31). Similarly, M2 is commonly analyzed in a manner in which it is disconnected from the context of authentic virions. Expression of M2 in oocytes or mammalian cells and the reconstitution of the channel in liposomes provide reliable systems for electrophysiological measurements (25). These studies have shown that the channel is activated by low pH and is highly selective for protons. However, it can also support the flux of Na+ and K+, although with a 105- to 106-fold lower selectivity (32–35). In some aspects, M2 is similar to a transporter for monovalent cations (36–38).
In this study, we focused on the M2-mediated priming of the IAV core in intact viral particles in association with host cells, where the effect on uncoating and productive infection could be monitored. We found that priming occurs in two M2-dependent steps, of which the latter depends not only on protons but also on K+. The outcome is a stepwise weakening of interactions between viral core components. The results show that not only the drop in pH but also the gradual change in overall ionic milieu in maturing endocytic vacuoles play central roles in virus infection.
MATERIALS AND METHODS
Cells and viruses.
A549 and Madin-Darby bovine kidney (MDBK) cells were obtained from ATCC and cultured in Dulbecco modified Eagle medium (DMEM) supplemented with 10% fetal calf serum (FCS) and 1% GlutaMAX (Invitrogen). Egg-grown, purified influenza A virus strain X31 (an H3N2 reassorted strain derived from the A/Puerto Rico/8/34 [PR8] and A/Hong Kong/1/68 strains) was purchased from Virapur (CA, USA). Influenza virus wild-type (wt) strain WSN (WSN[wt]; A/WSN/1933 [H1N1]) and the recombinant, amantadine-sensitive variant WSN(AS) (RVII1) have been described previously (20). Recombinant Semliki Forest virus (SFV)-ZsGreen stocks were kindly provided by G. Balistreri (39). Uukuniemi virus (UUKV) S23 and vesicular stomatitis virus (VSV; Indiana serotype) were produced and used as previously described (40, 41).
Virus growth and preparation.
Purified influenza A virus strain X31 (H3N2) was produced by Virapur. Briefly, for X31 production, 60 chicken eggs were inoculated and incubated for 2 days at 33 to 37°C. Allantoic fluid was harvested and clarified by low-speed centrifugation, followed by a high-speed centrifugation step to concentrate the virus. For higher purity, X31 was further subjected to two ultracentrifugation steps using 10 to 40% sucrose step gradients. Viral bands were harvested, pooled, and diluted in formulation buffer (40% sucrose, 0.02% bovine serum albumin [BSA], 20 mM HEPES, pH 7.4, 100 mM NaCl, 2 mM MgCl2). Stocks of the WSN strains (A/WSN/1933 [H1N1]) of IAV were prepared as previously described (7). Briefly, MDBK cells were grown in roller bottles and infected with 0.01 PFU per cell when cells were 90% confluent. Cell supernatant was collected at 36 to 40 h postinfection (p.i.) or when 60 to 80% of the cells showed a cytopathic effect. The precleared supernatant was pelleted for 90 min at 28,000 rpm in a Beckman SW32 Ti rotor at 4°C, and the pellet was resuspended in MNT buffer (20 mM MES [2-4-morpholineethanesulfonic acid], 100 mM NaCl, 30 mM Tris), followed by sonication for 10 s. The dissolved pellet was then loaded on a discontinuous gradient composed of 6.5 ml of 30% (wt/vol) sucrose in MNT and 3 ml of 60% (wt/vol) sucrose in MNT and centrifuged for 90 min at 24,000 rpm in a Beckman SW41 rotor at 4°C. The virus band was collected from the gradient interface and aliquoted. Purified X31 and WSN were frozen and stored at −80°C until use.
Antibodies, chemicals, and reagents.
Hybridoma cell lines producing monoclonal antibodies specific for IAV M1 (HB-64) and NP (HB-65) were purchased from ATCC. The A1 antibody against the post-acid form of HA and anti-X31 rabbit polyclonal antibody (Pinda) have been previously described (42, 43). Anti-IAV M1 (goat) was obtained from ViroStat. Mouse anti-UUKV nucleoprotein antibody 8B11A3 was a kind gift from the Ludwig Institute for Cancer Research, Stockholm, Sweden. NuPAGE lithium dodecyl sulfate (LDS) sample buffer, rhodamine B chloride (R18), 3,3′-dioctadecyl-5,5′-di(4-sulfophenyl)oxacarbocyanine, sodium salt (SP-DiOC18), Alexa Fluor (AF)-labeled epidermal growth factor (EGF), wheat germ agglutinin (WGA), phalloidin, and AF-conjugated secondary antibodies were purchased from Invitrogen. Nuclei were stained with DRAQ5 (Biostatus Ltd.) or Hoechst (Molecular Probes). Bafilomycin A1 (BafA), cycloheximide (CHX), nocodazole, carbonyl cyanide m-chlorophenylhydrazone (CCCP), amantadine, valinomycin, poly-l-lysine, phenylmethanesulfonyl fluoride (PMSF), sequencing grade-modified trypsin, proteinase K (PK), and formaldehyde (FA) solution (36%) were obtained from Sigma-Aldrich. Asante potassium green 3 (APG3) salt was from Teflabs. EDTA-free protease inhibitor cocktail tablets were purchased from Roche.
Thin-section EM.
For thin-section electron microscopy (EM), A549 cells were grown on coverslips. Virus was bound to precooled cells for 1 h on ice, directly fixed (2.5% glutaraldehyde, 0.05 M sodium cacodylate at pH 7.2, 50 mM KCl, 1.25 mM MgCl2, 1.25 mM CaCl2) for 30 min or incubated for 60 to 90 s in fusion medium (DMEM, 50 mM citrate buffer, pH 5.0) at 37°C, and immediately fixed. Samples were incubated for 1 h at room temperature (RT) in 2% OsO4, followed by overnight incubation at 4°C with 0.5% uranyl acetate. Dehydration, embedding, and thin sectioning were performed as previously described (44). Embedded samples were sectioned into 50- to 60-nm thin slices.
Priming buffers.
DMEM-based pH and cation (high Na+, K+, Cs+, and Li+) buffers were adjusted at 37°C on the same day of the experiment with the following buffering agents: 20 mM HEPES for pH 7.4, 30 mM MES for pH 6.5 to 5.6, and 50 mM citric buffer (from a 1 M stock of citric acid and sodium citrate) for pH 5.4 to 5.0. Buffers were then fine adjusted with HCl or NaOH. In the case of DMEM-free buffers, the desired salt concentrations were achieved by adding NaCl or KCl. In the case of high-concentration (120 mM) Cs+, Li+, and K+ buffers, 5 mM Na+ was added. High-concentration Na+, Cs+, and Li+ buffers were further supplemented with 5 mM KCl. Since pH 5.8 buffers were adjusted with NaOH, an additional 5 mM Na+ was present in these solutions.
FACS-based X31 fusion assay.
IAV was labeled with R18 and a self-quenching concentration of SP-DiOC18, as previously described (45). Briefly, purified IAV was diluted in phosphate-buffered saline (PBS) to a final concentration of 0.1 mg/ml and incubated for 1 h at RT with R18 (final concentration, 0.4 μM) and SP-DiOC18 (final concentration, 0.2 μM) while the mixture was gently shaken. To remove unincorporated dye, virus particles were filtered through a 0.22-μm-pore-size filter (Millipore) and used fresh for each experiment. To measure the acid-induced fusion of labeled X31 at the plasma membrane (PM), A549 cells were detached with EDTA solution (0.53 mM EDTA in PBS, pH 8.0) and washed with infection medium, and virus diluted in cold infection medium was bound to the cells on ice for 1 h. The virus inoculum was removed and the cells were washed once with cold infection medium. Pellets were dissolved with the DMEM-based pH buffers adjusted to the indicated pH, incubated for 2 min at 37°C, and directly fixed by adding an equal volume of 8% FA for 20 min at RT. Samples were washed and resuspended in fluorescence-activated cell sorting (FACS) buffer (PBS, 0.2% FCS, 5 mM EDTA). The amount of SP-DiOC18 fluorescence released upon lipid mixing was measured using a FACSCanto II flow cytometer system. A total of 10,000 cells per condition were counted, and data were analyzed with FlowJo software.
X31 fusion kinetics.
For fusion kinetic experiments, X31 diluted in PBS was labeled with R18 at a final concentration of 0.42 μM for 1 h at RT while the mixture was gently shaken. The excess dye was removed by filtering through a 0.22-μm-pore-size filter. Labeled virus was bound to EDTA-detached and precooled cells for 1 h on ice, followed by a washing step with PBS to remove unbound virus. The cell pellet with bound virions was resuspended in 100 μl PBS and subsequently added to 900 μl prewarmed PBS in a 1.5-ml fluorescence cuvette (119.004-QS; Hellma). For equilibration, samples were kept at 37°C for 1 min, and then fusion was initiated by lowering the pH to the desired values (pH 6.5 to 5.0) by addition of 100 μl MES (0.063 to 1 M). Low-pH-induced R18 dequenching was measured over time using a Cary Eclipse fluorescence spectrophotometer (Varian) with an excitation wavelength of 560 ± 5 nm and detection at an emission wavelength of 590 ± 5 nm. The fusion reaction was terminated by addition of 0.1% (final concentration) Triton X-100, which released the maximal dequenching capacity. The percentage of fusion-induced R18 dequenching was normalized to the fluorescence measured in the presence of 0.1% Triton X-100.
Infection assays.
All infection assays in this study were performed in A549 cells seeded on 96-well Matrix plates (Greiner Bio-One) and by applying an automated imaging and infection scoring procedure, as previously described (46). Cells were infected with IAV (X31, WSN[wt], or WSN[AS]) diluted in infection medium (DMEM, 0.2% BSA, 50 mM HEPES, pH 6.8) with a virus concentration that resulted in 20% infection and fixed at 10 h p.i. in 4% FA. Cells were incubated in permeabilization buffer (0.1% saponin, 1% BSA, 10% FCS in PBS) for 20 min at RT, followed by indirect immunofluorescence using mouse monoclonal anti-IAV NP (HB-65, 1:100) as a primary antibody and anti-mouse antibody labeled with AF488 as a secondary antibody. Nuclei were visualized by staining with Hoechst (1:5,000). For each well, 9 (3 × 3) images were automatically acquired with an epifluorescence microscope (MD Assay Development 2 [MD2]; Molecular Devices) using a ×10 objective. The ratio of viral protein-positive cells to the total number of cells was determined by use of the MATLAB-based (The MathWorks, Inc.) infection counter software described previously (47). In each experiment, >1,000 cells were quantified. In the case of SFV, VSV, and UUKV, experiments were performed following the same protocol, with the exception that SFV infection was carried out with RPMI supplemented with 0.2% BSA, 20 mM HEPES adjusted to pH 7.2. SFV- and VSV-infected cells were fixed at 5 h p.i., and UUKV-infected cells were fixed at 19 h p.i. SFV and VSV infection was detected on the basis of green fluorescent protein (GFP) expression, and UUKV infection was detected by immunostaining, as described previously (48).
Acid-bypass assays.
Virus (with a multiplicity of infection [MOI] of ∼5) was bound to precooled A549 cells for 1 h on ice, followed by one washing step in cold infection medium and a 2-min pulse at 37°C with warm fusion medium (DMEM, 50 mM citric buffer) adjusted to pH 5.0 (IAV, UUKV, VSV) and pH 5.2 (SFV). Acid-bypass control samples were incubated for 2 min at 37°C with warm stop medium (DMEM, 50 mM HEPES, 20 mM NH4Cl, pH 7.4). Cells were immediately shifted back on ice, washed twice with cold infection medium, and incubated at 37°C in stop medium to block endosome acidification and, thus, further IAV entry via endocytosis. At 14 h p.i., cells were fixed with 4% FA for 20 min at RT. Experiments were carried out in 96-well Matrix plates using multichannel pipettes, which ensured the exact timing of the initiation and termination of acid-induced viral fusion for all conditions tested in one experiment. In the case of experiments with amantadine, viruses were preincubated with 100 μM drug (diluted in double-distilled H2O [ddH2O]) for 5 min at RT before acid bypass. Likewise, virus was preincubated with CCCP (70 nM, diluted in DMSO) and valinomycin (2.5 μg/ml, diluted in DMSO) for 5 min before acid bypass. The single reagents or a combination of those were further added to the fusion medium but omitted from the subsequent incubation with stop medium. Detailed information about sequential treatments with amantadine, CCCP, and valinomycin can be found in the respective figure legends. When valinomycin was combined with preacidification, the ionophore was washed out by using Amicon Ultra-0.5 centrifugal filters (100-kDa cutoff) according to the manufacturer's protocol (Millipore).
IAV in vitro priming.
For all priming experiments, a small volume of purified IAV was added to a larger volume of pH buffer. Here, the volume ratio of virus/pH buffer was kept at >1:20 to avoid fluctuation in the pH upon virus addition. Pretreatment of virus was performed at 37°C, followed by a short incubation on ice before binding to precooled A549 cells and acid-bypass assay. Neutralization of the pH buffers was achieved by addition of 1 M HEPES (pH 9.5). The volume needed to reach pH 7.4 was determined by titration for every fresh pH or cation buffer used on the same day as the experiment. In the case of pretreatment with different cation buffers, in vitro-primed virus was diluted in cold infection medium, which equilibrated the pH and resulted in a final K+ concentration of 10 mM, before proceeding with the acid-bypass protocol.
In vitro X31 HA acidification.
Virus particles were treated for 60 min at 37°C in the respective priming buffers while the virus particles were bound to glass coverslips. Samples were immediately fixed with 4% FA for 20 min at RT and incubated in permeabilization buffer. Indirect immunofluorescence using a monoclonal (mouse) antibody against the acid form of HA (A1, 1:1,000) and a polyclonal (rabbit) antibody against X31 (Pinda, 1:10,000) was performed. Images were acquired by confocal microscopy (LSM Meta; Zeiss) with a ×100 objective. Typically, a total of 1,000 to 1,500 virions per condition were counted, and the percent colocalization was quantified by using a custom-made MATLAB-based software. The percentage of virions with acidified HA was determined by the ratio of A1-positive/Pinda-positive particles.
IAV binding to cell surface.
A549 cells were grown on glass coverslips. Virus was bound to precooled cells for 1 h on ice, washed extensively with cold PBS, and immediately fixed with 4% FA for 20 min at RT. Cells were stained with WGA-AF594 (1:250) for 30 min at RT, incubated in blocking solution (1% BSA, 10% FCS in PBS) for 30 min at RT, and subjected to indirect immunofluorescence with anti-X31 (Pinda, 1:10,000) antibody and DRAQ5 (1:1,000) to visualize the nuclei. Z-stacks of ∼100 cells per condition were acquired by confocal microscopy using a ×100 objective, and maximum Z-stack projections were analyzed with ImageJ software. To remove the background signal, a threshold value for the Pinda signal was set in each experiment. Spots with a signal above this threshold were counted using the spot detection function of ImageJ. WGA staining served as a marker for the total cell area. Finally, the number of bound particles per cell area was calculated.
M1 and NP exposure (uncoating) after acid bypass.
A549 cells were seeded on poly-l-lysine-coated 96-well Matrix plates to increase cellular attachment. To detect the X31 M1 and NP released after acid-induced fusion, a high MOI (∼300) was used and the standard acid-bypass protocol was applied. Cells were fixed at 5 min (M1) and 30 min (NP). CHX (1 mM) was added to the stop medium to prevent synthesis of new viral proteins. Samples were incubated for 20 min at RT in permeabilization buffer and subjected to immunofluorescence staining with anti-M1 (HB-64, 1:250) and anti-NP (HB-65, 1:10). Representative images were acquired by confocal microscopy using a ×100 objective. For quantification, 16 (4 × 4) images of each well were acquired with an MD2 microscope using a ×20 objective. In each experiment, the specific uncoating signal was quantified for ∼1,000 cells with ImageJ. First, a threshold value for M1 and NP was set in each experiment. Second, the total area of the signal above this threshold was determined. Finally, this value was divided by the number of cells, and that value was normalized to the value for the control sample.
Immunofluorescence costaining of M1 and NP.
A549 cells were grown on poly-l-lysine-coated glass coverslips. Cells were subjected to the acid-bypass protocol (MOI, ∼300) as described above. For detection of M1 and NP following acid bypass, cells were permeabilized with 0.1% Triton X-100 in PBS for 20 min at RT and incubated in blocking solution for 30 min at RT. Samples were stained with the primary antibodies anti-M1 (goat, 1:500) and anti-NP (1:10), followed by incubation with phalloidin-AF647 and the secondary antibodies donkey anti-goat (AF488) and donkey anti-mouse (AF594). Images were acquired with a confocal microscope using a ×100 objective.
In vitro uncoating assay.
The in vitro uncoating assay was adapted from a protocol previously described for WSN (26). Briefly, 30 μl of clarified allantoic fluid containing X31 (5 μg/μl) or purified WSN (2 μg/μl) diluted in MNT buffer was loaded on top of a two-layer glycerol gradient composed of 3 ml of 15% (vol/vol) glycerol and 3.4 ml of 25% (vol/vol) glycerol. The bottom layer further contained 1% Nonidet P-40 (NP-40), 150 mM NaCl, and a general protease inhibitor and was adjusted to the appropriate pH by adding 5 mM Tris (for pH 7.4 and 6.4), 5 mM MES (for pH 5.8 and 5.4), or citric buffer (for pH 5.0). When different salt concentrations were tested, the same gradient setup was used, except the total salt concentration was kept at 135 mM. The combinations of NaCl and KCl concentrations used are indicated in the respective figures. Gradients were centrifuged for 150 min at 21,000 rpm and 12°C in a Beckman SW41 rotor. The glycerol layers were aspirated, and the pellet was dissolved in 40 μl nonreducing sample buffer (NuPAGE LDS) and boiled for 5 min at 95°C. Twenty microliters of the dissolved pellet was loaded on a NuPAGE bis-Tris minigel (4 to 12%) and was separated by SDS-PAGE. The gels were fixed in 50% methanol–10% acetic acid and stained with colloidal Coomassie. After destaining in ddH2O, the gels were scanned and bands were quantified by using Quantity One software (Bio-Rad). In the case of PB2 detection, 7 μl of the pellet dissolved in sample buffer was separated by SDS-PAGE and subjected to immunoblotting using a mouse monoclonal anti-PB2 antibody (1:1,000).
Proteinase K- and trypsin-based LiP.
Purified X31 was pretreated in the respective priming buffers, neutralized with 1 M HEPES (pH 9.5), and lysed for 20 min at RT with 0.1% NP-40 in MNT buffer for PK-based limited proteolysis (LiP) and 0.1% Triton X-100 in MNT buffer for trypsin-based LiP. The protein concentration of the lysates was measured using a bicinchoninic acid (BCA) assay (BCA protein assay kit; Thermo Scientific, Rockford, IL, USA). LiP was performed by adding PK to the protein extract at an enzyme/substrate ratio of 1:100 and incubating the mixture for 5 min at RT. The resulting peptides were subjected to liquid chromatography (LC)-selected reaction monitoring (SRM)/mass spectrometry (MS) analysis essentially as described by Feng et al. (49).
In the case of LiP with trypsin, the protease was added at a ratio of 1:4 (trypsin/M1) and the mixture was incubated at RT for the times indicated below. The reaction was stopped by addition of reducing SDS sample buffer containing 2 mM PMSF. Samples were boiled for 5 min at 95°C, separated by SDS-PAGE, and subjected to immunoblotting using a monoclonal antibody against M1 (HB-64).
EGF uptake.
A549 cells were grown on 8-well Nunc Lab-Tek II chamber slides (Sigma-Aldrich) and starved for 4 h in DMEM without supplements prior to EGF addition. EGF-AF647 (200 ng/ml) was bound to precooled A549 cells for 60 min on ice. The cells were extensively washed and shifted to 37°C, and the medium was changed to full medium (DMEM, 10% FCS, 1% GlutaMAX) for internalization and subsequent imaging by live confocal microscopy using a ×100 objective.
Loading of endosomes with APG3.
A549 cells were grown on 8-well Nunc Lab-Tek II chamber slides. For experiments in combination with EGF uptake, cells were washed after EGF binding, shifted to 37°C, and loaded with 20 μM membrane-impermeant version of the APG3 salt (diluted in ddH2O) for 30 min. Cells were washed with warm A549 growth medium and imaged by live confocal microscopy on a temperature-controlled stage set to 37°C using a ×100 objective. To visualize APG3 fluorescence over time following internalization, cells were loaded with APG3 for 30 min at 37°C. Cells were again washed with warm A549 cell growth medium and immediately imaged at the indicated time points by live confocal microscopy on a temperature-controlled stage set to 37°C using a ×100 objective. To test the effect of endosome maturation inhibition, cells were incubated with nocodazole (30 μM in DMSO) for 30 min at 37°C together with APG3. The drug was further present during washing steps and image acquisition. Mean fluorescence intensities for >40 cells per condition were determined by ImageJ and normalized to the intensity at the first time point at which it was acquired (5 min after the APG3 pulse).
Statistical analysis.
Data are represented as the means of at least triplicate experiments ± standard deviations (SDs), except for data in Fig. 2C, 4C and F, as well as 5B, E, and G, for which the results of duplicate experiments were quantified and are shown as means ± SDs.
FIG 2.

Effect of mild acid pretreatment on IAV infection, viral binding, and fusion. (A) Preacidification and neutralization of X31 prior to acid-bypass infection. Virus was pretreated for 1 h at 37°C in DMEM-based buffers adjusted to the indicated pH values. As shown schematically at the top, half of the samples were neutralized by addition of HEPES (1 M, pH 9.5) (white bars). Both sets of samples were subjected to the acid-bypass infection assay. (B) Pretreatment of X31 prior to normal infection. As shown schematically at the top, virus was pretreated for 1 h in DMEM-based buffers adjusted to the respective pH values at 37°C, neutralized, and added to A549 cells. Cells were incubated in infection medium and fixed at 10 h p.i. Statistical significance was assessed by Student's t test. (C) Binding of preacidified virus to A549 cells. X31 was pretreated with the indicated DMEM-based pH buffers for 1 h at 37°C, bound for 1 h on ice, and fixed. Cells were washed extensively in PBS and left unpermeabilized. Bound particles were detected by indirect immunofluorescence using a polyclonal anti-X31 antibody. Cell borders were visualized by staining with WGA, and nuclei were stained with DRAQ5. Representative confocal images for all conditions (right) and quantification results (left) are shown. Bar, 15 μm. (D) Fluorescence spectroscopy monitoring the fusion kinetics of R18-labeled X31 with the A549 cell surface following preacidification and neutralization. R18 dequenching was measured as explained in the legend to Fig. 1C. pre-treatm., pretreatment; neutr., neutralization; n.s., no significant difference.
FIG 4.

Effect of a high K+ concentration during IAV core priming. (A) Preacidification in the presence of various monovalent cation conditions prior to acid-bypass infection. X31 was pretreated for 1 h at 37°C in buffers adjusted to pH 7.4 or 5.8 and supplemented with 120 mM indicated monovalent cations. The total ionic strength was kept constant. Following binding, the normal acid-bypass protocol described in the text was applied. (B) Preincubation with K+ over a range of concentrations (0 to 135 mM K+) at pH 5.8 prior to acid-bypass infection. (C) Binding of pretreated virus to A549 cells. X31 was pretreated for 1 h at 37°C under the indicated conditions, neutralized, and bound to A549 cells for 1 h on ice. Cells were fixed, washed, and left unpermeabilized. Bound particles were detected by using an anti-X31 polyclonal antibody (Pinda). (D) HA acidification upon exposure to acidic conditions with high (120 mM) and low (5 mM) K+ concentrations for 1 h at 37°C. (E) Fluorescence spectroscopy monitoring of the fusion kinetics of R18-labeled X31 with the A549 cell surface following preacidification (pH 5.8) in the presence of 120 mM K+. R18 dequenching was measured as explained in the legend to Fig. 1C. (F) IAV uncoating upon preacidification in the presence of 120 mM K+ and acid-induced fusion at the PM. Virus was pretreated for 1 h at 37°C. Neutralized virus was bound to A549 cells on ice, and fusion was induced as described for the acid-bypass infection assay. Cells were incubated for 5 min (M1) and 30 min (NP) after fusion in the presence of CHX-containing stop medium, fixed, and stained for M1 and NP, respectively, by indirect immunofluorescence. (Left) Representative images. Nuclei were visualized by DRAQ5 staining. (Right) M1 and NP exposure, as a measure for viral uncoating, was quantified as described in the legend to Fig. 3A. Bars, 20 μm. (G) Preacidification (Pre-acid.) of X31 in the presence and absence of the K+-specific ionophore valinomycin at 120 mM and 5 mM K+ prior to acid-bypass infection. (H) Acid-bypass infection assay of WSN(AS) in the presence of CCCP, valinomycin, and amantadine. (Right) As shown schematically, IAV was pretreated with the indicated drug combinations for 5 min at RT. When amantadine was combined with either CCCP, valinomycin, or both, virus was first treated with amantadine for 5 min to block M2 channels, and then CCCP, valinomycin, or both were added to the solution and the mixture was further incubated for 5 min. Drugs were present during the fusion step. The acid-bypass infection assay was performed under the same conditions described for X31.
FIG 5.

Priming induces stepwise disassembly of the IAV core in vitro. (A) In vitro uncoating of X31 under different pH conditions. Purified X31 was diluted in 1 ml MNT (20 mM MES, 100 mM NaCl, 30 mM Tris) buffer, which was layered on a two-step glycerol gradient: 3 ml 15% (vol/vol) glycerol prepared in distilled water without any additions (interlayer) and 3.4 ml 25% glycerol (vol/vol) containing 1% NP-40 (bottom layer). The bottom layer was adjusted to the desired pH and salt concentration. For neutral pH, complete subviral particles were pelleted, whereas conditions favorable for uncoating of the virus led to the dissociation of viral core components into the bottom layer. Glycerol supernatants were removed, and the pellets were dissolved in nonreducing sample buffer followed by SDS-PAGE. Gels were stained with Coomassie, and viral protein band intensities were quantified by densitometry. The indicated pH conditions were tested at a constant salt concentration (150 mM NaCl). As a control, NP-40 was omitted from the bottom glycerol layer. vRNPs were detected by Western blot analysis using a monoclonal antibody against IAV PB2. (B) Densitometric quantification of the intensities of viral protein bands shown in panel A. Protein band intensities were normalized to those at pH 7.4 without NP-40. (C) In vitro uncoating of WSN(wt) at mildly acidic pH (pH 5.5). The same experimental setup described in the legend to panel A was applied. (D) Effect of a high K+ concentration (135 mM) and pH 5.8 on X31 uncoating in vitro. The assay was performed as described in the legend to panel A. (E) Densitometric quantification of the intensities of viral protein bands shown in panel D. Protein band intensities were normalized to those at pH 7.4 without NP-40. (F) Analysis of the effect of a range of K+ concentrations (0 to 135 mM K+) at pH 5.8 on X31 uncoating in vitro. The assay was performed as described in the legend to panel A. The total ionic strength was kept constant by supplementing the bottom glycerol layer with the indicated amounts of NaCl and KCl. (G) Densitometric quantification of the intensities of viral protein bands shown in panel F. Protein band intensities were normalized to those at pH 7.4 with 135 mM Na+ and NP-40.
RESULTS
Fusion of IAV with the PM fails to support efficient infection.
The fusion and uncoating of incoming IAV are hard to study because they take place in LEs, a compartment to which there is no direct access experimentally. To avoid this problem, we employed acid-bypass infection, a technique that allows controlled penetration of viruses into the cytosol directly through the plasma membrane (PM) without the involvement of the endocytic pathway (50, 51) (see the experimental setup in Fig. 1A).
FIG 1.

Acid-induced fusion of IAV at the PM of A549 cells. (A) Schematic overview of the acid-bypass infection assay. Virus was bound to A549 cells on ice, followed by a 2-min pH 5.0 pulse at 37°C. Acid-bypass control samples were incubated for 2 min at 37°C in infection medium. Following acid bypass, cells were incubated for 14 h at 37°C in stop medium to block endosome acidification and, thus, further viral entry via endocytosis. (B) Thin-section EM of X31 fusion at the PM of A549 cells. Virus was bound to cells on ice, directly fixed (left) or incubated for 60 to 90 s in fusion medium (pH 5.0) at 37°C (middle and right), and then fixed. Viruses with compact-appearing core elements (red asterisks) could be captured during fusion. The viral glycoproteins were clearly visible on the outer side of the PM (black arrowheads). Bar, 100 nm. (C) Fluorescence spectroscopy monitoring the fusion kinetics of R18-labeled X31 with the A549 cell surface upon acid exposure. Following binding of labeled virus to cells on ice, samples were shifted to 37°C, and then fusion was initiated by lowering the pH to the indicated value. Fluorescence dequenching of R18 was measured over time, and the reaction was terminated by addition of 0.1% (final concentration) Triton X-100, which released the maximal dequenching capacity. The percent R18 dequenching shown was normalized to the fluorescence measured in the presence of 0.1% Triton X-100. max., maximum. (D) Comparison of acid-bypass infection and normal infection via endocytosis for RNA viruses. The acid-bypass protocol was performed as described in the legend to panel A. In the case of normal infection, virus was bound to A549 cells, washed, and continuously incubated in infection medium until fixation. IAV and UUKV were scored by immunostaining, detecting newly synthesized viral nucleoproteins. SFV and VSV infection was detected on the basis of GFP expression. The percentage of infected cells was normalized to the values obtained for normal infection. (E) Schematic overview of pretreatment prior to acid-bypass infection (top). X31 was pretreated for 1 h at 37°C in DMEM-based buffers adjusted to the indicated pH values. Following binding for 1 h on ice, the normal acid-bypass protocol described in the legend to panel A was performed (red line, primary y axis). In vitro HA acidification and fusion capacity were tested for the respective pH values in separate experiments (blue lines; secondary y axis). HA acidification was assessed using a conformation-specific antibody (A1) targeting only the acidic form of HA (blue line, open circles). Fusion capacity was determined by applying a FACS-based fusion assay (blue line, closed circles). (F) Kinetics of pretreatment prior to acid-bypass infection. Virus was pretreated for the indicated incubation times in DMEM-based buffers adjusted to the indicated pH values at 37°C, followed by acid-bypass infection, as described in the legend to panel E. (G) Preacidification of WSN(wt) prior to acid-bypass infection. WSN(wt) was pretreated with the indicated DMEM-based pH buffers for 10 min at 37°C, followed by performance of the acid bypass and infection scoring protocol as described for X31.
To adapt this procedure to the X31 strain of IAV (H3N2) and A549 cells, we employed thin-section electron microscopy (EM). After virus binding in the cold, the cells were exposed to pH 5.0 for 60 to 90 s at 37°C before fixation. Viral particles could be identified by their size and shape as well as the electron-dense core and surface spikes (Fig. 1B). Viruses at various stages of fusion with the PM were visible. Electron-dense patches, presumably IAV capsids, were commonly observed to be associated with the cytosolic surface of the PM (Fig. 1B, red asterisks).
To determine the efficiency and kinetics of acid-bypass fusion, we labeled viruses with R18. Lipid mixing with the target membrane upon fusion leads to dilution of the dye, and the resulting fluorescence dequenching can be used to monitor virus fusion (52–54). At the optimal fusion pH of 5.0, we measured a dequenching efficiency of 60 to 70% compared to the maximal value induced by detergent addition (Fig. 1C). The half-time of fusion was 20 s. At pH 5.5, only ∼20% of the maximal dequenching occurred. At higher pH values, no dequenching could be detected. Our data thus indicate that fusion of IAV with the PM of A549 cells is rapid and efficient.
To test whether A549 cells can be successfully infected by acid-bypass fusion of X31, we used a lower amount of virus (MOI, 5) Following pH 5.0-induced fusion, NH4Cl-containing medium was added to prevent penetration of nonfused viruses via the endosomal route (50). The fraction of infected cells was determined after 14 h by an automated, imaging-based assay (46, 55, 56).
While some of the cells were infected after acid bypass, their number was 10- to 20-fold lower than that when the bound viruses were allowed to enter via the normal endocytic pathway (Fig. 1D). If the cells were not acidified (acid-bypass control), no infected cells were detected. This suggested that the majority of capsids delivered through the PM into the cytosol failed to initiate replication. Similarly, acid-bypass fusion of A549 cells with VSV led to a 75% decrease in infectivity compared to that by normal infection (Fig. 1D).
When our acid-bypass protocol was applied to Semliki Forest virus (SFV), an alphavirus, the infection was only 40% lower than the level of infection by the endocytic pathway (Fig. 1D). For Uukuniemi virus (UUKV), a bunyavirus, acid-bypass infection was higher than that after normal endocytic entry, which is in agreement with previous findings (57). This implies that IAV fusion with the PM does not lead to efficient infection, a feature that was not shared by acid-activated alpha- and bunyaviruses.
Exposure to pH 6.5 to 5.4 elevates acid-bypass infection efficiency.
One possible reason for the low acid-bypass infectivity was that the virus core had not been exposed to the mildly acidic milieu that leads to priming (6, 22). To mimic the conditions during endosome trafficking, we therefore subjected IAV to an in vitro priming protocol, as presented in the scheme at the top of Fig. 1E. Viruses were incubated for 1 h at 37°C in DMEM-based buffers in which the pH was adjusted to values in the range of 7.5 to 5.0, followed by acid-bypass infection.
While preincubation at a pH of >6.6 had no effect, the level of infectivity of IAV preincubated in the range of pH 6.6 to 5.4 equaled (or even exceeded) the level observed after normal endocytic entry. Maximally, a 30-fold elevation in infectivity was observed after pretreatment at pH 5.4 (Fig. 1E, red line, shown on a log scale). When primed viruses entered cells by the normal route, a similar boost was not observed (Fig. 2B).
Preexposure to a pH below 5.4 caused a steep drop in infectivity (Fig. 1E, red line), consistent with a known effect observed when HA is exposed to a pH below its threshold pH in the absence of a target membrane (58–61). HA conformational changes were confirmed using a monoclonal antibody (A1) that recognizes only the acid-induced conformation of HA (Fig. 1E, blue line, open circles) (43). This result correlated well with the findings of a FACS-based fusion assay measuring the dequenching of R18-DiOC18-labeled X31 upon acid-induced fusion (Fig. 1E, blue line, closed circles). The pH threshold observed in both assays was in agreement with the values determined for the H3 subtype (62).
In order to separate priming- and HA-connected effects, we restricted further in vitro priming experiments to pHs of 5.8 and higher. When IAV was exposed to pH 5.8 for different time periods at 37°C, maximal infectivity was reached after 30 min (Fig. 1F), with the half-time being 10 min. At pH 6.4, the maximum level was reached after 90 min. The slow conversion explained why priming did not occur during the less than 2 min of acidification needed to trigger fusion during acid bypass. We found, moreover, that acid-bypass infection by another strain of virus (H1N1 strain A/WSN/1933) was also elevated when the virus was primed in vitro (Fig. 1F). In this strain, the threshold pH for HA inactivation is higher (pH 5.6) (58, 62). This limited the pH range for priming to pH 5.8 and higher.
To determine whether the priming-induced boost in infectivity was reversed by reneutralization, we primed X31 for 1 h using buffers at pH 7.4, 6.4, or 5.8. Neutralization of the pH 5.8-treated virus caused a 40% loss of infectivity, but the virus was still 6-fold more infectious than the virus pretreated at pH 7.4. This indicated that the conversion was only partially reversed. After pH 6.4 pretreatment, the loss of infectivity after neutralization was 70%. Preacidification at pH 5.0 prior to acid bypass or normal infection led, as expected, to irreversible inactivation of HA and, thus, a loss of infectivity (Fig. 2A and B) (58).
The results indicated that exposure of virus particles to a mildly acidic pH in vitro elevated their infectivity after acid bypass. Starting at pH 6.5, the effect became more prominent with decreasing pH until the threshold pH of HA activation was reached. The associated changes occurred slowly and were, in part, irreversible.
Priming improves core disassembly.
To define which step in the infection process was enhanced by in vitro priming, we used quantitative, image-based assays (46). We found no difference between primed and unprimed IAV in cell surface binding (Fig. 2C) or in bypass fusion kinetics and efficiency (Fig. 2D). However, when cells were fixed 5 min after bypass fusion with primed IAV, strong M1 staining could be detected throughout the cytoplasm, indicative of efficient uncoating (Fig. 3A) (20, 46). NP was present as spots in the cytoplasm largely free of M1 (Fig. 3B, bottom, white arrowheads). After 30 min, NP of the primed viruses was already detectable in the nucleus (Fig. 3A). With unprimed virus, the overall staining of M1 and NP antigens was much weaker (∼8- to 10-fold for M1 and 2.5-fold for NP), and most of the M1 and NP remained in spots at or close to the PM (Fig. 3B). We concluded that primed and unprimed viruses fused efficiently with the PM but only the cores of primed viruses underwent uncoating, whereas the cores of unprimed viruses stayed intact and remained associated with the PM.
FIG 3.

Mild acidification of viral core proteins prior to pH 5.0-mediated fusion leads to more efficient uncoating. (A) IAV uncoating upon preacidification and acid-induced fusion at the PM. Virus was pretreated for 1 h at 37°C in DMEM-based buffers adjusted to pH 7.4 and 5.8. Neutralized virus was bound to A549 cells on ice, and fusion was induced as described for the acid-bypass infection assay. Cells were incubated for 5 min (M1) and 30 min (NP) after fusion in the presence of CHX-containing stop medium, fixed, and stained for M1 and NP, respectively, by indirect immunofluorescence. (Right) Representative images. Nuclei were visualized by DRAQ5 staining. (Left) M1 and NP exposure, as a measure for viral uncoating, was determined by measurement of the total fluorescence per cell and quantified with ImageJ. Bars, 20 μm. (B) Detection of M1 and NP upon acid bypass of preacidified virus. Virus was pretreated and fused at the PM of A549 cells as described in the legend to panel A. After 5 min incubation in CHX-containing stop medium, cells were fixed and stained for M1 and NP. White arrowheads, M1-free NP-staining. Bars, 10 μm. (C) Acid-bypass infection of WSN(wt) and amantadine-sensitive WSN(AS) in the presence of 100 μM the M2 inhibitor amantadine. See Materials and Methods for details about the construction of recombinant WSN(AS). (D) Preacidification of WSN(wt) and WSN(AS) in the presence of amantadine. Virus was pretreated with amantadine for 5 min at RT prior to preacidification at pH 6.2 for 10 min at 37°C. Acid-bypass infection was performed under the same conditions used for X31. (E) Acid bypass of X31 in the presence of CCCP. As schematically shown on the right, IAV was either left untreated (condition 1), preacidified at pH 5.8 for 1 h at 37°C (condition 2), or treated with CCCP for 5 min at RT (condition 3) or preacidification was combined with CCCP treatment (condition 4). Samples were subjected to either acid-bypass infection assay or normal infection of A549 cells, as described in the legend to panel A. CCCP was further present during the 2-min fusion step but excluded from subsequent incubation in stop and infection medium. (F) IAV uncoating upon acid-induced fusion at the PM in the presence of CCCP. Preincubation with CCCP and acid bypass were performed as described in the legend to Fig. 1D. Cells were fixed for 5 min (M1) and 30 min (NP) after acid bypass and subjected to indirect immunofluorescence. Representative images with DRAQ5 nuclear staining (left) and quantification (right) are shown. Samples were analyzed as described in the legend to panel A. Bars, 20 μm. (G) Acid bypass of WSN(AS) in the presence of CCCP and amantadine. As schematically shown on the left, IAV was either left untreated (condition 1) or pretreated with amantadine (condition 2) or CCCP (condition 3) for 5 min at RT. When both drugs were combined (condition 4), virus was first treated with amantadine for 5 min to block M2 channels and then CCCP was added to the solution and the mixture was further incubated for 5 min. Drugs were present during the fusion step but excluded from subsequent incubation in stop medium. The acid-bypass infection assay was performed under the same conditions described for X31.
The role of core acidification and M2.
To test whether the elevation in infectivity after in vitro priming depended on M2, we used the adamantane derivative amantadine, a specific M2 channel blocker (7, 63, 64). Since IAV strains X31 and WSN are amantadine resistant, we utilized a recombinant, amantadine-sensitive H1N1 strain called WSN(AS) (previously described in reference 7). We confirmed that normal infection as well as acid-bypass infection of unprimed WSN(AS) was inhibited by amantadine, while WSN(wt) was unaffected (Fig. 3C).
When in vitro priming of WSN(AS) was performed in the presence of amantadine, infection after bypass was completely blocked, whereas primed WSN(wt) was not affected (Fig. 3D). This indicated that the elevation in infectivity caused by in vitro priming was, indeed, dependent on M2 and its channel activity.
To speed up the transfer of protons through the viral membrane and circumvent the requirement for M2, we tested the effect of the protonophore CCCP. This proton translocator enables H+ to cross lipid bilayers along their electrochemical gradient. We found that unprimed CCCP-loaded virus did not infect cells more efficiently via the normal endocytic route (data not shown). However, incorporation of the protonophore caused a dramatic increase (20-fold) in infectivity of unprimed X31 after acid bypass (Fig. 3E; compare conditions 1 and 3). The infectivity was twice the level obtained by normal entry of untreated IAV and about 60% higher than the infectivity obtained after bypass with primed IAV (Fig. 3E, condition 2). This was reflected in an elevated uncoating capacity, as observed by better M1 and NP accessibility to antibody staining in cells (Fig. 3F). No further increase in acid-bypass infectivity was observed when CCCP was combined with preacidification (Fig. 3E, condition 4).
With unprimed WSN(AS), the highest elevation in infectivity after bypass (17-fold) was reached when CCCP was employed in the absence of amantadine (compare conditions 1 and 3 in Fig. 3G). If M2 was blocked, the increase in infectivity dropped to 10-fold. This suggested that M2's role in the process extended beyond proton transport.
Taken together, the results indicated that in vitro priming increases IAV infection because it activates M2 and thus allows the conductance of protons through the viral membrane. If CCCP is present, core acidification is so fast that cores already become uncoating competent during the short pH drop during acid bypass.
K+ improves priming.
Up to this point, preacidification experiments were performed in buffered cell culture medium (DMEM), in which the monovalent cation composition corresponds to that in the extracellular fluid (120 mM NaCl, 5 mM KCl). As this buffer was not likely to represent ionic conditions inside LEs (65), we tested the effect of preincubation with different monovalent cations (Fig. 4A).
Preincubation in a pH 5.8 buffer with a high concentration of K+ (120 mM K+, 10 mM Na+) enhanced IAV infection to a level 2.5-fold over the level observed with DMEM-based buffer (Fig. 4A). This rise in infection was linear with increasing K+ concentration up to 120 mM (Fig. 4B). This was of interest because the lumenal concentration of K+ increases during endosome maturation, reaching values well over 50 mM in LEs and lysosomes (66). The boost induced by K+ was not due to the diminished concentration of Na+, as Cs+ and Li+ did not have the same effect as K+ (Fig. 4A).
Immunofluorescence assays indicated that the reason for the increased infectivity was, again, the improved efficiency in uncoating of the IAV core resulting in the more efficient nuclear import of vRNPs (Fig. 4F). The binding of virions to cells (Fig. 4C), conversion of HA to the acidic conformation (Fig. 4D), and acid-induced fusion efficiency at the PM (Fig. 4E) were not altered by pretreatment with a high K+ concentration.
Valinomycin increases acid-bypass infection.
To circumvent M2, we took advantage of valinomycin, an ionophore that shuttles K+ across membranes along its electrochemical gradient (67, 68). IAV was subjected to pH 5.8 priming in the presence and absence of valinomycin in buffers containing either a low (5 mM) or a high (120 mM) K+ concentration, followed by acid-bypass infection.
We found that valinomycin-treated viruses exposed to a high K+ concentration during priming were twice as infectious as control viruses primed in the absence of the ionophore (Fig. 4G). This shows that the flow of K+ through the viral membrane improved priming over and beyond the function of M2 as a cation carrier. For this to work optimally, the K+ concentration had to be high. At a low K+ concentration, the increase in infection was negligible.
Exposure to valinomycin and a high K+ concentration during priming without a drop in pH also resulted in high acid-bypass infectivity. Evidently, in this case, the increased permeability to K+ ions together with the short period of acidification during triggered fusion was enough to induce a primed state in the virus.
Using the WSN(AS) virus, we tested the effects of amantadine, CCCP, and valinomycin in different combinations (Fig. 4H). When M2 was inactivated by amantadine alone, there was no infectivity after priming (Fig. 4H, condition 1). Addition of valinomycin to the amantadine-inhibited viruses did not increase infectivity (Fig. 4H, condition 3). This indicated that the flux of K+ alone without an influx of protons does not induce priming. When CCCP was added in the presence of amantadine to allow proton conductance, only low infectivity was detected (Fig. 4H, condition 2). Thus, protons alone without K+ can induce some priming. However, addition of valinomycin to CCCP-containing viruses doubled the level of infectivity (Fig. 4H, condition 4). This confirmed that both H+ and K+ are needed for efficient priming. The result also showed that the M2 channel as such is not required for priming, provided that the conductance for the two cations is artificially supported by ionophores.
In the absence of amantadine, no infectivity was seen when the virus was acid fused at the PM without addition of ionophores (Fig. 4H, condition 5). Efficient acid-bypass infection was, however, observed when either CCCP or valinomycin was present alone (Fig. 4H, conditions 6 and 7). This suggested that the M2 channel could, in each case, provide the necessary conductivity for the second cation. When both CCCP and valinomycin were present together, infection increased further up to 30% (Fig. 4H, condition 8). In fact, it was higher than that when CCCP and valinomycin were present with amantadine. This implies that the M2 channel has some influence on priming even if the fluxes of K+ and H+ are mediated by the ionophores. A mild inhibitory effect of amantadine on IAV fusion kinetics (69–71) could explain this effect (Fig. 4H, condition 4). CCCP, valinomycin, or a combination of both did not increase the normal level of IAV infection (data not shown).
Our data indicated that not only the pH but also the K+ concentration affected the priming of IAV. K+ had no effect by itself, but when it was combined with a low pH, it doubled the efficiency of core uncoating. The conductance of both H+ and K+ was mediated by the M2 channel unless ionophores were present.
Changes in core stability.
A glycerol gradient centrifugation method has been used previously to provide information about the IAV core and its stability (26). The gradient contains a nonionic detergent (NP-40) to remove the viral membrane by solubilization as the virus sediments toward the bottom. Analysis of pellets from such gradients allowed Zhirnov to conclude that the core of WSN is a stable structure and that exposure to a pH below 6.0 causes the dissociation of M1 (26).
We adapted this method to X31 and WSN viruses (Fig. 5) and studied the effect of acidification in the presence and absence of KCl and NaCl. First, we tested pH values between 7.4 and 5.0 in the presence of 135 mM NaCl (Fig. 5A). SDS-PAGE of the pellets confirmed that as long as the pH remained above 6.4, M1 and vRNPs held together, even though the membrane of the virus had been removed (Fig. 5A and B). M1 was gradually lost from the sedimenting cores as pH values reached 5.8 and lower. Below pH 5.6, the vRNPs (NP and the viral polymerase subunit PB2 were analyzed) were lost from the pellet, indicating a second dissociation step involving the viral nucleocapsids. Applying this procedure to purified WSN showed a similar result (Fig. 5C). At pH 5.5, most of the M1 and NP dissociated from the sedimenting cores.
When NaCl was exchanged for KCl in the gradient solutions, the pellets showed that the majority of the cores remained intact, as long as the pH was neutral (Fig. 5D and E). However, a clear difference compared to NaCl emerged when the gradient pH was lowered to 5.8. In the KCl-containing gradients, only 15% of M1 and 20% of NP were present in the pellet. The corresponding values were 40% and 75% in NaCl-containing gradients. Thus, at mildly acidic pH, KCl dissociated the cores more efficiently than NaCl. Our results showed not only that the presence of KCl increased the potency of core disassembly but also that it had its main effect on the second disassembly step, the step involving vRNP interactions.
The concentration dependence of K+-induced core disassembly at pH 5.8 was tested using mixtures of NaCl and KCl (Fig. 5F and G). It was found that 50 mM KCl was sufficient to cause 80% dissociation of M1 from viral cores, whereas 100 to 135 mM KCl was needed to achieve the same degree of vRNP disassembly.
Taken together, the gradient analysis confirmed that the core of IAV (X31 and WSN) can exist as an intact structure in the absence of the viral envelope. A mildly acidic pH and a low K+ concentration, like those used for priming, caused a weakening of M1-vRNP interactions. At a lower pH, a change in vRNP sedimentation provided evidence for a further alteration probably involving a loss of interactions between vRNPs. The second dissociation step was enhanced by the presence of a high K+ concentration.
M1 and NP are more susceptible to proteolytic cleavage after priming.
To gain more insight into possible conformational changes in M1 and NP, we applied limited proteolysis (LiP). After solubilization, in vitro acid-primed and unprimed X31 viruses were digested with trypsin at neutral pH and RT. Complete degradation of M1 was more rapid when virions were preacidified, as detected by Western blot analysis (Fig. 6A). Combination of LiP with targeted MS (LC-SRM/MS) analysis (Fig. 6B), as recently applied for the whole yeast (i.e., Saccharomyces cerevisiae) proteome (49), enabled us to perform a more detailed and quantitative analysis of the priming effect. Here, solubilized in vitro-primed and unprimed X31 viruses were briefly digested with PK at neutral pH and RT, followed by MS-based quantitation of tryptic peptides derived from three viral proteins (M1, NP, and HA). A ratio of the abundance of quantified peptides was obtained by comparing acid-primed viruses to unprimed viruses (Fig. 6C; see also Table S1 in the supplemental material).
FIG 6.

Structural transitions of virion-derived IAV core proteins following priming probed by LiP. (A) Trypsin (Tryp.)-based LiP of mildly acidified X31 virions. X31 was pretreated at pH 7.4 and 5.8 for 1 h at 37°C, neutralized, and lysed with 0.1% Triton X-100 (Tx-100; 20 min at RT). Control samples were left unlysed. Trypsin was added at a ratio of 1:4 (trypsin/M1), and the mixture was incubated at RT for the indicated times. The reaction was stopped by addition of reducing SDS sample buffer containing 2 mM PMSF. Samples were resolved by SDS-PAGE and analyzed for M1 tryptic cleavage by Western blot analysis, using a monoclonal antibody against M1 (HB-64). (B) Schematic representation of LiP-SRM work flow applied to X31. Primed and unprimed virus samples were neutralized and lysed with 0.1% NP-40 (20 min at RT). LiP was performed with PK for 5 min at an enzyme/substrate ratio of 1:100. Samples were subsequently denatured and trypsinized for LC-SRM/MS analysis. The tryptic peptide intensities of primed and unprimed samples were compared. (C) Differences in susceptibility to PK cleavage are reflected by the fold changes of quantified LiP peptides from M1, NP, and HA between preacidified virus (pH 5.8, 60 min, 37°C) and control virus (pH 7.4). x axis, log2(fold change); y axis, −log10(P value). P values were obtained with three technical replicates per condition. Fold changes of >2 with a P value of <0.01 were considered significant. (D, E) Mapping of LiP peptides onto the sequence of M1 (D, bottom) and schematic visualization of PK cleavage sites in M1 (D, top) and NP (E). Triangles indicate the sites (based on LiP analysis) where a significant increase in PK cleavage was observed for preacidified virus. (F) Differences in susceptibility to PK cleavage are reflected by the fold changes of peptides quantified from M1, NP, and HA between virus preacidified in 5 mM K+ (low K+ concentration) and virus preacidified in 120 mM K+ (high K+ concentration). The same setup from panel A was adapted. (G) (Bottom) Mapping of peptides onto the sequence of M1. (Top) Triangles indicate the sites (based on LiP analysis) where an increase in PK cleavage was observed for virus treated with 120 mM K+ at pH 5.8. (D, E, and G) The schematic domain organizations of the viral proteins M1 and NP are shown. Binding sites reported for other viral components are indicated. NLS, nuclear localization signal.
For M1, approximately 70% sequence coverage was achieved by quantifying 12 LiP peptides, of which 3 were found to have significantly lower intensities after acid priming (Fig. 6C and D). All three peptides were mapped to areas inside or flanking the linker region between the N- and C-terminal domains (Fig. 6D). Four NP-derived peptides with lower intensities were identified when virions were primed (Fig. 6E), whereas for HA, no major changes occurred, as expected at pH 5.8. The increase in the PK susceptibility of M1 and NP upon priming most likely resulted from irreversible changes in conformation or protein-protein/protein-RNA interactions after exposure to low pH.
Next, we assessed the influence of K+ (Fig. 6F and G). Virus was preacidified in the presence of low (5 mM) and high (120 mM) K+ concentrations. Two additional regions in M1 were found to be more efficiently cleaved by PK. Compared to the results obtained with priming at a low K+ concentration, the linker region was even more susceptible to proteolysis (Fig. 6G, purple arrowhead). In addition, a new cleavage site was detected in the C-terminal end of M1, a region that has been suggested to bind to vRNPs (29, 72) (Fig. 6G, yellow arrowhead). No additional changes were detected for NP and HA (see Table S1 in the supplemental material).
The K+ concentration increases along the endocytic pathway.
We took advantage of the K+-specific fluorescent probe APG3 to test whether late endosomal compartments had high K+ concentrations. APG3 has previously been applied to monitor cytoplasmic K+ concentrations (73). By adding the membrane-impermeant salt version to the medium for 30 min, we were able to load endosomal compartments, as detected by live confocal microscopy (Fig. 7A). Increased green fluorescence was found in vesicular structures in the perinuclear cytoplasm. The APG3-derived fluorescence colocalized with fluorescently labeled EGF 60 to 70 min after internalization (Fig. 7A). At this time point, EGF is typically found in LEs in A549 cells (55).
FIG 7.
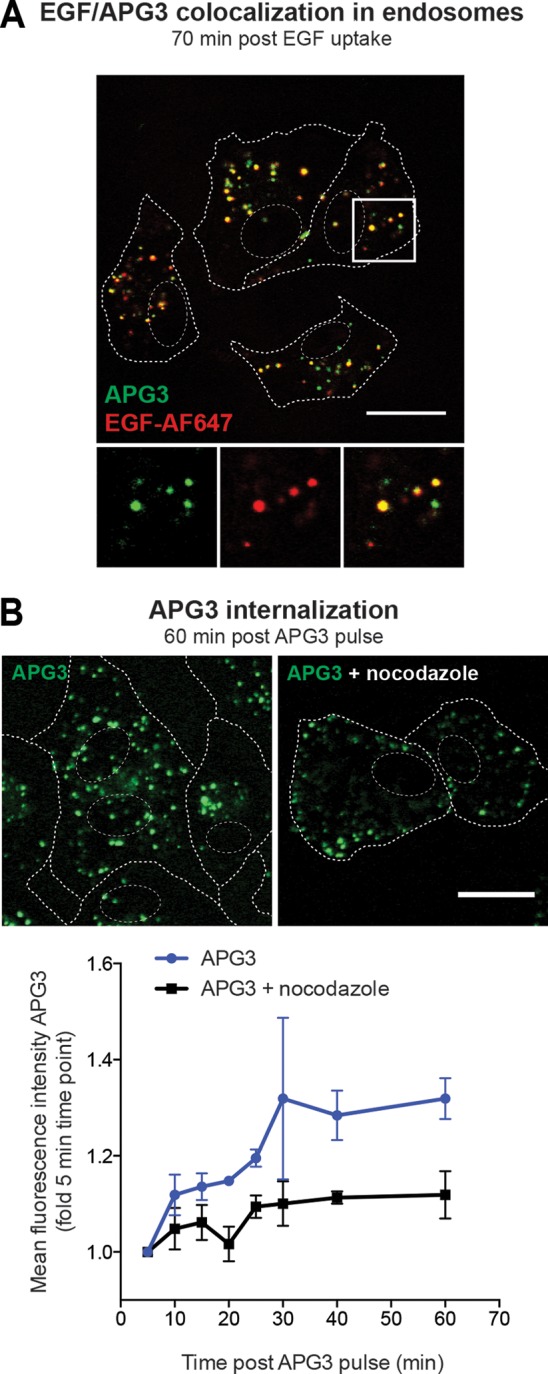
Increased fluorescence of the K+-sensitive dye APG3 in LEs. (A) Loading of endosomes with APG3. A549 cells were serum starved for 4 h prior to EGF-AF647 (200 ng/ml) binding on ice for 30 min. Cells were then washed with growth medium and loaded for 30 min with APG3 at 37°C (APG3 pulse). Live cells were imaged with a confocal microscope. EGF-AF647 signal was false colored to red for better visualization of the resulting yellow colocalization signal. (B) APG3 fluorescence upon internalization over time. Cells were loaded with APG3 as described in the legend to panel A. Following 30 min incubation with the dye, the cells were washed, transferred to the microscope, and imaged at the indicated time points. In the case of nocodazole treatment, cells were incubated in the presence of the drug together with APG3 for 30 min, followed by exchange to fresh nocodazole-containing medium for the imaging time. (Top) Representative images for both conditions at 60 min after the APG3 pulse; (bottom) mean fluorescence intensities at the indicated time points after APG3 loading were determined with ImageJ-based quantification. (A, B) Cell borders and nuclei were determined in transmission mode and are indicated as dashed lines in the images. Bars, 20 μm.
In order to test whether APG3 and, thus, K+ levels increase along the endocytic pathway, we measured the vesicular APG3 mean fluorescence intensity over time after exposing the cells to the probe. Intensities increased up to 30 min following APG3 uptake, indicating an increase of the intraluminal K+ concentration (Fig. 7B). When cells were treated with the microtubule-disrupting agent nocodazole, which inhibits the maturation of endosomes (74, 75), APG3-containing vesicles mainly localized to the periphery of the cell. APG3 fluorescence was further reduced by half compared to that for untreated cells (Fig. 7B). We concluded that LEs in A549 cells are enriched in K+.
DISCUSSION
Viral particles are held together by a network of interactions that connect the various components. These interactions determine the architecture and composition of the particle and ensure stability during the extracellular phase of the infectious cycle. After entry into new host cells, some of them must be eliminated to release the genome for replication and transcription. For many viruses, uncoating is a complicated process triggered by cellular receptors, chaperones, proteolytic enzymes, and changes in pH (76, 77).
To render the IAV core uncoating competent, our results provide evidence for a stepwise process that depends on the M2 channel and the conductance of protons as well as K+ ions. The core is stabilized by interactions that connect components of the envelope, the M1 shell, and the vRNPs with each other. Priming is initiated when the incoming virus encounters a pH of 6.5 (or lower) in early endosomes (EEs) or early macropinosomes. M2 is activated and protons begin to enter the virus through the previously ion-impermeable envelope membrane (22, 25).
We found that unprimed viruses were unable to uncoat efficiently and infect cells after fusion with the PM, whereas optimal priming in vitro resulted in a dramatically elevated efficiency of core uncoating, vRNP import into the nucleus, and infectivity. At that time, infection levels equaled or surpassed the level observed for viruses entering via the normal endocytosis route. The increase was inhibited by the M2 blocker amantadine when WSN(AS) was used, and the inhibition could be circumvented by the addition of proton and K+ ionophores.
Our results showed that priming occurred relatively slowly after exposure of IAV to low pH. At pH 6.4, the half-time of in vitro priming was 20 min under low-K+-concentration conditions; at pH 5.8 it was 10 min. The slow response was likely caused by the properties of the M2 channel and by the generation of a positive inner membrane potential. The flux of protons through the M2 channel is slow compared to that through most other ion channels (37, 78, 79). In fact, it is evident that M2 shares many properties with ion transporters (reviewed in references 36 and 37). How many protons are needed for priming is not known, but it has been estimated that the viral core contains about 31,000 titratable groups (78). Proton conductance measurements of M2 reconstituted in liposomes have shown a transport rate of 10 protons/s/channel at pH 6.0 (79). Considering that one virion contains 4 to 16 M2 channels (80), this could result in a core acidification time of 3 to 12 min.
As the positive inner membrane potential builds up, the influx of protons is likely to slow down. It was recently shown that efficient acidification of the lumen of M2-containing liposomes is possible only due to M2-mediated efflux of K+ (or Na+) through the M2 channel (38). Once it is activated by protons, M2 supports the conductance of K+ and Na+, although with an efficiency 10−5 to 10−6 lower than that for protons (32–35). In the case of the intact virus, this may mean that the cytosolic K+ ions trapped at a free concentration of 120 mM inside the virus during budding may be exchanged for protons.
Our uncoating assay monitored the distribution of M1 and NP throughout the cytosol and nucleoplasm. A dramatic increase in the immunostaining of both M1 and NP occurs due to the increased exposure of epitopes (20, 46). After acid-bypass fusion with primed viruses, a similar uncoating process rapidly occurred. In contrast, when the viruses used in acid-bypass experiments were unprimed, the M1 and vRNPs in most of the cells remained together in small spots in the cell periphery. Cytosolic, PM-associated core structures were detected by thin-section EM. It was apparent that brief acidification could induce bypass fusion, but the cores did not dissociate from the PM, and M1 and vRNPs remained associated with each other.
The difference between primed and unprimed IAV was consistent with the results from in vitro experiments indicating a difference in core structure. We confirmed previous observations by Zhirnov (26) that the exposure of cores to a pH of about 6.0 results in a weakening of M1-vRNP and, probably, M1-M1 associations. At pH 5.8 (and lower), the remaining interactions between vRNPs were compromised. Using LiP, we found, moreover, that exposure of IAV to pH 5.8 in a low-K+-concentration buffer resulted in irreversible changes at the C terminus of M1. This was in agreement with previous data indicating that while the N-terminal part of M1 does not change after acidification (81), a peptide corresponding to a sequence linking the N- and C-terminal domains (residues 139 to 166) undergoes a conformational change in vitro. With a midpoint of pH 5.9, it transitions from a partially unfolded form to an α-helical form (82). Our LiP analysis of the full-length, virus-derived M1 demonstrated changes in the same linker as well as in flanking sequences. It is possible that protonation of a highly conserved Zn finger-like Cys2His2 motif in the linker causes a change in interactions between the N- and C-terminal domains of M1. Recent atomic force microscopy studies showed that mild acid exposure makes IAV particles more easily deformed by physical force, confirming that the core loses part of its rigidity during priming (83). A two-step model was formulated, in which the first phase (pH 7.5 to 6.0) mainly involves an HA-dependent molecular change. In the second phase (pH <6.0), interactions involving M1 and vRNPs are affected. In agreement with our results, Li et al. (83) showed that softening of the virion in the first step appeared to be reversible by neutralization, whereas the effects at pH 5.5 and lower were irreversible.
Given that the C-terminal M1 interacts with vRNPs (29, 72), it is possible that a conformational change in the linker region of M1 affects M1-vRNP interactions. We found that preacidification rendered NP more accessible to proteolysis, especially in the vicinity of the putative RNA-binding groove. Changes in the proteolytic accessibility of NP upon priming could be due to either the release of M1 from the vRNPs or rearrangements within the vRNP bundle.
As the HA-mediated fusion occurs about 60 min after IAV endocytosis in A549 cells (46), the endocytic vacuoles that contain IAV have time to undergo maturation from early to late forms and to move from the cell periphery to the perinuclear region (84). In addition to gradual acidification, the incoming IAV is exposed to a 10-fold or higher elevation in the concentration of lumenal K+ and a corresponding drop in the Na+ concentration (66). Our results indicated that the increased K+ concentration played a role in IAV priming. Despite M2's poor K+ conductivity, the high concentration (10−1 M K+) makes an inward flux of K+ late in the endocytic pathway a relevant possibility. Like the efflux of K+ during initial proton-mediated priming in EEs (38), an influx of K+ is likely to occur when the virus reaches late endosomal compartments. While exposure to K+ alone (even in the presence of valinomycin) did not promote priming, the combination of low pH and a high K+ concentration did. It increased uncoating and infectivity by more than 2-fold over that at low pH alone. It was therefore apparent that exposure to a high K+ concentration had to occur concomitantly with or after acidification.
After treatment of solubilized viruses with a low pH and a high K+ concentration, our LiP results revealed additional changes in the C-terminal part of M1. Such changes were not observed in NP, which might be due to the low sequence coverage (40%) in MS measurement achieved. Gradient centrifugation experiments indicated that interactions connecting vRNPs were weakened. In this setup, it was difficult to distinguish whether the remaining M1 was lost from compact bundles of vRNPs or whether the vRNPs in the bundles were dissociated from each other. It has been suggested that M1 exists in two different populations (4). This opens the possibility that one population connects vRNPs to each other, in which case the K+ might weaken the remaining M1-vRNP associations. On the other hand, recent studies revealed in the 8 different vRNPs specific RNA packaging sequences through which the viral RNA segments may interact directly with each other (85–88). The K+ ions may induce weakening of these contacts because K+ is known to affect the secondary structure of single-stranded RNAs in multiple ways (30).
When the bypass approach has been tested for acid-activated enveloped viruses, fusion has been found to be efficient but infection has generally been found to be poor. Neither fowl plague virus (a highly pathogenic H7N1 avian influenza virus) nor VSV was, for example, found to infect MDCK cells after acid bypass (10). When SFV was tested in BHK-21 cells, infection was efficient, but it was strongly reduced in CHO cells (50, 89). The poor efficiency of infection after acid bypass can have several reasons. One is inefficient uncoating, as observed here for IAV in A459 cells. It is due to the lack of proper capsid priming. Another possibility that has been discussed involves the actin cortex, which can limit the movement of penetrated capsids deeper into the cytosol (90). The effectiveness of such a barrier function may be cell type dependent and may therefore explain the differences observed between cell lines.
IAV is probably not the only virus that requires core priming in endosomes. Mire and colleagues have provided evidence that the dissociation of VSV core proteins occurs in a similar, low-pH-dependent manner (91). Here, glycoprotein G was found to be required for efficient acidification of the viral interior. In a follow-up study, the VSV matrix protein (M) was described to exist in two populations: a membrane-associated form and an RNP-associated form (92). While the membrane-associated M remains at endosomal membranes after fusion, the second population travels to the nuclear pore complexes. Similarly, vaccinia virus (VACV) infectivity was found to be enhanced upon pretreatment of the virus at low pH prior to cell adsorption and endocytosis (93). Schmidt and colleagues have recently provided evidence for the existence of a viroporin in VACV particles which coordinates the translocation of protons into the virion, as studied in a single-virus fusion setup (94). That UUKV infection appears to be expedited when the endocytic uptake is bypassed may be explained by the absence of a matrix protein layer in the core of UUKV particles.
Taken together, our studies suggest a two-step priming process for IAV. The first involves exposure of the incoming virus to a pH in the range of 6.5 to 6.0 in the low-K+-concentration/high-Na+-concentration milieu of EEs. It causes the activation of M2, and the flux of protons into the virus is supported by the efflux of K+. This induces weakening of M1-M1 and M1-vRNP interactions. A second change occurs later in the endocytic pathway, when the pH drops into the 6.0 to 5.4 range and the high Na+ concentration present in EE is replaced by a high K+ concentration. Additional changes in core conformation take place, allowing the subsequent dissociation of the vRNP bundle.
Our observations provide the first indication that incoming viruses may respond not only to low pH but also to other ions present in the lumen of endocytic vacuoles. This could provide an explanation of previous reports indicating that for a virus like IAV, endocytosis and acidification alone are not sufficient to support efficient infection and uncoating (55, 95–97). Several cellular K+ channels have been listed among the hits in small interfering RNA screens of cell proteins that support IAV infection (98, 99). K+ makes sense as a late cue for uncoating because it is the most abundant intracellular cation and its concentration in LEs/lysosomes is high. Whether the so-called viroporins of other viruses mediate similar capsid-associated priming events remains to be seen. Some of them, including the 3a and E proteins of severe acute respiratory syndrome (SARS) coronavirus, the 6K protein of alphaviruses, and the Vpu of human immunodeficiency virus type 1 (HIV-1), have been shown to conduct K+ (reviewed in references 100 and 101). For a better understanding of virus entry and novel antiviral strategies, it will be important to analyze the physiology of endocytic vacuoles and their maturation in more detail.
Supplementary Material
ACKNOWLEDGMENTS
We are grateful to Yohei Yamauchi and Jatta Huotari for critical readings of the manuscript. We thank Roberta Mancini for help with electron microscopy and Florian Schmidt with the IAV fusion kinetics assay. We are also thankful to Giuseppe Balistreri for providing us with stocks of SFV-ZsGreen and Roger Meier for UUKV stocks and antibodies. We acknowledge Thomas Heger for providing us with the infection counter algorithm, Peter Horvath for help with the colocalization analysis, and members of the A. Helenius group for helpful discussions. We acknowledge support by the Scientific Center for Optical and Electron Microscopy at ETH Zurich.
The A.H. laboratory was supported by the Marie Curie Initial Training Networks (ITN) and by the Swiss National Science Foundation (Sinergia). P.P. is supported by a Foerderungsprofessur grant from the Swiss National Science Foundation (grant PP00P3_133670), by an EU Seventh Framework Program Reintegration grant (FP7-PEOPLE-2010-RG-277147), by an FP7-ERC starting grant (337965-ProteoToxNet), and by a Promedica Stiftung (grant 2-70669-11). Y.F. is supported by an ETH research grant (grant 4412-1).
Footnotes
Published ahead of print 27 August 2014
Supplemental material for this article may be found at http://dx.doi.org/10.1128/JVI.01430-14.
REFERENCES
- 1.Taubenberger JK, Kash JC. 2010. Influenza virus evolution, host adaptation, and pandemic formation. Cell Host Microbe 7:440–451. 10.1016/j.chom.2010.05.009. [DOI] [PMC free article] [PubMed] [Google Scholar]
- 2.Calder LJ, Wasilewski S, Berriman JA, Rosenthal PB. 2010. Structural organization of a filamentous influenza A virus. Proc. Natl. Acad. Sci. U. S. A. 107:10685–10690. 10.1073/pnas.1002123107. [DOI] [PMC free article] [PubMed] [Google Scholar]
- 3.Noton SL, Medcalf E, Fisher D, Mullin AE, Elton D, Digard P. 2007. Identification of the domains of the influenza A virus M1 matrix protein required for NP binding, oligomerization and incorporation into virions. J. Gen. Virol. 88:2280–2290. 10.1099/vir.0.82809-0. [DOI] [PMC free article] [PubMed] [Google Scholar]
- 4.Ruigrok RW, Barge A, Durrer P, Brunner J, Ma K, Whittaker GR. 2000. Membrane interaction of influenza virus M1 protein. Virology 267:289–298. 10.1006/viro.1999.0134. [DOI] [PubMed] [Google Scholar]
- 5.Sha BD, Luo M. 1997. Structure of a bifunctional membrane-RNA binding protein, influenza virus matrix protein M1. Nat. Struct. Biol. 4:239–244. 10.1038/nsb0397-239. [DOI] [PubMed] [Google Scholar]
- 6.Bui M, Whittaker G, Helenius A. 1996. Effect of M1 protein and low pH on nuclear transport of influenza virus ribonucleoproteins. J. Virol. 70:8391–8401. [DOI] [PMC free article] [PubMed] [Google Scholar]
- 7.Martin K, Helenius A. 1991. Nuclear transport of influenza virus ribonucleoproteins: the viral matrix protein (M1) promotes export and inhibits import. Cell 67:117–130. 10.1016/0092-8674(91)90576-K. [DOI] [PubMed] [Google Scholar]
- 8.Skehel JJ, Wiley DC. 2000. Receptor binding and membrane fusion in virus entry: the influenza hemagglutinin. Annu. Rev. Biochem. 69:531–569. 10.1146/annurev.biochem.69.1.531. [DOI] [PubMed] [Google Scholar]
- 9.de Vries E, Tscherne DM, Wienholts MJ, Cobos-Jimenez V, Scholte F, Garcia-Sastre A, Rottier PJ, de Haan CA. 2011. Dissection of the influenza A virus endocytic routes reveals macropinocytosis as an alternative entry pathway. PLoS Pathog. 7:e1001329. 10.1371/journal.ppat.1001329. [DOI] [PMC free article] [PubMed] [Google Scholar]
- 10.Matlin KS, Reggio H, Helenius A, Simons K. 1981. Infectious entry pathway of influenza virus in a canine kidney cell line. J. Cell Biol. 91:601–613. 10.1083/jcb.91.3.601. [DOI] [PMC free article] [PubMed] [Google Scholar]
- 11.Patterson S, Oxford JS, Dourmashkin RR. 1979. Studies on the mechanism of influenza virus entry into cells. J. Gen. Virol. 43:223–229. 10.1099/0022-1317-43-1-223. [DOI] [PubMed] [Google Scholar]
- 12.Rust MJ, Lakadamyali M, Zhang F, Zhuang X. 2004. Assembly of endocytic machinery around individual influenza viruses during viral entry. Nat. Struct. Mol. Biol. 11:567–573. 10.1038/nsmb769. [DOI] [PMC free article] [PubMed] [Google Scholar]
- 13.Sieczkarski SB, Whittaker GR. 2002. Dissecting virus entry via endocytosis. J. Gen. Virol. 83:1535–1545. 10.1128/JVI.76.20.10455-10464.2002. [DOI] [PubMed] [Google Scholar]
- 14.Yoshimura A, Ohnishi S. 1984. Uncoating of influenza virus in endosomes. J. Virol. 51:497–504. [DOI] [PMC free article] [PubMed] [Google Scholar]
- 15.Sieczkarski SB, Whittaker GR. 2003. Differential requirements of Rab5 and Rab7 for endocytosis of influenza and other enveloped viruses. Traffic 4:333–343. 10.1034/j.1600-0854.2003.00090.x. [DOI] [PubMed] [Google Scholar]
- 16.Lakadamyali M, Rust MJ, Babcock HP, Zhuang X. 2003. Visualizing infection of individual influenza viruses. Proc. Natl. Acad. Sci. U. S. A. 100:9280–9285. 10.1073/pnas.0832269100. [DOI] [PMC free article] [PubMed] [Google Scholar]
- 17.White J, Kartenbeck J, Helenius A. 1982. Membrane-fusion activity of influenza virus. EMBO J. 1:217–222. [DOI] [PMC free article] [PubMed] [Google Scholar]
- 18.Yoshimura A, Kuroda K, Kawasaki K, Yamashina S, Maeda T, Ohnishi S-I. 1982. Infectious cell entry mechanism of influenza virus. J. Virol. 43:284–293. [DOI] [PMC free article] [PubMed] [Google Scholar]
- 19.Palese P, Shaw ML. 2007. Orthomyxoviridae: the viruses and their replication, p 1647–1690 In Knipe DM, Howley PM, Griffin DE, Lamb RA, Martin MA, Roizman B, Straus SE. (ed), Fields virology, 5th ed. Lippincott Williams & Wilkins, Philadelphia, PA. [Google Scholar]
- 20.Martin K, Helenius A. 1991. Transport of incoming influenza virus nucleocapsids into the nucleus. J. Virol. 65:232–244. [DOI] [PMC free article] [PubMed] [Google Scholar]
- 21.Chou Y-Y, Heaton NS, Gao Q, Palese P, Singer R, Lionnet T. 2013. Colocalization of different influenza viral RNA segments in the cytoplasm before viral budding as shown by single-molecule sensitivity FISH analysis. PLoS Pathog. 9:e1003358. 10.1371/journal.ppat.1003358. [DOI] [PMC free article] [PubMed] [Google Scholar]
- 22.Helenius A. 1992. Unpacking the incoming influenza virus. Cell 69:577–578. 10.1016/0092-8674(92)90219-3. [DOI] [PubMed] [Google Scholar]
- 23.Pinto LH, Holsinger LJ, Lamb RA. 1992. Influenza virus M2 protein has ion channel activity. Cell 69:517–528. 10.1016/0092-8674(92)90452-I. [DOI] [PubMed] [Google Scholar]
- 24.Lamb RA, Zebedee SL, Richardson CD. 1985. Influenza virus M2 protein is an integral membrane protein expressed on the infected-cell surface. Cell 40:627–633. 10.1016/0092-8674(85)90211-9. [DOI] [PubMed] [Google Scholar]
- 25.Hong M, DeGrado WF. 2012. Structural basis for proton conduction and inhibition by the influenza M2 protein. Protein Sci. 21:1620–1633. 10.1002/pro.2158. [DOI] [PMC free article] [PubMed] [Google Scholar]
- 26.Zhirnov OP. 1990. Solubilization of matrix protein M1/M from virions occurs at different pH for orthomyxo- and paramyxoviruses. Virology 176:274–279. 10.1016/0042-6822(90)90253-N. [DOI] [PubMed] [Google Scholar]
- 27.Zoueva OP, Bailly JE, Nicholls R, Brown EG. 2002. Aggregation of influenza virus ribonucleocapsids at low pH. Virus Res. 85:141–149. 10.1016/S0168-1702(02)00028-X. [DOI] [PubMed] [Google Scholar]
- 28.Cheung TKW, Guan Y, Ng SSF, Chen H, Wong CHK, Peiris JSM, Poon LLM. 2005. Generation of recombinant influenza A virus without M2 ion-channel protein by introduction of a point mutation at the 5′ end of the viral intron. J. Gen. Virol. 86:1447–1454. 10.1099/vir.0.80727-0. [DOI] [PubMed] [Google Scholar]
- 29.Ye Z, Liu T, Offringa DP, McInnis J, Levandowski RA. 1999. Association of influenza virus matrix protein with ribonucleoproteins. J. Virol. 73:7467–7473. [DOI] [PMC free article] [PubMed] [Google Scholar]
- 30.Zhang K, Wang Z, Liu X, Yin C, Basit Z, Xia B, Liu W. 2012. Dissection of influenza A virus M1 protein: pH-dependent oligomerization of N-terminal domain and dimerization of C-terminal domain. PLoS One 7:e37786. 10.1371/journal.pone.0037786. [DOI] [PMC free article] [PubMed] [Google Scholar]
- 31.Fontana J, Steven AC. 2013. At low pH, influenza virus matrix protein M1 undergoes a conformational change prior to dissociating from the membrane. J. Virol. 87:5621–5628. 10.1128/JVI.00276-13. [DOI] [PMC free article] [PubMed] [Google Scholar]
- 32.Shimbo K, Brassard DL, Lamb RA, Pinto LH. 1996. Ion selectivity and activation of the M2 ion channel of influenza virus. Biophys. J. 70:1335–1346. 10.1016/S0006-3495(96)79690-X. [DOI] [PMC free article] [PubMed] [Google Scholar]
- 33.Mustafa M, Henderson DJ, Busath DD. 2009. Free-energy profiles for ions in the influenza M2-TMD channel. Proteins 76:794–807. 10.1002/prot.22376. [DOI] [PMC free article] [PubMed] [Google Scholar]
- 34.Mould JA, Drury JE, Frings SM, Kaupp UB, Pekosz A, Lamb RA, Pinto LH. 2000. Permeation and activation of the M2 ion channel of influenza A virus. J. Biol. Chem. 275:31038–31050. 10.1074/jbc.M003663200. [DOI] [PubMed] [Google Scholar]
- 35.Mould JA, Li H-C, Dudlak CS, Lear JD, Pekosz A, Lamb RA, Pinto LH. 2000. Mechanism for proton conduction of the M2 ion channel of influenza A virus. J. Biol. Chem. 275:8592–8599. 10.1074/jbc.275.12.8592. [DOI] [PubMed] [Google Scholar]
- 36.Busath DD. 2009. Chapter 7. Influenza A M2: channel or transporter?, p 161–201 In Liu AL, Iglic A. Advances in planar lipid bilayers and liposomes, vol 10 Academic Press, New York, NY. [Google Scholar]
- 37.Grigoryan G, Moore DT, DeGrado WF. 2011. Transmembrane communication: general principles and lessons from the structure and function of the M2 proton channel, K+ channels, and integrin receptors. Annu. Rev. Biochem. 80:211–237. 10.1146/annurev-biochem-091008-152423. [DOI] [PMC free article] [PubMed] [Google Scholar]
- 38.Leiding T, Wang J, Martinsson J, DeGrado WF, Arskold SP. 2010. Proton and cation transport activity of the M2 proton channel from influenza A virus. Proc. Natl. Acad. Sci. U. S. A. 107:15409–15414. 10.1073/pnas.1009997107. [DOI] [PMC free article] [PubMed] [Google Scholar]
- 39.Spuul P, Balistreri G, Kääriäinen L, Ahola T. 2010. Phosphatidylinositol 3-kinase-, actin-, and microtubule-dependent transport of Semliki Forest virus replication complexes from the plasma membrane to modified lysosomes. J. Virol. 84:7543–7557. 10.1128/JVI.00477-10. [DOI] [PMC free article] [PubMed] [Google Scholar]
- 40.Pettersson R, Kääriäinen L. 1973. The ribonucleic acids of Uukuniemi virus, a noncubical tick-borne arbovirus. Virology 56:608–619. 10.1016/0042-6822(73)90062-7. [DOI] [PubMed] [Google Scholar]
- 41.Johannsdottir HK, Mancini R, Kartenbeck J, Amato L, Helenius A. 2009. Host cell factors and functions involved in vesicular stomatitis virus entry. J. Virol. 83:440–453. 10.1128/JVI.01864-08. [DOI] [PMC free article] [PubMed] [Google Scholar]
- 42.Peterson JR, Helenius A. 1999. In vitro reconstitution of calreticulin-substrate interactions. J. Cell Sci. 112:2775–2784. [DOI] [PubMed] [Google Scholar]
- 43.Boulay F, Doms RW, Wilson I, Helenius A. 1987. The influenza hemagglutinin precursor as an acid-sensitive probe of the biosynthetic pathway. EMBO J. 6:2643–2650. [DOI] [PMC free article] [PubMed] [Google Scholar]
- 44.Kartenbeck J, Stukenbrok H, Helenius A. 1989. Endocytosis of simian virus 40 into the endoplasmic reticulum. J. Cell Biol. 109:2721–2729. 10.1083/jcb.109.6.2721. [DOI] [PMC free article] [PubMed] [Google Scholar]
- 45.Sakai T, Ohuchi M, Imai M, Mizuno T, Kawasaki K, Kuroda K, Yamashina S. 2006. Dual wavelength imaging allows analysis of membrane fusion of influenza virus inside cells. J. Virol. 80:2013–2018. 10.1128/JVI.80.4.2013-2018.2006. [DOI] [PMC free article] [PubMed] [Google Scholar]
- 46.Banerjee I, Yamauchi Y, Helenius A, Horvath P. 2013. High-content analysis of sequential events during the early phase of influenza A virus infection. PLoS One 8:e68450. 10.1371/journal.pone.0068450. [DOI] [PMC free article] [PubMed] [Google Scholar]
- 47.Engel S, Heger T, Mancini R, Herzog F, Kartenbeck J, Hayer A, Helenius A. 2011. Role of endosomes in simian virus 40 entry and infection. J. Virol. 85:4198–4211. 10.1128/JVI.02179-10. [DOI] [PMC free article] [PubMed] [Google Scholar]
- 48.Meier R, Franceschini A, Horvath P, Tetard M, Mancini R, von Mering C, Helenius A, Lozach P-Y. 2014. Genome-wide small interfering RNA screens reveal VAMP3 as a novel host factor required for Uukuniemi virus late penetration. J. Virol. 88:8565–8578. 10.1128/JVI.00388-14. [DOI] [PMC free article] [PubMed] [Google Scholar]
- 49.Feng Y, De Franceschi G, Kahraman A, Soste M, Melnik A, Boersema PJ, Polverino de Laureto PP, Nikolaev Y, Oliveira AP, Picotti P. 14 September 2014. Global analysis of protein structural changes in complex proteomes. Nat. Biotechnol. 10.1038/nbt.2999. [DOI] [PubMed] [Google Scholar]
- 50.Helenius A, Kartenbeck J, Simons K, Fries E. 1980. On the entry of Semliki Forest virus into BHK-21 cells. J. Cell Biol. 84:404–420. 10.1083/jcb.84.2.404. [DOI] [PMC free article] [PubMed] [Google Scholar]
- 51.White J, Matlin K, Helenius A. 1981. Cell fusion by Semliki Forest, influenza, and vesicular stomatitis viruses. J. Cell Biol. 89:674–679. 10.1083/jcb.89.3.674. [DOI] [PMC free article] [PubMed] [Google Scholar]
- 52.Blumenthal R, Gallo SA, Viard M, Raviv Y, Puri A. 2002. Fluorescent lipid probes in the study of viral membrane fusion. Chem. Phys. Lipids 116:39–55. 10.1016/S0009-3084(02)00019-1. [DOI] [PubMed] [Google Scholar]
- 53.Stegmann T, Morselt HWM, Scholma J, Wilschut J. 1987. Fusion of influenza virus in an intracellular acidic compartment measured by fluorescence dequenching. Biochim. Biophys. Acta 904:165–170. 10.1016/0005-2736(87)90100-3. [DOI] [PubMed] [Google Scholar]
- 54.Nussbaum O, Loyter A. 1987. Quantitative determination of virus-membrane fusion events. Fusion of influenza virions with plasma membranes and membranes of endocytic vesicles in living cultured cells. FEBS Lett. 221:61–67. 10.1016/0014-5793(87)80352-6. [DOI] [PubMed] [Google Scholar]
- 55.Huotari J, Meyer-Schaller N, Hubner M, Stauffer S, Katheder N, Horvath P, Mancini R, Helenius A, Peter M. 2012. Cullin-3 regulates late endosome maturation. Proc. Natl. Acad. Sci. U. S. A. 109:823–828. 10.1073/pnas.1118744109. [DOI] [PMC free article] [PubMed] [Google Scholar]
- 56.Yamauchi Y, Boukari H, Banerjee I, Sbalzarini IF, Horvath P, Helenius A. 2011. Histone deacetylase 8 is required for centrosome cohesion and influenza A virus entry. PLoS Pathog. 7:e1002316. 10.1371/journal.ppat.1002316. [DOI] [PMC free article] [PubMed] [Google Scholar]
- 57.Lozach P-Y, Mancini R, Bitto D, Meier R, Oestereich L, Overby AK, Pettersson RF, Helenius A. 2010. Entry of bunyaviruses into mammalian cells. Cell Host Microbe 7:488–499. 10.1016/j.chom.2010.05.007. [DOI] [PMC free article] [PubMed] [Google Scholar]
- 58.Korte T, Ludwig K, Booy FP, Blumenthal R, Herrmann A. 1999. Conformational intermediates and fusion activity of influenza virus hemagglutinin. J. Virol. 73:4567–4574. [DOI] [PMC free article] [PubMed] [Google Scholar]
- 59.Puri A, Booy FP, Doms RW, White JM, Blumenthal R. 1990. Conformational changes and fusion activity of influenza virus hemagglutinin of the H2 and H3 subtypes: effects of acid pretreatment. J. Virol. 64:3824–3832. [DOI] [PMC free article] [PubMed] [Google Scholar]
- 60.Doms RW, Helenius A, White J. 1985. Membrane fusion activity of the influenza virus hemagglutinin. The low pH-induced conformational change. J. Biol. Chem. 260:2973–2981. [PubMed] [Google Scholar]
- 61.Stegmann T, Booy FP, Wilschut J. 1987. Effects of low pH on influenza virus. Activation and inactivation of the membrane fusion capacity of the hemagglutinin. J. Biol. Chem. 262:17744–17749. [PubMed] [Google Scholar]
- 62.Galloway SE, Reed ML, Russell CJ, Steinhauer DA. 2013. Influenza HA subtypes demonstrate divergent phenotypes for cleavage activation and pH of fusion: implications for host range and adaptation. PLoS Pathog. 9:e1003151. 10.1371/journal.ppat.1003151. [DOI] [PMC free article] [PubMed] [Google Scholar]
- 63.Wang C, Takeuchi K, Pinto LH, Lamb RA. 1993. Ion channel activity of influenza A virus M2 protein: characterization of the amantadine block. J. Virol. 67:5585–5594. [DOI] [PMC free article] [PubMed] [Google Scholar]
- 64.Davies WL, Hoffmann CE, Paulshock M, Wood TR, Haff RF, Grunert RR, Watts JC, Hermann EC, Neumayer EM, McGahen JW. 1964. Antiviral activity of 1-adamantanamine (amantadine). Science 144:862–863. 10.1126/science.144.3620.862. [DOI] [PubMed] [Google Scholar]
- 65.Scott CC, Gruenberg J. 2011. Ion flux and the function of endosomes and lysosomes: pH is just the start. Bioessays 33:103–110. 10.1002/bies.201000108. [DOI] [PubMed] [Google Scholar]
- 66.Steinberg BE, Touret N, Vargas-Caballero M, Grinstein S. 2007. In situ measurement of the electrical potential across the phagosomal membrane using FRET and its contribution to the proton-motive force. Proc. Natl. Acad. Sci. U. S. A. 104:9523–9528. 10.1073/pnas.0700783104. [DOI] [PMC free article] [PubMed] [Google Scholar]
- 67.Rose MC, Henkens RW. 1974. Stability of sodium and potassium complexes of valinomycin. Biochim. Biophys. Acta 372:426–435. 10.1016/0304-4165(74)90204-9. [DOI] [Google Scholar]
- 68.Rose L, Jenkins ATA. 2007. The effect of the ionophore valinomycin on biomimetic solid supported lipid DPPTE/EPC membranes. Bioelectrochemistry 70:387–393. 10.1016/j.bioelechem.2006.05.009. [DOI] [PubMed] [Google Scholar]
- 69.Bron R, Kendal AP, Klenk HD, Wilschut J. 1993. Role of the M2 protein in influenza virus membrane fusion: effects of amantadine and monensin on fusion kinetics. Virology 195:808–811. 10.1006/viro.1993.1435. [DOI] [PubMed] [Google Scholar]
- 70.Wharton SA, Belshe RB, Skehel JJ, Hay AJ. 1994. Role of virion M2 protein in influenza virus uncoating: specific reduction in the rate of membrane fusion between virus and liposomes by amantadine. J. Gen. Virol. 75:945–948. 10.1099/0022-1317-75-4-945. [DOI] [PubMed] [Google Scholar]
- 71.Bonnafous P, Nicolaï M-C, Taveau J-C, Chevalier M, Barrière F, Medina J, Le Bihan O, Adam O, Ronzon F, Lambert O. 2014. Treatment of influenza virus with beta-propiolactone alters viral membrane fusion. Biochim. Biophys. Acta 1838:355–363. 10.1016/j.bbamem.2013.09.021. [DOI] [PubMed] [Google Scholar]
- 72.Baudin F, Petit I, Weissenhorn W, Ruigrok RWH. 2001. In vitro dissection of the membrane and RNP binding activities of influenza virus M1 protein. Virology 281:102–108. 10.1006/viro.2000.0804. [DOI] [PubMed] [Google Scholar]
- 73.Bittner S, Ruck T, Schuhmann MK, Herrmann AM, Moha ou Maati H, Bobak N, Gobel K, Langhauser F, Stegner D, Ehling P, Borsotto M, Pape H-C, Nieswandt B, Kleinschnitz C, Heurteaux C, Galla H-J, Budde T, Wiendl H, Meuth SG. 2013. Endothelial TWIK-related potassium channel-1 (TREK1) regulates immune-cell trafficking into the CNS. Nat. Med. 19:1161–1165. 10.1038/nm.3303. [DOI] [PubMed] [Google Scholar]
- 74.Bayer N, Schober D, Prchla E, Murphy RF, Blaas D, Fuchs R. 1998. Effect of bafilomycin A1 and nocodazole on endocytic transport in HeLa cells: implications for viral uncoating and infection. J. Virol. 72:9645–9655. [DOI] [PMC free article] [PubMed] [Google Scholar]
- 75.Vonderheit A, Helenius A. 2005. Rab7 associates with early endosomes to mediate sorting and transport of Semliki Forest virus to late endosomes. PLoS Biol. 3:e233. 10.1371/journal.pbio.0030233. [DOI] [PMC free article] [PubMed] [Google Scholar]
- 76.Greber UF, Singh I, Helenius A. 1994. Mechanisms of virus uncoating. Trends Microbiol. 2:52–56. 10.1016/0966-842X(94)90126-0. [DOI] [PubMed] [Google Scholar]
- 77.Yamauchi Y, Helenius A. 2013. Virus entry at a glance. J. Cell Sci. 126:1289–1295. 10.1242/jcs.119685. [DOI] [PubMed] [Google Scholar]
- 78.Ivanovic T, Rozendaal R, Floyd DL, Popovic M, van Oijen AM, Harrison SC. 2012. Kinetics of proton transport into influenza virions by the viral M2 channel. PLoS One 7:e31566. 10.1371/journal.pone.0031566. [DOI] [PMC free article] [PubMed] [Google Scholar]
- 79.Pielak RM, Chou JJ. 2010. Kinetic analysis of the M2 proton conduction of the influenza virus. J. Am. Chem. Soc. 132:17695–17697. 10.1021/ja108458u. [DOI] [PMC free article] [PubMed] [Google Scholar]
- 80.Zebedee SL, Lamb RA. 1988. Influenza A virus M2 protein: monoclonal antibody restriction of virus growth and detection of M2 in virions. J. Virol. 62:2762–2772. [DOI] [PMC free article] [PubMed] [Google Scholar]
- 81.Harris A, Forouhar F, Qiu S, Sha B, Luo M. 2001. The crystal structure of the influenza matrix protein M1 at neutral pH: M1-M1 protein interfaces can rotate in the oligomeric structures of M1. Virology 289:34–44. 10.1006/viro.2001.1119. [DOI] [PubMed] [Google Scholar]
- 82.Okada A, Miura T, Takeuchi H. 2003. Zinc- and pH-dependent conformational transition in a putative interdomain linker region of the influenza virus matrix protein M1. Biochemistry 42:1978–1984. 10.1021/bi027176t. [DOI] [PubMed] [Google Scholar]
- 83.Li S, Sieben C, Ludwig K, Höfer CT, Chiantia S, Herrmann A, Eghiaian F, Schaap IAT. 2014. pH-controlled two-step uncoating of influenza virus. Biophys. J. 106:1447–1456. 10.1016/j.bpj.2014.02.018. [DOI] [PMC free article] [PubMed] [Google Scholar]
- 84.Huotari J, Helenius A. 2011. Endosome maturation. EMBO J. 30:3481–3500. 10.1038/emboj.2011.286. [DOI] [PMC free article] [PubMed] [Google Scholar]
- 85.Gavazzi C, Yver M, Isel C, Smyth RP, Rosa-Calatrava M, Lina B, Moulès V, Marquet R. 2013. A functional sequence-specific interaction between influenza A virus genomic RNA segments. Proc. Natl. Acad. Sci. U. S. A. 110:16604–16609. 10.1073/pnas.1314419110. [DOI] [PMC free article] [PubMed] [Google Scholar]
- 86.Ozawa M, Maeda J, Iwatsuki-Horimoto K, Watanabe S, Goto H, Horimoto T, Kawaoka Y. 2009. Nucleotide sequence requirements at the 5′ end of the influenza A virus M RNA segment for efficient virus replication. J. Virol. 83:3384–3388. 10.1128/JVI.02513-08. [DOI] [PMC free article] [PubMed] [Google Scholar]
- 87.Marsh GA, Hatami R, Palese P. 2007. Specific residues of the influenza A virus hemagglutinin viral RNA are important for efficient packaging into budding virions. J. Virol. 81:9727–9736. 10.1128/JVI.01144-07. [DOI] [PMC free article] [PubMed] [Google Scholar]
- 88.Marsh GA, Rabadán R, Levine AJ, Palese P. 2008. Highly conserved regions of influenza A virus polymerase gene segments are critical for efficient viral RNA packaging. J. Virol. 82:2295–2304. 10.1128/JVI.02267-07. [DOI] [PMC free article] [PubMed] [Google Scholar]
- 89.Marsh M, Bron R. 1997. SFV infection in CHO cells: cell-type specific restrictions to productive virus entry at the cell surface. J. Cell Sci. 110:95–103. [DOI] [PubMed] [Google Scholar]
- 90.Grove J, Marsh M. 2011. The cell biology of receptor-mediated virus entry. J. Cell Biol. 195:1071–1082. 10.1083/jcb.201108131. [DOI] [PMC free article] [PubMed] [Google Scholar]
- 91.Mire CE, Dube D, Delos SE, White JM, Whitt MA. 2009. Glycoprotein-dependent acidification of vesicular stomatitis virus enhances release of matrix protein. J. Virol. 83:12139–12150. 10.1128/JVI.00955-09. [DOI] [PMC free article] [PubMed] [Google Scholar]
- 92.Mire CE, White JM, Whitt MA. 2010. A spatio-temporal analysis of matrix protein and nucleocapsid trafficking during vesicular stomatitis virus uncoating. PLoS Pathog. 6:e1000994. 10.1371/journal.ppat.1000994. [DOI] [PMC free article] [PubMed] [Google Scholar]
- 93.Townsley AC, Moss B. 2007. Two distinct low-pH steps promote entry of vaccinia virus. J. Virol. 81:8613–8620. 10.1128/JVI.00606-07. [DOI] [PMC free article] [PubMed] [Google Scholar]
- 94.Schmidt FI, Kuhn P, Robinson T, Mercer J, Dittrich PS. 2013. Single-virus fusion experiments reveal proton influx into vaccinia virions and hemifusion lag times. Biophys. J. 105:420–431. 10.1016/j.bpj.2013.06.016. [DOI] [PMC free article] [PubMed] [Google Scholar]
- 95.Sieczkarski SB, Brown HA, Whittaker GR. 2003. Role of protein kinase C βII in influenza virus entry via late endosomes. J. Virol. 77:460–469. 10.1128/JVI.77.1.460-469.2003. [DOI] [PMC free article] [PubMed] [Google Scholar]
- 96.Huotari J. 2010. Novel host cell factors required for influenza A virus entry. Ph.D. dissertation ETH, Zürich, Switzerland. [Google Scholar]
- 97.He J, Sun E, Bujny MV, Kim D, Davidson MW, Zhuang X. 2013. Dual function of CD81 in influenza virus uncoating and budding. PLoS Pathog. 9:e1003701. 10.1371/journal.ppat.1003701. [DOI] [PMC free article] [PubMed] [Google Scholar]
- 98.Karlas A, Machuy N, Shin Y, Pleissner K-P, Artarini A, Heuer D, Becker D, Khalil H, Ogilvie LA, Hess S, Maurer AP, Muller E, Wolff T, Rudel T, Meyer TF. 2010. Genome-wide RNAi screen identifies human host factors crucial for influenza virus replication. Nature 463:818–822. 10.1038/nature08760. [DOI] [PubMed] [Google Scholar]
- 99.Konig R, Stertz S, Zhou Y, Inoue A, Hoffmann HH, Bhattacharyya S, Alamares JG, Tscherne DM, Ortigoza MB, Liang Y, Gao Q, Andrews SE, Bandyopadhyay S, De Jesus P, Tu BP, Pache L, Shih C, Orth A, Bonamy G, Miraglia L, Ideker T, Garcia-Sastre A, Young JAT, Palese P, Shaw ML, Chanda SK. 2010. Human host factors required for influenza virus replication. Nature 463:813–817. 10.1038/nature08699. [DOI] [PMC free article] [PubMed] [Google Scholar]
- 100.OuYang B, Chou JJ. 2014. The minimalist architectures of viroporins and their therapeutic implications. Biochim. Biophys. Acta 1838:1058–1067. 10.1016/j.bbamem.2013.09.004. [DOI] [PMC free article] [PubMed] [Google Scholar]
- 101.Nieva JL, Madan V, Carrasco L. 2012. Viroporins: structure and biological functions. Nat. Rev. Microbiol. 10:563–574. 10.1038/nrmicro2820. [DOI] [PMC free article] [PubMed] [Google Scholar]
Associated Data
This section collects any data citations, data availability statements, or supplementary materials included in this article.