

ABSTRACT
Brain-derived neurotrophic factor (BDNF) is a neurotrophin that promotes neuronal proliferation, survival, and plasticity. These effects occur through autocrine and paracrine signaling events initiated by interactions between secreted BDNF and its high-affinity receptor, TrkB. A BDNF/TrkB autocrine/paracrine signaling loop has additionally been implicated in augmenting the survival of cells representing several human cancers and is associated with poor patient prognosis. Adult T-cell leukemia (ATL) is a fatal malignancy caused by infection with the complex retrovirus human T-cell leukemia virus type 1 (HTLV-1). In this study, we found that the HTLV-1-encoded protein HBZ activates expression of BDNF, and consistent with this effect, BDNF expression is elevated in HTLV-1-infected T-cell lines compared to uninfected T cells. Expression of TrkB is also higher in HTLV-1-infected T-cell lines than in uninfected T cells. Furthermore, levels of both BDNF and TrkB mRNAs are elevated in peripheral blood mononuclear cells (PBMCs) from ATL patients, and ATL patient sera contain higher concentrations of BDNF than sera from noninfected individuals. Finally, chemical inhibition of TrkB signaling increases apoptosis in HTLV-1-infected T cells and reduces phosphorylation of glycogen synthase kinase 3β (GSK-3β), a downstream target in the signaling pathway. These results suggest that HBZ contributes to an active BDNF/TrkB autocrine/paracrine signaling loop in HTLV-1-infected T cells that enhances the survival of these cells.
IMPORTANCE Infection with human T-cell leukemia virus type 1 (HTLV-1) can cause a rare form of leukemia designated adult T-cell leukemia (ATL). Because ATL patients are unresponsive to chemotherapy, this malignancy is fatal. As a retrovirus, HTLV-1 integrates its genome into a host cell chromosome in order to utilize host factors for replication and expression of viral proteins. However, in infected cells from ATL patients, the viral genome is frequently modified to block expression of all but a single viral protein. This protein, known as HBZ, is therefore believed to modulate cellular pathways necessary for the leukemic state and the chemotherapeutic resistance of the cell. Here we provide evidence to support this hypothesis. We found that HBZ promotes a BDNF/TrkB autocrine/paracrine signaling pathway that is known to enhance the survival and chemotherapeutic resistance of other types of cancer cells. It is possible that inhibition of this pathway may improve treatments for ATL.
INTRODUCTION
Worldwide, approximately 15 million people are infected with the complex retrovirus human T-cell leukemia virus type 1 (HTLV-1) (1). Although most HTLV-1 carriers do not experience pathological effects from infection, a small percentage of this population will develop one of a diverse spectrum of HTLV-1-associated diseases. Adult T-cell leukemia (ATL) is one of the more prominent diseases known to be linked etiologically to HTLV-1 infection (2). ATL is a fatal malignancy caused by the uncontrolled proliferation of infected CD4+ T cells that develops following a persistent viral infection lasting several decades. Chemotherapy has generally proven ineffective in the treatment of ATL patients (3), exemplifying the enhanced survival capabilities of ATL cells.
The initial events toward the development of ATL are believed to involve the viral protein Tax, which displays a number of oncogenic properties. In general, the pleiotropic functions of Tax promote unregulated cell division while concomitantly increasing the susceptibility of the host cell genome to alterations (4). However, Tax is likely to be dispensable following the transition to ATL, as Tax expression is lost in more than half of all ATL patients (5). Certain mechanisms that eliminate Tax expression involve disruption of the proviral promoter, located within the 5′ long terminal repeat (LTR) (5–7), which also abolishes expression of the other viral genes carried on the sense strand of the provirus. However, alterations of the 5′ LTR do not block expression of HBZ, which is encoded by a unique gene on the antisense strand of the provirus and is regulated by a separate promoter, located in the 3′ LTR (8–11). Indeed, HBZ expression is consistently detected in ATL samples and is believed to succeed Tax in promoting ATL progression (9, 12).
Cellular expression of HBZ alone has been shown to produce oncogenic effects, some of which recapitulate certain features of ATL cells. HBZ expression in cell culture models has revealed its ability to transform immortalized fibroblasts and to prolong survival of an interleukin-2 (IL-2)-dependent T-cell line following withdrawal of the cytokine (9, 13). In HTLV-1-infected T-cell lines, short hairpin RNA (shRNA)-mediated knockdown of HBZ expression decreases cell proliferation, and in a mouse model, it reduces organ infiltration and tumor formation by the infected cells (14). Finally, transgenic mice expressing HBZ through the CD4 promoter develop lymphomas, with lymphoma cell infiltration of the lungs, bone marrow, spleen, and liver (15).
Effects of HBZ stem from its ability to deregulate cellular gene expression. HBZ localizes to the nucleus, where it is able to interact with a number of transcription factors and coactivators, thereby influencing the activities of these proteins (16). In the current study, we show that HBZ activates transcription of the neurotrophin brain-derived neurotrophic factor (BDNF). BDNF is a secreted protein that classically functions to stimulate neuronal proliferation, survival, and plasticity (reviewed in reference 17). These effects occur via signaling cascades that are activated upon binding of BDNF to its high-affinity receptor, TrkB. In certain tumor and leukemic cells, overexpression of TrkB induces a BDNF/TrkB autocrine/paracrine signaling loop that promotes the survival of these cells (18, 19). We found that both BDNF and TrkB are overexpressed in HTLV-1-transformed T-cell lines and in CD8+-depleted cells from ATL patients. Furthermore, we provide evidence of enhanced survival of HTLV-1-transformed cells through BDNF/TrkB autocrine/paracrine signaling. It is therefore possible that this HBZ-mediated effect contributes to the enhanced survival capabilities and chemoresistance of ATL cells.
MATERIALS AND METHODS
Cell lines.
HeLa-HBZ, HeLa-HBZ-MutAD, and HeLa-pcDNA clonal cell lines (20) and 293T/17 cells (ATCC) were cultured in Dulbecco's modified Eagle's medium supplemented with 10% fetal bovine serum (FBS), 2 mM l-glutamine, 100 U/ml penicillin, and 50 μg/ml streptomycin. HeLa clonal cell lines were additionally supplemented with 0.5 mg/ml G418. HeLa-HBZ-US, HBZ-MutZIP, and HBZ-ΔATG clonal cell lines were generated as described previously (20). Jurkat-HBZ and Jurkat-pcDNA clonal cell lines (21) and HTLV-1-infected and uninfected T-cell lines were cultured in Iscove's modified Dulbecco medium (IMDM) supplemented with 10% FBS, 2 mM l-glutamine, 100 U/ml penicillin, and 50 μg/ml streptomycin. Jurkat clonal cell lines were additionally supplemented with 1.5 mg/ml G418.
Transfections and lentiviral infections.
For lentiviral infections, 2 × 10⁶ 293T/17 cells were culture in 6-cm dishes for 24 h and then transfected with pMD2.G (0.6 pmol), pMDLg/pRRE (1 pmol), and pRSV-Rev (1 pmol), which are Addgene plasmids 12259, 12251, and 12253, respectively, using calcium phosphate. Cells were also cotransfected with 3 pmol of the pRNAT-U6.2/Lenti-V1 control or -V2 shRNA-HBZ vector (14). The medium from each transfection was replaced with 3 ml IMDM-10% FBS at 24 h. At 48 h, 1.25 × 10⁵ MT-2 cells were suspended in the cleared virus culture medium and supplemented with 1.5 ml IMDM-10% FBS and Polybrene (8 μg/ml). The culture medium was replaced with IMDM-10% FBS 24 h after infection, and cells were cultured in the presence of 1 mg/ml G418 for 1 to 2 weeks. For transfections, 6 × 10⁶ C10/MJ cells were suspended in 0.6 ml RPMI-10 mM dextrose-0.1 mM dithiothreitol (DTT) with 18 μg p7LEF-Fos-Luc (22) and 0.1 μg pRL-SV40-Luc (Promega) and electroporated in 0.4-cm cuvettes with a Gene Pulser Xcell instrument (Bio-Rad), using a single exponential-decay pulse of 200 V and 950 μF. Cells were cultured in normal medium for 24 h and subsequently serum starved (0.5% FBS) for 24 h. Cells were then treated with ANA-12 (20 μM), and luciferase activity was measured 24 h later, as described previously (23).
Cells and sera from patients.
Peripheral blood samples and sera were used in accordance with French bioethics laws concerning biologic collections. All experiments using patient samples were approved by the Ministère de la Recherche and the Comité de Protection des Personnes. Cells were isolated as described previously (24). Briefly, peripheral blood mononuclear cells (PBMCs) were isolated from EDTA-anticoagulated blood samples on Ficoll-density gradients and washed in phosphate-buffered saline (PBS). CD8+ cells were removed using anti-CD8 paramagnetic microbeads (Miltenyi Biotec) following the manufacturer's instructions. CD8+ cell-depleted PBMCs were then placed in culture wells (in round-bottomed 24-well plates) at 106 cells/ml in 1 ml of RPMI 1640 medium supplemented with 10% FBS, 2 mM glutamine, and penicillin-streptomycin. Cells were harvested after 5 days at 37°C in 5% CO2. Sera were separated from the blood samples as follows: after blood cells were clotted for 20 min at room temperature, samples were centrifuged at 20°C and 1,500 × g for 10 min. Sera were then immediately removed and stored at −80°C prior to analysis.
Analysis of sera from patients.
Sera were diluted 1:3 in PBS and analyzed by enzyme-linked immunosorbent assay (ELISA), using a BDNF Emax ImmunoAssay system DuoSet (Promega) as described by the manufacturer. Sera were acid treated and then neutralized as described by the manufacturer for detection of total BDNF (mature and uncleaved forms). This step was not required for detection of mature BDNF. Sera analyzed for mature BDNF were heated at 56°C for 30 min to inactivate HTLV-1 in patient samples.
RNA extraction, cDNA synthesis, and quantitative real-time PCR.
RNA was extracted from cell lines by use of TRIzol reagent (Invitrogen) as described by the manufacturer. RNA from healthy donor CD4 T cells was purchased from AllCells. cDNA was synthesized using an iScript (Bio-Rad) or Revert-Aid (Thermo Scientific) kit as described by the manufacturer, with random hexamers or, where indicated, specific primers (for BDNF, 5′-GAAAGCGGGAACCCTCTAAG; for UBE2D2, 5′-CGTGGGCTCATAGAAAGCAGTCAA; and for HBZ, 5′-GCAACCACATCGCCTCCA). Real-time PCR amplification of cDNAs from cell lines and cDNA purchased from AllCells was performed as described previously (20). Patient and donor sample processing and real-time PCR were performed as described previously (24). Standard curves were generated from each experimental PCR plate for all primer pairs on the plate by using serial dilutions of an appropriate experimental sample. PCR efficiencies from all plates and primer pairs ranged from 78% to 146%, with correlation coefficients of 0.97 to 1.0. Primers used were as follows: BDNF set 1 (transcript IV), 5′-CTGCAGAACAGAAGGAGTACAT (forward) and 5′-CAGCCTTCATGCAACCAAAG (reverse); BDNF set 2 (all), 5′-GCAATTGTGTGGTCAGTGGCTCTT (forward) and 5′-CCTGCTGCCATGCATGAAACACTT (reverse); TrkB (NTRK2), 5′-CCGTCACCTTGACTTGTCTGAACT (forward) and 5′-ATTGGGTATCTGCAGGTTTGCCAG (reverse); and TrkB-TK+, 5′-CAGCACATCAAGCGACATAAC (forward) and 5′-CACGCAGACGCCATAGAA (reverse). UBE2D2 reference primers and HBZ primers have been described previously (20). Separate HBZ primers were used for the experiments in Fig. 4 and have been described previously (24). Relative mRNA levels and HBZ mRNA copy numbers were determined as described previously (20). The number of TrkB-TK+ mRNA copies per UBE2D2 mRNA copy was determined by amplification of all samples with both primer sets and of serial dilutions of pSG-TrkB-TK+HU on the same plate. The pSG-TrkB-TK+HU plasmid contains TrkB-TK+ and UBE2D2 amplification targets. Copy number ratios were calculated according to the pSG-TrkB-TK+HU standard curve.
FIG 4.

HTLV-1-infected T cells express TrkB. (A) Total expression of all TrkB variants in uninfected and HTLV-1-infected T cells. The graph shows real-time PCR results as described in the legend to Fig. 2A, obtained using TrkB primers. Values correspond to three independent experiments and were calculated relative to data for the CD4+ cells (set to 1). (B) Expression of TrkB variants containing the tyrosine kinase domain (TrkB-TK+) in CD4+ and HTLV-1-infected T cells. The graph shows TrkB-TK+ mRNA copy numbers normalized to one copy of UBE2D2 mRNA. Values correspond to two independent experiments. (C) Expression of the full-length TrkB protein in HTLV-1-infected cells. Western blot analysis was performed to detect TrkB in total membrane preparations from Jurkat cells and HTLV-1-infected T-cell lines. The membrane in the upper panel was probed with a TrkB antibody. The lower panel shows the same samples stained with Coomassie blue. (D) Colocalization of TrkB and BDNF on the surfaces of HTLV-1-infected C10/MJ cells. Cells were analyzed by indirect immunofluorescence microscopy (magnification, ×40; Zeiss LSM 700 microscope) using TrkB and BDNF antibodies or with secondary antibodies alone (lower panels). Nuclei were stained with DAPI. Bars, 10 μm (upper panels) and 5 μm (middle and lower panels). (E) Western blot detection of phosphorylated TrkB in C10/MJ cells treated with DMSO or the TrkB antagonist ANA-12 (20 μM) prior to preparation of whole-cell extracts. The membrane in the upper panel was probed with a phosphorylation-specific TrkB antibody. The lower panel shows the same membrane stripped and reprobed with an actin antibody.
Determination of BDNF mRNA half-life.
Clonal cells were seeded on 6-cm plates and cultured overnight prior to replacing the normal medium with medium containing 1 μg/ml actinomycin D (Sigma-Aldrich). Cells were harvested at the indicated posttreatment times and processed for reverse transcriptase PCR (RT-PCR) analysis as described above. Data analysis was done as described previously (20).
Detection of proteins from cellular extracts and culture media.
Whole-cell extracts were prepared using RIPA buffer as described previously (25); RIPA buffer was additionally supplemented with Halt phosphatase inhibitor cocktail (Thermo Scientific). Proteins from culture media were prepared by culturing 2 × 10⁶ cells/ml for 24 h in serum-free medium. Cells and cellular debris were removed from the medium by centrifugation, and proteins were precipitated from 1.2 ml of the cleared medium by using trichloroacetic acid at a final concentration of 20%. Samples were ice chilled for 2 h or 24 h prior to centrifugation. Protein precipitates were washed twice with 90% acetone-10 mM HCl and suspended in SDS sample dye. Total membrane extracts were prepared as described previously (26). Proteins from whole-cell extracts, culture media, and total membrane extracts were separated by SDS-PAGE and analyzed by Western blotting as described previously (20). Primary antibodies used for protein detection were as follows: mouse anti-Myc (05-724; Millipore), mouse anti-actin (MAB1501R; Chemicon International), rabbit anti-BDNF (sc-546; Santa Cruz Biotechnology), anti-phospho-Ser9 glycogen synthase kinase 3β (GSK-3β) (9336; Cell Signaling), anti-TrkB, and anti-phospho-Tyr706/707 TrkB (kit 4638; Cell Signaling).
Glutathione S-transferase (GST) pulldown assays.
GST-KIX was expressed and purified as described previously (23). Glutathione-agarose beads (20 μl) were equilibrated in BC100 (0.1 M KCl, 20 mM HEPES [pH 7.9], 5 mM MgCl2, 20 μM ZnSO4, 20% glycerol, 0.01% Triton X-100, 0.1 mM EDTA, 0.5 mM phenylmethylsulfonyl fluoride [PMSF], 1 mM benzamidine, 5 μg/ml leupeptin, 5 μg/ml aprotinin, and 2 mM DTT) and incubated with 50 pmol of GST-KIX at 4°C for 1 h. Beads were then washed twice with BC100 and combined with 860 μg of whole-cell extract in BC100-5% bovine serum albumin (BSA). Binding reaction mixtures were mixed at 4°C overnight, and beads were subsequently washed four times with BC100 and resuspended in SDS sample dye. Eluted proteins were resolved by SDS-PAGE. The primary antibody used for HBZ detection has been described previously (8).
ChIP assays.
HeLa clonal cells expressing HBZ or carrying the empty vector were analyzed. Chromatin immunoprecipitation (ChIP) assays were performed as described previously (27), but using a Zymo-Spin ChIP kit (Zymo Research). For each antibody, 200 μg (100 μl) of formaldehyde-cross-linked chromatin was diluted to 1 ml with ChIP dilution buffer; a 10-μl aliquot of undiluted chromatin served as the input. Antibodies against acetyl-histone H3 (06-559; Millipore) and RNA polymerase II (4H8 and 2629; Cell Signaling) were used. Purified input and ChIP DNA samples were suspended in 50 μl of water. Real-time PCR amplification of ChIP samples was performed as described above for quantitative real-time PCR, using 2.5 μl of sample DNA per 15-μl reaction mix. PCR efficiencies ranged from 76.7% to 153.2%, and correlation coefficients ranged from 0.963 to 0.999. Primers used were as follows: for BDNF 5′, 5′-TTGTCTTCTGTAGTCGCCAAG (forward) and 5′-CCAACAGATGCTGGAAGGTAA (reverse); for BDNF-IV −725, 5′-ATTCCTCTGATACCCAGTGTTG (forward) and 5′-CCCTCCTCCTGAAATTGTGAT (reverse); for BDNF-IV +16, 5′-ATATGACAGCGCACGTCAAG (forward) and 5′-GCAGGGAGATTTCATGCTAGTT (reverse); for BDNF-IV +189, 5′-CGCCATGCAATTTCCACTATC (forward) and 5′-TCACGTTCCCTTCGCTTAAT (reverse); and for BDNF 3′, 5′-TGCAGAATGGCCTGGAATTA (forward) and 5′-GGATGGTCATCACTCTTCTCAC (reverse). Protein and modification enrichment with each amplicon was quantified relative to the input, as described previously (28), and the maximum enrichment obtained was set to 100%.
Immunofluorescence.
C10/MJ cells (5 × 10⁵ to 1 × 10⁶ cells/ml) were seeded on coverslips coated with poly-l-lysine (Sigma-Aldrich) for 24 h. Coverslips were treated with poly-l-lysine for 1 h at room temperature and then dried overnight. Cells were then washed with PBS (137 mM NaCl, 2.7 mM KCl, 3 mM Na2HPO4, and 1.5 mM KH2PO4) and fixed with PBS-4% paraformaldehyde. Coverslips were then washed with PBS and incubated at room temperature for 1 h with primary antibodies at a 1:100 dilution in PBS-1% BSA. Coverslips were then washed with PBS-1% BSA and incubated at room temperature for 1 h with secondary antibodies at a 1:400 dilution and with DAPI (4′,6-diamidino-2-phenylindole; Sigma-Aldrich) in PBS-1% BSA. Coverslips were then washed extensively with PBS and subsequently with water and mounted on slides using ProLong Gold antifade reagent (Life Technologies). Antibodies were as follows: mouse anti-BDNF (359258.11; Millipore), rabbit anti-TrkB (H-181; Santa Cruz Biotechnology), goat anti-rabbit–Alexa Fluor 488, and goat anti-mouse–Alexa Fluor 635 (Life Technologies). Fluorescence images were acquired by confocal microscopy using an LSM 700 microscope (Zeiss), and images were analyzed using Zen software (Zeiss). Identical settings (except for DAPI staining) were used to acquire images in the absence or presence of primary antibodies. For Fig. 6B, slides were imaged using a Nikon Eclipse E600 fluorescence microscope and NIS-Elements software. Identical settings were used to acquire dimethyl sulfoxide (DMSO) and ANA-12 images.
FIG 6.

Inhibition of TrkB signaling induces death of HTLV-1-infected cells. (A) C10/MJ cell survival following K-252a treatment. The graph shows ratios of live (light gray bars) to dead (dark gray bars) cells (transformed to 100% total cells) following the indicated culture conditions and treatments. Values are the mean data from three or more independent experiments, with error bars denoting standard deviations. *, P < 0.05; **, P < 0.01; ***, P < 0.0005 (two-tailed Student t test). (B) ANA-12 reduces binding of BDNF antibody to the surfaces of C10/MJ cells. Cells were seeded on coverslips in the presence of ANA-12 or DMSO and analyzed by indirect immunofluorescence microscopy (magnification, ×40; Nikon Eclipse E600 microscope) using a BDNF antibody. Nuclei were stained with DAPI. (C) C10/MJ cell survival following ANA-12 (20 μM) treatment. The graph shows ratios of live to dead cells as detailed above. Values are the mean data from three independent experiments, with error bars denoting standard deviations. **, P < 0.01 (two-tailed Student t test). (D) ATL-2s cell survival following K-252a (100 nM) and ANA-12 (20 μM) treatment. The graph shows ratios of live to dead cells as detailed above. Values are the mean data from three independent experiments, with error bars denoting standard deviations. *, P < 0.01 (two-tailed Student t test).
Cell viability assay.
Cell viability was determined by trypan blue exclusion. Cells (5 × 10⁵ cells/ml) were grown in IMDM supplemented with 10% or 0.5% FBS in 24-well plates for 24 h. Cells were treated with the indicated concentrations of ANA-12 (Sigma-Aldrich) or K-252a (Calbiochem) or with an equivalent volume of DMSO for an additional 24 h.
RESULTS
BDNF expression is increased in the presence of HBZ.
We developed empty vector control and HBZ-expressing clonal cell lines by using HeLa and Jurkat cells. These cells were subjected to different microarray analyses, and data obtained from Jurkat and HeLa clones indicated that expression of BDNF is elevated in the presence of HBZ. Up to 18 possible transcript variants can be synthesized from the BDNF gene, due to separate transcription start sites and/or alternative splicing (29). Because sequence differences among variants encompass 5′ untranslated exons, these variants generally produce identical polypeptides (pro-BDNF) (30). In this study, we mainly analyzed the transcript designated BDNF-IV (accession no. NM_170733.3; herein referred to as BDNF), which we used as a marker of overall BDNF expression, as this variant has been well defined and was readily detectable in assays, while many of the other variants were not (data not shown). To confirm the microarray data, we performed RT-PCR analysis of BDNF in Jurkat clonal cell lines either expressing HBZ or carrying the empty expression vector (pcDNA3.1). BDNF mRNA was detected in each of the HBZ-expressing clones but was absent in cells containing the empty vector (Fig. 1A), suggesting that HBZ induces a significant increase in BDNF expression.
FIG 1.

HBZ upregulates BDNF expression. (A) BDNF expression in Jurkat clonal cell lines stably expressing HBZ-S1 or carrying the empty vector. RT-PCR was performed using cDNAs prepared with gene-specific primers for BDNF, UBE2D2, and HBZ. (B) BDNF expression in uninfected and HTLV-1-infected T-cell lines. The upper panel shows levels of BDNF and UBE2D2 mRNAs analyzed by RT-PCR. RT-PCR was performed using cDNAs prepared with gene-specific primers for BDNF and UBE2D2. The lower panel shows the numbers of copies of HBZ mRNA per copy of UBE2D2 mRNA in the cell lines. cDNAs were prepared using gene-specific primers for HBZ and UBE2D2 for quantitative real-time PCR. The graph shows data obtained with RNAs identical to those used for the upper panel. (C) Western blot detection of BDNF in culture media of uninfected and HTLV-1-infected T-cell lines. The membrane in the upper panel was probed with a BDNF antibody. The lower panel shows the membrane stained with Ponceau S. (D) Western blot quantification of secreted mature and pro-BDNF from three independent experiments. Band densities were quantified using ImageQuant TL (GE Healthcare) and adjusted to the percentage of total mature and pro-BDNF (set to 100%). (E) Western blot detection of HBZ in HTLV-1-infected T-cell lines. The membrane in the upper panel was probed with an HBZ antibody. The lower panel shows the membrane stained with Ponceau S. No WCE, no whole-cell extract. (F) BDNF and HBZ expression in MT-2 cells transduced with negative-control (V1) and HBZ (V2) shRNA lentiviral vectors. The graph shows real-time PCR data from two independent transfection assays, with values normalized to that for V1 (set to 1).
Based on these results, we compared BDNF expression among HTLV-1-infected and -uninfected T-cell lines and primary CD4+ T cells from a healthy donor. While BDNF mRNA was detected in four of the five HTLV-1-infected T-cell lines tested, it was absent in all of the uninfected cells (Fig. 1B, top panel). As expected, HBZ mRNA was also detected at various levels in all HTLV-1-infected cell lines (Fig. 1B, bottom panel).
We also examined BDNF and HBZ protein levels among the cell lines. Culture media from the HTLV-1-infected cell lines contained more secreted BDNF than that detected in media from uninfected Jurkat and CEM cells (Fig. 1C). Detection of secreted BDNF from C8166/45 cells suggests that one or more variants other than BDNF-IV are expressed in these cells. Culture media contained both mature and pro-BDNF (quantified in Fig. 1D), which are the cleaved and unprocessed forms of the protein, respectively. Mature BDNF is known to promote cell survival (17), while pro-BDNF has been shown to induce apoptosis in certain cell types, through p75NTR (31). Levels of HBZ protein were also analyzed in these cells (Fig. 1E). Utilizing the high-affinity interaction between HBZ and the KIX domain of p300/CBP (23), we precipitated HBZ from whole-cell extracts by using GST-KIX bound to glutathione beads. This approach allowed us to efficiently detect HBZ despite limitations in the sensitivity of our HBZ antibody and by avoiding background arising from the antibody light chain, which resolves with HBZ by SDS-PAGE following immunoprecipitation. We detected various amounts of the HBZ protein in each of the HTLV-1-infected cell lines. Differences in BDNF expression among these cell lines may reflect their heterogeneity, with chromosomal and epigenetic variations possibly influencing BDNF transcription. To corroborate that HBZ upregulates BDNF expression in infected cells, we used shRNA to knockdown HBZ in MT-2 cells and observed a reduction in both HBZ and BDNF mRNAs (Fig. 1F). These results suggest that HBZ is involved in activating BDNF expression in HTLV-1-infected T cells.
HBZ regulates BDNF expression at the level of transcription.
To gain insight into how HBZ activates BDNF expression, we were interested in identifying domains in HBZ that mediated the effect. We established HeLa clonal cell lines that express wild-type HBZ or HBZ mutants (HBZ-MutAD, HBZ-MutZIP, and HBZ-ΔATG) or that carry the empty expression vector (pcDNA3.1). HBZ-MutAD contains point mutations in the N-terminal activation domain that suppress the interaction between HBZ and the cellular coactivators p300 and CBP (32). HBZ-MutZIP contains point mutations in the C-terminal leucine zipper (ZIP) domain that suppress interactions between HBZ and cellular bZIP factors in the ATF/CREB and Jun families (20). Finally, HBZ-ΔATG contains a point mutation in the start codon that prevents translation of the HBZ mRNA (33), as a previous study correlated enhanced cellular survival with the HBZ mRNA rather than the protein (9). Among these cell lines, we found that relative BDNF mRNA levels were elevated with wild-type HBZ or HBZ-MutAD but not with HBZ-MutZIP or HBZ-ΔATG (Fig. 2A). These data show that BDNF activation occurs through the HBZ protein and that the ZIP domain of HBZ is essential for this effect.
FIG 2.
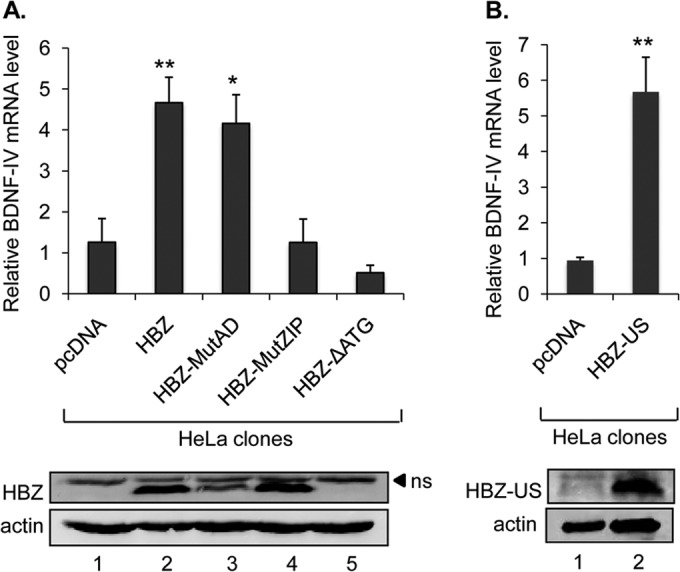
The ZIP domain of HBZ is required for transcriptional activation of BDNF. (A and B) BDNF expression in HeLa clonal cell lines containing the indicated expression vectors (HBZ-S1 wild type and mutants and HBZ-US wild type). The graphs show results from real-time PCR amplification of BDNF normalized to amplification of UBE2D2. Values correspond to three independent experiments and were calculated relative to one data set for cells with pcDNA3.1 alone. Error bars show standard deviations. *, P < 0.05; **, P < 0.005 (two-tailed Student t test). Lower panels show Western blots of whole-cell extracts prepared from cell lines corresponding to those listed above. Membranes were probed with a Myc antibody for detection of epitope-tagged HBZ and then stripped and probed for actin. ns, nonspecific band.
The clonal cell lines initially analyzed expressed the splice 1 variant of HBZ (HBZ-S1), which is expressed predominantly in ATL cells (34). We were also interested in testing whether the unspliced variant of HBZ (HBZ-US) similarly activated BDNF expression. Using HeLa cells, we established clonal cell lines expressing HBZ-US and found that these cells contained elevated levels of BDNF mRNA relative to cells carrying the empty vector (Fig. 2B).
Given that HBZ interacts with multiple cellular proteins that regulate transcription, we expected HBZ to activate transcription from the BDNF promoter. However, in reporter assays, the promoter of the BDNF-IV gene proved to be unresponsive to HBZ (data not shown), suggesting that HBZ functions through an alternative mechanism. In addition to regulation through the promoter, BDNF expression is controlled by an antisense transcript and a small interfering RNA that targets the 3′ untranslated region (3′ UTR) (35, 36). We found that HBZ did not affect either of these pathways (data not shown). To test whether the increase in BDNF mRNA was due to stabilization of the transcript, we used actinomycin D to block transcription elongation (37). This treatment led to a slight decrease in the BDNF mRNA half-life in the presence of HBZ (1.3 h versus 1.5 h in cells with pcDNA3.1 alone) (Fig. 3A), demonstrating that HBZ does not stabilize the transcript.
FIG 3.
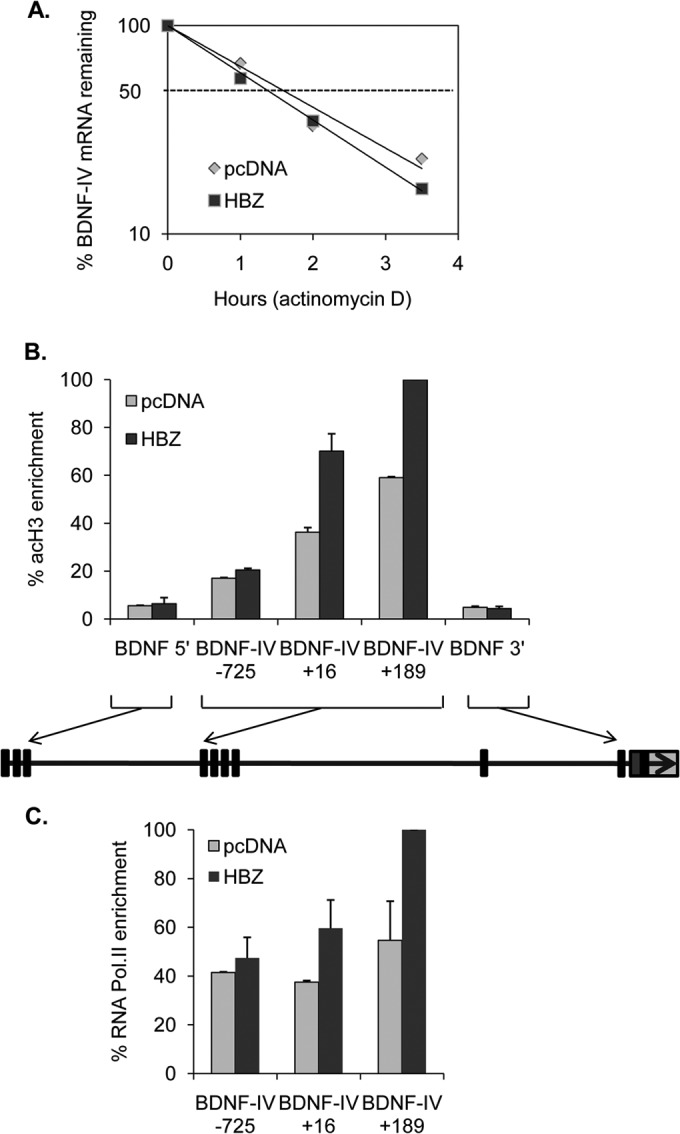
HBZ activates the promoter of BDNF-IV. (A) BDNF mRNA stability in HeLa clonal cell lines expressing HBZ-S1 or carrying the empty vector. The graph shows real-time PCR analysis of cDNA prepared from actinomycin D-treated cells for the indicated times, normalizing BDNF amplification to β-actin amplification. BDNF mRNA levels were set to 100% at 0 h for both cell lines, and data were averaged from two independent experiments. (B) Levels of histone H3 acetylation (acH3) enrichment over that of the BDNF gene in cells expressing HBZ-S1 or carrying the empty vector. ChIP assays were performed using an antibody directed against acH3, and relative levels of acH3 at the indicated sites were normalized to 1% of the input DNA following quantitative real-time PCR and graphed with respect to the highest level of enrichment (set to 100%). The graph shows data averaged from two independent ChIP assays. The diagram depicts the >67-kb gene, with exons indicated as rectangles. (C) Levels of RNA polymerase II (Pol.II) enrichment over that in the BDNF-IV region in cells expressing HBZ-S1 or carrying the empty vector, with data averaged from two independent ChIP assays. The middle of each amplicon is indicated with respect to the BDNF-IV transcription start site.
We additionally performed ChIP assays to test for markers of active transcription across the BDNF gene. We found that the HeLa clones carrying the empty vector or expressing HBZ each showed a peak of acetyl-histone H3 enrichment at the BDNF-IV promoter and just downstream of the BDNF-IV transcription start site (Fig. 3B). Enrichment of this histone mark was greater in the cells expressing HBZ. Furthermore, cells expressing HBZ exhibited greater enrichment of RNA polymerase II at the two BDNF-IV downstream sites than that in cells carrying the empty vector (Fig. 3C). These data provide evidence for transcriptional regulation of BDNF by HBZ.
HTLV-1-infected T-cell lines express TrkB.
Our findings that HTLV-1-infected T cells produce BDNF led us to test whether these cells also express the BDNF receptor, TrkB. We first compared levels of TrkB mRNA among uninfected T-cell lines, HTLV-1-infected T-cell lines, and primary CD4+ T cells from a healthy donor. Because multiple TrkB transcript variants exist, we initially analyzed total TrkB mRNA levels through the use of a real-time PCR primer set that targets all of the variants. In this analysis, each of the HTLV-1-infected T-cell lines exhibited significantly more total TrkB expression than that in the uninfected T-cell lines and the primary T cells (Fig. 4A). A subset of the TrkB transcript variants lack exons encoding the tyrosine kinase domain that is associated with prosurvival signaling (38). Using real-time PCR primers that selectively target transcripts encoding the kinase domain (TrkB-TK+), we found that levels of these transcripts were significantly elevated in the HTLV-1-infected T-cell lines compared to the uninfected CD4+ T cells (Fig. 4B). Furthermore, we were able to detect the full-length TrkB (TrkB-TK+) protein in total membrane fractions from HTLV-1-infected cells but not from Jurkat cells (Fig. 4C).
We then performed indirect immunofluorescence microscopy to analyze the distribution of TrkB in HTLV-1-infected cells. Using C10/MJ cells, we found that most of the TrkB appeared to localize to the cell surface and, importantly, that BDNF similarly localized at the cell surface (Fig. 4D). Based on this observation, we tested whether the TrkB receptor was stimulated in these cells, as stimulation of TrkB-TK+ through binding of BDNF leads to autophosphorylation of the receptor. Consistent with the immunofluorescence data, we detected TrkB phosphorylation (Fig. 4E, lane 1). Furthermore, treatment of cells with the TrkB antagonist ANA-12 (39) abolished this modification (Fig. 4E, lane 2). These results indicate that mature BDNF produced by cells binds to and activates the TrkB receptor.
Expression of BDNF and TrkB is upregulated in ATL patient cells.
In addition to HTLV-1-infected T-cell lines, we analyzed BDNF and TrkB expression in CD8+-depleted cells isolated from HAM/TSP (HTLV-1-associated myelopathy/tropical spastic paraparesis; a separate HTLV-1-associated disease) and acute ATL patients and from asymptomatic carriers (AC) (Table 1). We found that relative BDNF mRNA levels were significantly higher in HAM/TSP and ATL patient samples than in AC samples (Fig. 5A). This observation was associated with elevated levels of HBZ mRNA in both sets of patient samples compared to the AC samples (Fig. 5C). In addition to BDNF, TrkB mRNA levels were significantly higher in ATL samples than in AC samples, while, in contrast, no significant difference in TrkB expression was observed between HAM/TSP and AC samples (Fig. 5B).
TABLE 1.
Clinical features of ATL patients
| Patient no. | Sex | Age (yr) | Subtype at diagnosis | Cytogeneticsa | % ATL cells | Presence of hypercalcemia |
|---|---|---|---|---|---|---|
| 1 | Female | 61 | Acute | Tetraploidy | 78 | Yes |
| 2 | Female | 50 | Acute | Tetraploidy | 55 | No |
| 3 | Female | 44 | Acute | del6, der7, add8, add13, der14, del18 | 65 | No |
| 4 | Male | 68 | Acute | der1, add2, +2, add4, der7, +7, add10, +10 | 70 | Yes |
del, deletion; der, derivative chromosome; add, additional material of unknown origin; +, gain of a chromosome.
FIG 5.

Comparison of BDNF and TrkB expression among samples from HAM/TSP and ATL patients and asymptomatic carriers. Box plots show mRNA levels of BDNF (A), TrkB (B), and HBZ (C), expressed in arbitrary units (A.U.), in CD8+-depleted PBMCs from asymptomatic carriers (AC) and HAM/TSP and ATL patients following 5 days of culture (4 samples per group). Horizontal lines from the bottom to the top of each plot show the minimum value, the 25th percentile, the median, the 75th percentile, and the maximum value. *, P < 0.05; **, P < 0.005 (two-tailed Student t test). The TrkB and BDNF primers used for real-time PCR amplified all transcript variants. (D and E) BDNF concentrations in acid-treated (D) and untreated (E) specimens. Box plots show ELISA results for sera from noninfected individuals (NI) and HAM/TSP and ATL patients (4 samples per group), using the same plot indices as those described above.
We additionally evaluated serum concentrations of BDNF in patients and noninfected individuals (NI). In this analysis, acid treatment of samples yielded detection of both pro- and mature BDNF, while only mature BDNF was detectable in untreated samples (see Materials and Methods). Analysis of acid-treated samples showed that serum concentrations of BDNF were similar between the NI and HAM/TSP groups but were significantly elevated in the ATL group (Fig. 5D). Similar results were obtained when samples were left untreated (Fig. 5E), suggesting that most serum BDNF is the mature form. Overall, these results show that ATL patient cells possess the necessary components for BDNF/TrkB autocrine/paracrine signaling.
A BDNF/TrkB autocrine/paracrine loop promotes survival of HTLV-1-infected cells.
Evidence of BDNF and TrkB colocalization at the cell surface and phosphorylation of TrkB suggested that a BDNF/TrkB autocrine/paracrine signaling loop was active in infected cells. To test this hypothesis, we analyzed the effects of small-molecule inhibitors of BDNF/TrkB signaling on the survival of cells stressed by serum starvation. K-252a is a tyrosine kinase inhibitor that specifically targets the Trk receptor family at low concentrations (40) (see Fig. 7B). Effects of K-252a were initially evaluated on C10/MJ cells, as these cells contained intermediate levels of BDNF and TrkB-TK+ RNAs in the panel of HTLV-1-infected cells that we tested. Following treatment of the cells with K-252a, we observed a significant increase in cell death at drug concentrations of 100 and 200 nM relative to that with the DMSO vehicle control (Fig. 6A). These effects were independent of the culture conditions (normal serum versus serum-starved conditions), although serum-starved cells additionally exhibited increased death at a K-252a concentration of 50 nM (Fig. 6A). It is important that the K-252a concentrations we used were the same as or lower than those used to inhibit TrkB signaling in other studies (see reference 18). However, to confirm that these results were specifically due to inhibition of this pathway, we also employed a TrkB antagonist, ANA-12 (see Fig. 7B). Using indirect immunofluorescence microscopy, we observed an apparent reduction in BDNF at cell surfaces in the presence of ANA-12 (39) (Fig. 6B). In serum-starved cultures, ANA-12 induced a significant increase in cell death compared to that with DMSO (Fig. 6C).
FIG 7.

Cell survival of Jurkat cells and Jurkat clones following K-252a and ANA-12 treatment. (A) Jurkat-pcDNA and Jurkat-HBZ cell survival following K-252a (100 nM) or ANA-12 (20 μM) treatment. The graph shows ratios of live (light gray bars) to dead (dark gray bars) cells (transformed to 100% total cells) following the indicated culture conditions and treatments. Values are the mean data from three independent experiments, with error bars denoting standard deviations. **, P < 0.01 (two-tailed Student t test). (B) Schematic showing the modes of inhibition of BDNF/TrkB signaling by K-252a and ANA-12.
We were also interested in testing whether K-252a and ANA-12 increased cell death in ATL-2s cells. While C10/MJ cells were established using an in vitro coculture approach, ATL-2s cells were derived directly from an ATL patient and therefore may be more physiologically similar to ATL patient cells. Overall, these cells proved to be more sensitive to culture conditions, as they exhibited more background cell death than C10/MJ cells. Treatment with either K-252a or ANA-12 led to a significant increase in cell death that was independent of serum concentrations in the culture (Fig. 6D).
To confirm that these inhibitors did not influence survival in the absence of TrkB, we analyzed Jurkat cells as well as the empty vector-carrying and HBZ-expressing clonal cell lines that were established from Jurkat cells. The only significant effect of either compound was observed in Jurkat cells, which exhibited a slight increase in death in 10% serum cultures treated with K-252a (Fig. 7A). These results support a prosurvival role for TrkB autocrine/paracrine signaling in HTLV-1-infected T cells.
Finally, we were interested in confirming whether downstream signaling occurs in HTLV-1-infected T cells in response to activation of TrkB by mature BDNF. The downstream effects of BDNF have been characterized extensively for neurons and the brain. In these systems, active GSK-3β opposes the effects of BDNF (41), and consequently, certain signaling pathways downstream of TrkB converge on inactivation of GSK-3β, in part through phosphorylation of its serine 9 residue. In the context of T cells, active GSK-3β is associated with cell death following activation, while inhibition of the enzyme increases activated T-cell survival (42). Based on this information, we compared the effects of ANA-12 and K-252a on GSK-3β serine 9 phosphorylation in Jurkat and HTLV-1-infected T-cell lines. We found that the level of GSK-3β phosphorylation was higher in Jurkat cells than in HTLV-1-infected cells, and both drugs caused a slight increase in the level of phosphorylation in these cells (Fig. 8A). In contrast, both ANA-12 and K-252a reduced the levels of GSK-3β phosphorylation in the three HTLV-1-infected T-cell lines that were tested (Fig. 8A).
FIG 8.
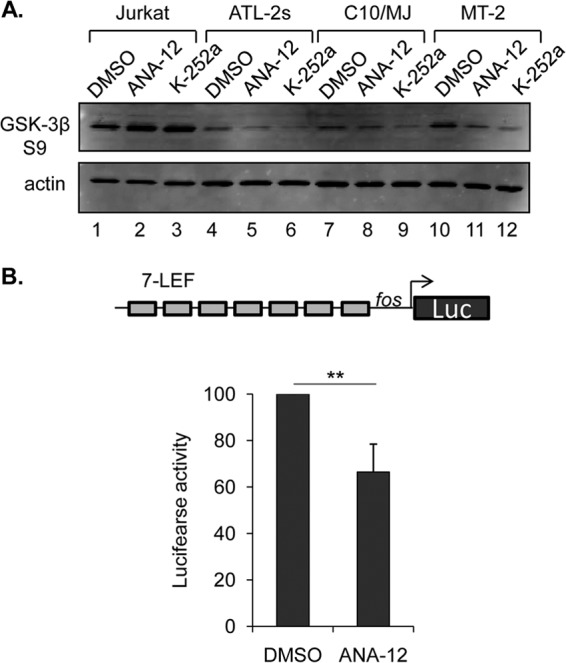
Inhibition of BDNF/TrkB signaling decreases downstream phosphorylation of GSK-3β. (A) The Western blot in the upper panel shows detection of serine 9 phosphorylation of GSK-3β in the indicated cell lines treated with DMSO, ANA-12 (20 μM), or K-252a (100 nM). Cells were cultured with 0.5% FBS for 24 h and then received the indicated drug treatments for 6 h. The lower panel shows the same membrane stripped and then probed for actin. (B) ANA-12 treatment restores GSK-3β activity. C10/MJ cells were transfected with p7LEF-Fos-Luc and pRL-SV40-Luc (internal standard), cultured in 0.5% serum, and treated with DMSO or 20 μM ANA-12. The graph shows data from four independent transfection assays, with values showing the average luminescence normalized to that of the DMSO treatment (set to 100). **, P < 0.005 (two-tailed Student t test).
One important function of GSK-3β is to phosphorylate β-catenin and mark it for degradation (43). Interestingly, inhibition of this process is expected to lead to the survival of Treg cells through stabilization of β-catenin (44), which may relate to recent similarities described between ATL and Treg cells (45). We used a luciferase assay to test whether the drug-induced dephosphorylation of GSK-3β was associated with a decrease in transcription activated by β-catenin. C10/MJ cells were transfected with p7LEF-Fos-Luc, which is activated through formation of an LEF1/β-catenin complex (22). We found that ANA-12 caused a significant decrease in luciferase activity (Fig. 8B), suggesting that dephosphorylation, and therefore reactivation, of GSK-3β contributes to a reduction in β-catenin activity. These observations correlate enhanced survival through BDNF/TrkB autocrine/paracrine signaling with GSK-3β inactivation in HTLV-1-infected T-cell lines.
DISCUSSION
In this study, we found that the protein encoded by the HTLV-1 antisense gene, HBZ, activates expression of the neurotrophin BDNF. In addition, we found that HTLV-1-infected T cells express high levels of TrkB, which serves as the high-affinity receptor for BDNF. In addition to its central role in neuronal survival, the interaction between BDNF and TrkB is believed to facilitate T-cell development. Survival of immature thymocytes has been reported to involve constitutive expression of TrkB, which is activated by BDNF produced from thymic stromal cells (46). However, as these early thymocytes progress through stages of differentiation, TrkB expression declines (46). In circulating T cells, it is unclear whether BDNF/TrkB signaling is significant, as either these cells do not express TrkB or its expression is mainly restricted to Th1 cells (47, 48). BDNF expression in T cells is similarly disputed and has been analyzed in the context of a direct role played by the immune system in repair of neuronal damage rather than for T-cell survival (47–50). It is possible that induced BDNF expression is restricted to T-helper subtypes and depends on antigen-mediated activation of these cells (51). Our results indicate that CD8+-depleted PBMCs from healthy donors and asymptomatic HTLV-1 carriers do not express BDNF and express only low levels of TrkB, suggesting that BDNF/TrkB signaling does not support the survival of these cells.
A different pattern emerged for CD8+-depleted PBMCs from ATL patients. These cells contained elevated levels of BDNF and TrkB mRNAs, and additionally, ATL patients exhibited high serum concentrations of BDNF. This trend of elevated BDNF and TrkB expression extended to T-cell lines transformed with HTLV-1. Furthermore, these cell lines showed evidence of active BDNF/TrkB autocrine/paracrine signaling, which served to enhance their survival. Members of the Trk receptor family were originally characterized as oncogenes, and TrkB/BDNF signaling, specifically, is known to contribute to the survival of certain types of tumor and leukemic cells (18, 19). For example, activation of TrkB induces resistance to chemotherapeutic agents in neuroblastoma cells (52, 53). Therefore, BDNF/TrkB autocrine/paracrine signaling in HTLV-1-infected T cells may be one of the factors underlying the overall ineffectiveness of chemotherapeutic treatments for ATL. This premise takes into account our finding that HBZ activates BDNF expression and previous data showing that HBZ is commonly the only viral protein expressed in cells from ATL patients (5).
Culture media from some HTLV-1-infected cells contained pro-BDNF in addition to the mature form of the protein. While pro-BDNF has been reported to stimulate TrkB (54), it also interacts with p75NTR independently of TrkB, which in neurons and a limited number of other cell types induces apoptosis (31). It is unclear whether pro-BDNF produces a similar effect on HTLV-1-infected cells, as activation of c-Jun N-terminal kinase (JNK) is essential for apoptotic signaling through p75NTR in cultured neurons (55). During HTLV-1 infection of T cells, JNK is activated, and this has been associated with the immortalization of infected T cells rather than cell death (56), suggesting that these cells may be resistant to the apoptotic effects of pro-BDNF. Interestingly, the Tax protein is implicated in JNK activation and is also known to inhibit a variety of apoptotic signals (57). It is therefore possible that the presence of Tax during infection would oppose p75NTR apoptotic signals. In patient sera, mature BDNF was the predominant form of the protein, and therefore, signaling through TrkB is expected to occur in HTLV-1-infected T cells in the peripheral blood.
We found that HBZ activates BDNF expression at the level of transcription. However, the BDNF-IV promoter proved to be unresponsive to HBZ in the reported assays. It is possible that this promoter does not encompass cis-elements affected by the viral protein, as the BDNF gene contains nine separate transcription start sites distributed over more than 60 kb of DNA (29, 30, 58, 59). Alternatively, HBZ may activate transcription through a distal enhancer. This hypothesis is based on our frequent observations that while HBZ may activate expression of a particular endogenous cellular gene, it does not activate transcription from the promoter of that gene in the context of a reporter construct (20; unpublished data). Our data indicate that HBZ regulates BDNF transcription through an interaction with a cellular bZIP factor. Upon associating with HBZ, most bZIP factors are blocked from binding DNA and activating transcription, with JunD serving as the exception (60). Indeed, a complex consisting of HBZ, JunD, and Sp1 has been shown to positively regulate transcription (13, 61). Based on this observation and recent evidence that Sp1 functions at enhancers (62), it is possible that an HBZ/JunD/Sp1 complex is involved in the activation of BDNF expression.
Elevated TrkB levels in HTLV-1-infected T cells were not directly associated with the activities of HBZ or Tax. Indeed, HBZ-expressing clonal cell lines did not exhibit significant differences in TrkB expression compared to cell lines carrying the empty expression vector, and transient cellular expression of Tax did not affect TrkB mRNA levels (data not shown). Furthermore, levels of Tax expression did not correlate with levels of TrkB expression in patient samples (data not shown). Therefore, the mechanism responsible for TrkB expression in the infected cells is unclear. Considering the known oncogenic properties of TrkB, it would be interesting to identify the cellular and/or viral components responsible for activating and sustaining its expression during HTLV-1 infection. It is interesting that in rabbits inoculated with HTLV-1, gag/pol and tax/rex transcripts were shown to be initially high in PBMCs but then declined and eventually became undetectable (63), In contrast, hbz transcript levels increased and eventually stabilized, which paralleled changes in the number of infected cells (63). These observations implicated HBZ in survival of infected cells in rabbits. Taking that study into account, it is possible that TrkB expression is regulated by a combination of events occurring during early HTLV-1 infection and that later expression of HBZ then implements the full BDNF signaling loop.
ACKNOWLEDGMENTS
This work was supported by Public Health Service grant CA128800 from the National Cancer Institute.
We thank M. E. Greenberg for the BDNF luciferase construct, M. Matsuoka for the ATL-2s cells, P. L. Green for the shRNA-HBZ vector, and R. A. Schwalbe for technical advice on protein membrane preparation.
Footnotes
Published ahead of print 10 September 2014
REFERENCES
- 1.Proietti FA, Carneiro-Proietti AB, Catalan-Soares BC, Murphy EL. 2005. Global epidemiology of HTLV-I infection and associated diseases. Oncogene 24:6058–6068. 10.1038/sj.onc.1208968. [DOI] [PubMed] [Google Scholar]
- 2.Iwanaga M, Watanabe T, Yamaguchi K. 2012. Adult T-cell leukemia: a review of epidemiological evidence. Front. Microbiol. 3:322. 10.3389/fmicb.2012.00322. [DOI] [PMC free article] [PubMed] [Google Scholar]
- 3.Fields PA, Taylor GP. 2012. “Antivirals” in the treatment of adult T cell leukaemia-lymphoma (ATLL). Curr. Hematol. Malig. Rep. 7:267–275. 10.1007/s11899-012-0139-9. [DOI] [PubMed] [Google Scholar]
- 4.Marriott SJ, Semmes OJ. 2005. Impact of HTLV-I Tax on cell cycle progression and the cellular DNA damage repair response. Oncogene 24:5986–5995. 10.1038/sj.onc.1208976. [DOI] [PubMed] [Google Scholar]
- 5.Takeda S, Maeda M, Morikawa S, Taniguchi Y, Yasunaga J, Nosaka K, Tanaka Y, Matsuoka M. 2004. Genetic and epigenetic inactivation of tax gene in adult T-cell leukemia cells. Int. J. Cancer 109:559–567. 10.1002/ijc.20007. [DOI] [PubMed] [Google Scholar]
- 6.Koiwa T, Hamano-Usami A, Ishida T, Okayama A, Yamaguchi K, Kamihira S, Watanabe T. 2002. 5′-Long terminal repeat-selective CpG methylation of latent human T-cell leukemia virus type 1 provirus in vitro and in vivo. J. Virol. 76:9389–9397. 10.1128/JVI.76.18.9389-9397.2002. [DOI] [PMC free article] [PubMed] [Google Scholar]
- 7.Taniguchi Y, Nosaka K, Yasunaga J, Maeda M, Mueller N, Okayama A, Matsuoka M. 2005. Silencing of human T-cell leukemia virus type I gene transcription by epigenetic mechanisms. Retrovirology 2:64. 10.1186/1742-4690-2-64. [DOI] [PMC free article] [PubMed] [Google Scholar]
- 8.Gaudray G, Gachon F, Basbous J, Biard-Piechaczyk M, Devaux C, Mesnard JM. 2002. The complementary strand of the human T-cell leukemia virus type 1 RNA genome encodes a bZIP transcription factor that down-regulates viral transcription. J. Virol. 76:12813–12822. 10.1128/JVI.76.24.12813-12822.2002. [DOI] [PMC free article] [PubMed] [Google Scholar]
- 9.Satou Y, Yasunaga J, Yoshida M, Matsuoka M. 2006. HTLV-I basic leucine zipper factor gene mRNA supports proliferation of adult T cell leukemia cells. Proc. Natl. Acad. Sci. U. S. A. 103:720–725. 10.1073/pnas.0507631103. [DOI] [PMC free article] [PubMed] [Google Scholar]
- 10.Cavanagh M, Landry S, Audet B, Arpin-Andre C, Hivin P, Pare M-E, Thete J, Wattel E, Marriott SJ, Barbeau B, Mesnard J-M. 2006. HTLV-I antisense transcripts initiate in the 3′LTR and are alternatively spliced and polyadenylated. Retrovirology 3:15. 10.1186/1742-4690-3-15. [DOI] [PMC free article] [PubMed] [Google Scholar]
- 11.Murata K, Hayashibara T, Sugahara K, Uemura A, Yamaguchi T, Harasawa H, Hasegawa H, Tsuruda K, Okazaki T, Koji T, Miyanishi T, Yamada Y, Kamihira S. 2006. A novel alternative splicing isoform of human T-cell leukemia virus type 1 bZIP factor (HBZ-SI) targets distinct subnuclear localization. J. Virol. 80:2495–2505. 10.1128/JVI.80.5.2495-2505.2006. [DOI] [PMC free article] [PubMed] [Google Scholar]
- 12.Miyazaki M, Yasunaga J, Taniguchi Y, Tamiya S, Nakahata T, Matsuoka M. 2007. Preferential selection of human T-cell leukemia virus type 1 provirus lacking the 5′ long terminal repeat during oncogenesis. J. Virol. 81:5714–5723. 10.1128/JVI.02511-06. [DOI] [PMC free article] [PubMed] [Google Scholar]
- 13.Gazon H, Lemasson I, Polakowski N, Cesaire R, Matsuoka M, Barbeau B, Mesnard JM, Peloponese JM., Jr 2012. Human T-cell leukemia virus type 1 (HTLV-1) bZIP factor requires cellular transcription factor JunD to upregulate HTLV-1 antisense transcription from the 3′ long terminal repeat. J. Virol. 86:9070–9078. 10.1128/JVI.00661-12. [DOI] [PMC free article] [PubMed] [Google Scholar]
- 14.Arnold J, Zimmerman B, Li M, Lairmore MD, Green PL. 2008. Human T-cell leukemia virus type-1 antisense-encoded gene, Hbz, promotes T-lymphocyte proliferation. Blood 112:3788–3797. 10.1182/blood-2008-04-154286. [DOI] [PMC free article] [PubMed] [Google Scholar]
- 15.Satou Y, Yasunaga J, Zhao T, Yoshida M, Miyazato P, Takai K, Shimizu K, Ohshima K, Green PL, Ohkura N, Yamaguchi T, Ono M, Sakaguchi S, Matsuoka M. 2011. HTLV-1 bZIP factor induces T-cell lymphoma and systemic inflammation in vivo. PLoS Pathog. 7:e1001274. 10.1371/journal.ppat.1001274. [DOI] [PMC free article] [PubMed] [Google Scholar]
- 16.Barbeau B, Peloponese JM, Mesnard JM. 2013. Functional comparison of antisense proteins of HTLV-1 and HTLV-2 in viral pathogenesis. Front. Microbiol. 4:226. 10.3389/fmicb.2013.00226. [DOI] [PMC free article] [PubMed] [Google Scholar]
- 17.Chao MV. 2003. Neurotrophins and their receptors: a convergence point for many signalling pathways. Nat. Rev. Neurosci. 4:299–309. 10.1038/nrn1078. [DOI] [PubMed] [Google Scholar]
- 18.Li Z, Beutel G, Rhein M, Meyer J, Koenecke C, Neumann T, Yang M, Krauter J, von Neuhoff N, Heuser M, Diedrich H, Gohring G, Wilkens L, Schlegelberger B, Ganser A, Baum C. 2009. High-affinity neurotrophin receptors and ligands promote leukemogenesis. Blood 113:2028–2037. 10.1182/blood-2008-05-155200. [DOI] [PMC free article] [PubMed] [Google Scholar]
- 19.Thiele CJ, Li Z, McKee AE. 2009. On Trk—the TrkB signal transduction pathway is an increasingly important target in cancer biology. Clin. Cancer Res. 15:5962–5967. 10.1158/1078-0432.CCR-08-0651. [DOI] [PMC free article] [PubMed] [Google Scholar]
- 20.Polakowski N, Gregory H, Mesnard JM, Lemasson I. 2010. Expression of a protein involved in bone resorption, Dkk1, is activated by HTLV-1 bZIP factor through its activation domain. Retrovirology 7:61. 10.1186/1742-4690-7-61. [DOI] [PMC free article] [PubMed] [Google Scholar]
- 21.Wurm T, Wright DG, Polakowski N, Mesnard JM, Lemasson I. 2012. The HTLV-1-encoded protein HBZ directly inhibits the acetyl transferase activity of p300/CBP. Nucleic Acids Res. 40:5910–5925. 10.1093/nar/gks244. [DOI] [PMC free article] [PubMed] [Google Scholar]
- 22.Hsu SC, Galceran J, Grosschedl R. 1998. Modulation of transcriptional regulation by LEF-1 in response to Wnt-1 signaling and association with beta-catenin. Mol. Cell. Biol. 18:4807–4818. [DOI] [PMC free article] [PubMed] [Google Scholar]
- 23.Cook PR, Polakowski N, Lemasson I. 2011. HTLV-1 HBZ protein deregulates interactions between cellular factors and the KIX domain of p300/CBP. J. Mol. Biol. 409:384–398. 10.1016/j.jmb.2011.04.003. [DOI] [PMC free article] [PubMed] [Google Scholar]
- 24.Belrose G, Gross A, Olindo S, Lezin A, Dueymes M, Komla-Soukha I, Smadja D, Tanaka Y, Willems L, Mesnard JM, Peloponese JM, Jr, Cesaire R. 2011. Effects of valproate on Tax and HBZ expression in HTLV-1 and HAM/TSP T lymphocytes. Blood 118:2483–2491. 10.1182/blood-2010-11-321364. [DOI] [PubMed] [Google Scholar]
- 25.Lemasson I, Nyborg JK. 2001. Human T-cell leukemia virus type I Tax repression of p73beta is mediated through competition for the C/H1 domain of CBP. J. Biol. Chem. 276:15720–15727. 10.1074/jbc.M100131200. [DOI] [PubMed] [Google Scholar]
- 26.Hall MK, Weidner DA, Bernetski CJ, Schwalbe RA. 2014. N-linked glycan site occupancy impacts the distribution of a potassium channel in the cell body and outgrowths of neuronal-derived cells. Biochim. Biophys. Acta 1840:595–604. 10.1016/j.bbagen.2013.10.025. [DOI] [PubMed] [Google Scholar]
- 27.Polakowski N, Han H, Lemasson I. 2011. Direct inhibition of RNAse T2 expression by the HTLV-1 viral protein Tax. Viruses 3:1485–1500. 10.3390/v3081485. [DOI] [PMC free article] [PubMed] [Google Scholar]
- 28.Lemasson I, Polakowski N, Laybourn PJ, Nyborg JK. 2004. Transcription regulatory complexes bind the human T-cell leukemia virus 5′ and 3′ long terminal repeats to control gene expression. Mol. Cell. Biol. 24:6117–6126. 10.1128/MCB.24.14.6117-6126.2004. [DOI] [PMC free article] [PubMed] [Google Scholar]
- 29.Pruunsild P, Kazantseva A, Aid T, Palm K, Timmusk T. 2007. Dissecting the human BDNF locus: bidirectional transcription, complex splicing, and multiple promoters. Genomics 90:397–406. 10.1016/j.ygeno.2007.05.004. [DOI] [PMC free article] [PubMed] [Google Scholar]
- 30.Aoyama M, Asai K, Shishikura T, Kawamoto T, Miyachi T, Yokoi T, Togari H, Wada Y, Kato T, Nakagawara A. 2001. Human neuroblastomas with unfavorable biologies express high levels of brain-derived neurotrophic factor mRNA and a variety of its variants. Cancer Lett. 164:51–60. 10.1016/S0304-3835(00)00715-1. [DOI] [PubMed] [Google Scholar]
- 31.Teng HK, Teng KK, Lee R, Wright S, Tevar S, Almeida RD, Kermani P, Torkin R, Chen ZY, Lee FS, Kraemer RT, Nykjaer A, Hempstead BL. 2005. ProBDNF induces neuronal apoptosis via activation of a receptor complex of p75NTR and sortilin. J. Neurosci. 25:5455–5463. 10.1523/JNEUROSCI.5123-04.2005. [DOI] [PMC free article] [PubMed] [Google Scholar]
- 32.Clerc I, Hivin P, Rubbo PA, Lemasson I, Barbeau B, Mesnard JM. 2009. Propensity for HBZ-SP1 isoform of HTLV-I to inhibit c-Jun activity correlates with sequestration of c-Jun into nuclear bodies rather than inhibition of its DNA-binding activity. Virology 391:195–202. 10.1016/j.virol.2009.06.027. [DOI] [PubMed] [Google Scholar]
- 33.Lemasson I, Lewis MR, Polakowski N, Hivin P, Cavanagh MH, Thebault S, Barbeau B, Nyborg JK, Mesnard JM. 2007. Human T-cell leukemia virus type 1 (HTLV-1) bZIP protein interacts with the cellular transcription factor CREB to inhibit HTLV-1 transcription. J. Virol. 81:1543–1553. 10.1128/JVI.00480-06. [DOI] [PMC free article] [PubMed] [Google Scholar]
- 34.Usui T, Yanagihara K, Tsukasaki K, Murata K, Hasegawa H, Yamada Y, Kamihira S. 2008. Characteristic expression of HTLV-1 basic zipper factor (HBZ) transcripts in HTLV-1 provirus-positive cells. Retrovirology 5:34. 10.1186/1742-4690-5-34. [DOI] [PMC free article] [PubMed] [Google Scholar]
- 35.Modarresi F, Faghihi MA, Lopez-Toledano MA, Fatemi RP, Magistri M, Brothers SP, van der Brug MP, Wahlestedt C. 2012. Inhibition of natural antisense transcripts in vivo results in gene-specific transcriptional upregulation. Nat. Biotechnol. 30:453–459. 10.1038/nbt.2158. [DOI] [PMC free article] [PubMed] [Google Scholar]
- 36.Farh KK, Grimson A, Jan C, Lewis BP, Johnston WK, Lim LP, Burge CB, Bartel DP. 2005. The widespread impact of mammalian microRNAs on mRNA repression and evolution. Science 310:1817–1821. 10.1126/science.1121158. [DOI] [PubMed] [Google Scholar]
- 37.Bensaude O. 2011. Inhibiting eukaryotic transcription: which compound to choose? How to evaluate its activity? Transcription 2:103–108. 10.4161/trns.2.3.16172. [DOI] [PMC free article] [PubMed] [Google Scholar]
- 38.Stoilov P, Castren E, Stamm S. 2002. Analysis of the human TrkB gene genomic organization reveals novel TrkB isoforms, unusual gene length, and splicing mechanism. Biochem. Biophys. Res. Commun. 290:1054–1065. 10.1006/bbrc.2001.6301. [DOI] [PubMed] [Google Scholar]
- 39.Cazorla M, Premont J, Mann A, Girard N, Kellendonk C, Rognan D. 2011. Identification of a low-molecular weight TrkB antagonist with anxiolytic and antidepressant activity in mice. J. Clin. Invest. 121:1846–1857. 10.1172/JCI43992. [DOI] [PMC free article] [PubMed] [Google Scholar]
- 40.Tapley P, Lamballe F, Barbacid M. 1992. K252a is a selective inhibitor of the tyrosine protein kinase activity of the trk family of oncogenes and neurotrophin receptors. Oncogene 7:371–381. [PubMed] [Google Scholar]
- 41.Cole AR. 2012. GSK3 as a sensor determining cell fate in the brain. Front. Mol. Neurosci. 5:4. 10.3389/fnmol.2012.00004. [DOI] [PMC free article] [PubMed] [Google Scholar]
- 42.Sengupta S, Jayaraman P, Chilton PM, Casella CR, Mitchell TC. 2007. Unrestrained glycogen synthase kinase-3 beta activity leads to activated T cell death and can be inhibited by natural adjuvant. J. Immunol. 178:6083–6091. 10.4049/jimmunol.178.10.6083. [DOI] [PubMed] [Google Scholar]
- 43.Yost C, Torres M, Miller JR, Huang E, Kimelman D, Moon RT. 1996. The axis-inducing activity, stability, and subcellular distribution of beta-catenin is regulated in Xenopus embryos by glycogen synthase kinase 3. Genes Dev. 10:1443–1454. 10.1101/gad.10.12.1443. [DOI] [PubMed] [Google Scholar]
- 44.Ding Y, Shen S, Lino AC, Curotto de Lafaille MA, Lafaille JJ. 2008. Beta-catenin stabilization extends regulatory T cell survival and induces anergy in nonregulatory T cells. Nat. Med. 14:162–169. 10.1038/nm1707. [DOI] [PubMed] [Google Scholar]
- 45.Miyazato P, Matsuoka M. 2014. Human T-cell leukemia virus type 1 and Foxp3 expression: viral strategy in vivo. Int. Immunol. 26:419–425. 10.1093/intimm/dxu048. [DOI] [PubMed] [Google Scholar]
- 46.Maroder M, Bellavia D, Meco D, Napolitano M, Stigliano A, Alesse E, Vacca A, Giannini G, Frati L, Gulino A, Screpanti I. 1996. Expression of trKB neurotrophin receptor during T cell development. Role of brain derived neurotrophic factor in immature thymocyte survival. J. Immunol. 157:2864–2872. [PubMed] [Google Scholar]
- 47.Besser M, Wank R. 1999. Cutting edge: clonally restricted production of the neurotrophins brain-derived neurotrophic factor and neurotrophin-3 mRNA by human immune cells and Th1/Th2-polarized expression of their receptors. J. Immunol. 162:6303–6306. [PubMed] [Google Scholar]
- 48.Edling AE, Nanavati T, Johnson JM, Tuohy VK. 2004. Human and murine lymphocyte neurotrophin expression is confined to B cells. J. Neurosci. Res. 77:709–717. 10.1002/jnr.20176. [DOI] [PubMed] [Google Scholar]
- 49.Xin J, Mesnard NA, Beahrs T, Wainwright DA, Serpe CJ, Alexander TD, Sanders VM, Jones KJ. 2012. CD4+ T cell-mediated neuroprotection is independent of T cell-derived BDNF in a mouse facial nerve axotomy model. Brain Behav. Immun. 26:886–890. 10.1016/j.bbi.2012.02.011. [DOI] [PMC free article] [PubMed] [Google Scholar]
- 50.Kerschensteiner M, Stadelmann C, Dechant G, Wekerle H, Hohlfeld R. 2003. Neurotrophic cross-talk between the nervous and immune systems: implications for neurological diseases. Ann. Neurol. 53:292–304. 10.1002/ana.10446. [DOI] [PubMed] [Google Scholar]
- 51.Moalem G, Gdalyahu A, Shani Y, Otten U, Lazarovici P, Cohen IR, Schwartz M. 2000. Production of neurotrophins by activated T cells: implications for neuroprotective autoimmunity. J. Autoimmun. 15:331–345. 10.1006/jaut.2000.0441. [DOI] [PubMed] [Google Scholar]
- 52.Ho R, Eggert A, Hishiki T, Minturn JE, Ikegaki N, Foster P, Camoratto AM, Evans AE, Brodeur GM. 2002. Resistance to chemotherapy mediated by TrkB in neuroblastomas. Cancer Res. 62:6462–6466. [PubMed] [Google Scholar]
- 53.Jaboin J, Hong A, Kim CJ, Thiele CJ. 2003. Cisplatin-induced cytotoxicity is blocked by brain-derived neurotrophic factor activation of TrkB signal transduction path in neuroblastoma. Cancer Lett. 193:109–114. 10.1016/S0304-3835(02)00723-1. [DOI] [PubMed] [Google Scholar]
- 54.Fayard B, Loeffler S, Weis J, Vogelin E, Kruttgen A. 2005. The secreted brain-derived neurotrophic factor precursor pro-BDNF binds to TrkB and p75NTR but not to TrkA or TrkC. J. Neurosci. Res. 80:18–28. 10.1002/jnr.20432. [DOI] [PubMed] [Google Scholar]
- 55.Koshimizu H, Hazama S, Hara T, Ogura A, Kojima M. 2010. Distinct signaling pathways of precursor BDNF and mature BDNF in cultured cerebellar granule neurons. Neurosci. Lett. 473:229–232. 10.1016/j.neulet.2010.02.055. [DOI] [PubMed] [Google Scholar]
- 56.Xu X, Heidenreich O, Nerenberg M. 1996. Role of kinases in HTLV-I transformation. J. Invest. Med. 44:113–123. [PubMed] [Google Scholar]
- 57.Taylor JM, Nicot C. 2008. HTLV-1 and apoptosis: role in cellular transformation and recent advances in therapeutic approaches. Apoptosis 13:733–747. 10.1007/s10495-008-0208-7. [DOI] [PMC free article] [PubMed] [Google Scholar]
- 58.Fang H, Chartier J, Sodja C, Desbois A, Ribecco-Lutkiewicz M, Walker PR, Sikorska M. 2003. Transcriptional activation of the human brain-derived neurotrophic factor gene promoter III by dopamine signaling in NT2/N neurons. J. Biol. Chem. 278:26401–26409. 10.1074/jbc.M211539200. [DOI] [PubMed] [Google Scholar]
- 59.Liu QR, Walther D, Drgon T, Polesskaya O, Lesnick TG, Strain KJ, de Andrade M, Bower JH, Maraganore DM, Uhl GR. 2005. Human brain derived neurotrophic factor (BDNF) genes, splicing patterns, and assessments of associations with substance abuse and Parkinson's disease. Am. J. Med. Genet. B Neuropsychiatr. Genet. 134B:93–103. 10.1002/ajmg.b.30109. [DOI] [PubMed] [Google Scholar]
- 60.Thebault S, Basbous J, Hivin P, Devaux C, Mesnard JM. 2004. HBZ interacts with JunD and stimulates its transcriptional activity. FEBS Lett. 562:165–170. 10.1016/S0014-5793(04)00225-X. [DOI] [PubMed] [Google Scholar]
- 61.Kuhlmann AS, Villaudy J, Gazzolo L, Castellazzi M, Mesnard JM, Duc Dodon M. 2007. HTLV-1 HBZ cooperates with JunD to enhance transcription of the human telomerase reverse transcriptase gene (hTERT). Retrovirology 4:92. 10.1186/1742-4690-4-92. [DOI] [PMC free article] [PubMed] [Google Scholar]
- 62.Deshane J, Kim J, Bolisetty S, Hock TD, Hill-Kapturczak N, Agarwal A. 2010. Sp1 regulates chromatin looping between an intronic enhancer and distal promoter of the human heme oxygenase-1 gene in renal cells. J. Biol. Chem. 285:16476–16486. 10.1074/jbc.M109.058586. [DOI] [PMC free article] [PubMed] [Google Scholar]
- 63.Li M, Kesic M, Yin H, Yu L, Green PL. 2009. Kinetic analysis of human T-cell leukemia virus type 1 gene expression in cell culture and infected animals. J. Virol. 83:3788–3797. 10.1128/JVI.02315-08. [DOI] [PMC free article] [PubMed] [Google Scholar]