

ABSTRACT
The cGAS/STING DNA sensing complex has recently been established as a predominant pathogen recognition receptor (PRR) for DNA-directed type I interferon (IFN) innate immune activation. Using replication-defective adenovirus vectors and replication-competent wild-type adenovirus, we have modeled the influence of the cGAS/STING cascade in permissive human cell lines (A549, HeLa, ARPE19, and THP1). Wild-type adenovirus induced efficient early activation of the cGAS/STING cascade in a cell-specific manner. In all responsive cell lines, cGAS/STING short hairpin RNA (shRNA) knockdown resulted in a loss of TBK1 and interferon response factor 3 (IRF3) activation, a lack of beta interferon transcript induction, loss of interferon-dependent STAT1 activation, and diminished induction of interferon-stimulated genes (ISGs). Adenoviruses that infect through the coxsackievirus-adenovirus receptor (CAR) (Ad2 and Ad5) and the CD46 (Ad35) and desmoglein-2 (Ad7) viral receptors all induce the cGAS/STING/TBK1/IRF3 cascade. The magnitude of the IRF3/IFN/ISG antiviral response was strongly influenced by serotype, with Ad35>Ad7>Ad2. For each serotype, no enhancement of viral DNA replication or virus production occurred in cGAS or STING shRNA-targeted cell line pools. We found no replication advantage in permissive cell lines that do not trigger the cGAS/STING cascade following infection. The cGAS/STING/TBK1/IRF3 cascade was not a direct target of viral antihost strategies, and we found no evidence that Ad stimulation of the cGAS/STING DNA response had an impact on viral replication efficiency.
IMPORTANCE This study shows for the first time that the cGAS DNA sensor directs a dominant IRF3/IFN/ISG antiviral response to adenovirus in human cell lines. Activation of cGAS occurs with viruses that infect through different high-affinity receptors (CAR, CD46, and desmoglein-2), and the magnitude of the cGAS/STING DNA response cascade is influenced by serotype-specific functions. Furthermore, activation of the cGAS cascade occurred in a cell-specific manner. Activation of the cGAS/STING response did not impact viral replication, and viral immune evasion strategies did not target the cGAS/STING/TBK1/IRF3 cascade. These studies provide novel insight into the early innate recognition response to adenovirus.
INTRODUCTION
Adenovirus (Ad) infections contribute to respiratory disease, conjunctivitis, and gastroenteritis in the general population (1). In immunocompromised individuals, disseminated adenovirus infection can contribute to severe pathology and mortality (2, 3). The family Adenoviridae includes 57 serotypes of human viruses, divided into seven species (species A to G). All Ads are nonenveloped double-stranded (∼35-kb) DNA viruses packaged into icosahedral capsids. Differences in capsid proteins confer serotype antigenic specificity, distinct pathways for viral entry, and differences in viral tropism. Serotype 2 and 5 species C viruses have been heavily investigated at the levels of viral gene function, gene regulation, replication, and host-virus interaction. Due to the depth of reagents available from early Ad studies, gene therapy, vaccine development, and oncolytic Ad vector development were originally based on the Ad5 serotype.
Both wild-type (wt) Ad vectors (AdVs) and recombinant replication-defective AdVs (rAdVs) are highly immunogenic, inducing both the innate and adaptive arms of the immune response. In murine models, rAdV uptake by immune sentinel cells such as macrophages and dendritic cells (DCs) contributes to the activation of both immune response arms (4–8). Studies characterizing the host cell response to adenovirus infection are not restricted to antigen-presenting cells (APCs). Nearly 50 years ago (9, 10), induction of type I interferon (IFN) was identified as a key element of the antiviral response to adenovirus in chick fibroblasts. Subsequent studies found a serotype-specific influence on the magnitude of IFN induction (11). The adenovirus fiber protein is a high-affinity ligand, which binds a cellular membrane receptor. Most Ads bind to the coxsackievirus-adenovirus receptor (CAR) (12), but CD46 is the high-affinity receptor targeted by subgroup 1 species B viruses (13), and desmoglein-2 binds fiber of the subgroup 2 species B viruses (14). Recent studies have indicated that differences in fiber/receptor binding influence the viral endocytic import pathway (15) and antiviral activation levels (16).
The cellular response to adenovirus infection involves at least two stages. The primary response includes direct virus-host cell interactions that contribute to an antiviral state featuring transcriptional activation of type I interferons. Following virus binding and internalization, Ad detection by the host cell is a critical first step in the primary response. In vitro studies using nonpermissive murine APCs have shown that rAdV induction of type I interferon occurs through a cytosolic viral DNA (vDNA)-dependent recognition cascade (17−20). One study using short hairpin RNA (shRNA) knockdowns in nonpermissive murine cell lines (21) identified the DNA sensor for viral detection as the newly discovered cyclic GMP-AMP synthase (cGAS) (22). Upon DNA binding, activated cGAS generates a novel cyclic guanine-adenine dinucleotide (cGAMP) (22−24). Cytosolic cGAMP binds to the STING adaptor protein (25−27), which translocates from the endoplasmic reticulum (ER) to the Golgi membrane (28, 29). During translocation, STING complexes with tank binding kinase 1 (TBK1) (28), and TBK1 (19, 30) phosphorylates cytosolic interferon response factor 3 (IRF3). Phospho-IRF3 dimerizes and translocates to the nucleus (31, 32), where IRF3-responsive genes, such as beta interferon (33), are transcriptionally activated. In addition to the cGAS DNA sensor, other DNA sensors (IFI16, DDx41, and Toll-like receptor 9 [TLR9]) have been characterized as general DNA sensors contributing to type I interferon induction (17, 34–42). TLR9 is involved in the detection of adenovirus in murine plasmacytoid DCs (pDCs) (17, 39). It has also been associated with interferon induction in human cell lines (41, 43). The secondary antiviral response includes translation of induced transcripts, functional consequences of newly synthesized cellular proteins, secretion of chemokines and cytokines, and autocrine/paracrine activation of secondary signaling pathways (type I IFN, tumor necrosis factor [TNF], interleukin-6 [IL-6], and IL-1 as examples). Both primary and secondary antiviral response cascades vary in a cell-specific manner.
Adenovirus gene products (E1A, E1B, E3, E4, and VA) suppress the antiviral response to infection (reviewed in references 44−47). Established viral immune evasion strategies primarily target the secondary arm of the antiviral immune response. E1A blocks the transcriptional activation of interferon-stimulated gene (ISG)-responsive transcripts (48–51), E1B blocks the expression of IFN-induced transcripts (52–54), E3 targets TNF-mediated pathways of cell death (55), and VA RNA transcripts block translational inhibition mediated by activated protein kinase R (PKR) phosphorylation of eucaryotic initiation factor 2B (eIF2B) (56, 57). Genome-wide chromatin immune precipitation (ChIP) and transcriptome studies provided comprehensive insight into how adenovirus infection alters epigenetic host cell factor distribution (58−60) and the host cell transcriptome (61−63), including the population of interferon- and IRF3-responsive genes. Ad immune evasion strategies targeting the primary response cascade have not been well established. One study found that transient plasmid overexpression of E1A suppressed IRF3-dependent type I IFN induction (64).
In the present study, we have established the cGAS DNA recognition cascade as the dominant Ad-activated pathway leading to an IRF3/IFN/ISG antiviral response in permissive human cell lines. We have found that the cGAS/STING/TBK1/IRF3 cascade is not targeted or suppressed by viral immune evasion strategies. In the cell lines examined, induction of the cGAS/STING cascade and activation of secondary pathways are managed by the virus in a manner that does not compromise viral DNA replication.
MATERIALS AND METHODS
Viruses.
Ad5CiG (65) was previously described and grown large scale in 293T cells. Wild-type Ad2, Ad7A, and Ad35 were obtained from the ATCC. A dl309 stock was provided by Thomas Shenk. Viral lysates were expanded to a large scale in HeLa or A549 cells. All viruses were purified by 2 rounds of CsCl banding, dialysis against 4% sucrose–50 mM Tris (pH 8.0)–2 mM MgCl2, and stored at −80°C. Viral particle numbers were quantified by spectrophotometric detection of intact virions at an optical density at 260 nm (OD260) (1012 particles/OD260 unit).
Cells.
HeLa, A549, and ARPE19 cells were obtained from the ATCC. THP1 cells were obtained from Xiaoxing Ma. HeLa and ARPE19 cells were maintained in Dulbecco's modified Eagle's medium (DMEM) (Cellgro) with 10% fetal bovine serum (FBS) (characterized; HyClone), THP1 cells were maintained in RPMI with 10% FBS, and A549 cells were maintained in F-12K medium with 10% FBS. All media were supplemented with 1% penicillin-streptomycin (Gibco).
Cell treatment.
For protein cell lysate assays, 2.5 × 10⁵ cells per well were plated in 1 ml medium in 12-well plates 24 h before treatment. For RNA cell harvest assays, 106 cells per well were plated in 2 ml medium in 6-well plates 24 h before treatment. At time zero, virus was diluted in serum-free DMEM, and the indicated numbers of particles/cell were plated in a volume of 0.5 ml/12-well plate or 1.0 ml/6-well plate. After 1 h, serum-containing medium was added to a final volumes of 1 ml or 2 ml, respectively. For all experiments involving THP1 cells, cells were plated at 5 × 10⁵ or 2 × 10⁶ cells per 12-well or 6-well plate, respectively, and differentiated by treatment with 50 ng/ml phorbol 12-myristate 13-acetate (PMA) for 6 h. PMA-containing medium was removed, and cells were washed twice with phosphate-buffered saline (PBS) and allowed to recover for 48 h in fresh medium prior to virus treatment to reduce the residual stress response from PMA treatment.
Short hairpin knockdown.
TRC pLKO.1 lentiviral vectors (Thermo-Dharmacon) targeting human cGAS [TRC MB21D1 gene set, catalog number RHS4533-EG115004 cGAS1,2,3 TRCN0000(128310)(146282)(149984)] and STING [TRC TMEM173 gene set, catalog number RHS4533-EG340061 STING1,2,3,4 TRCN0000(161052)(163296)(161345)(160895)] were used. Short hairpin constructs for scrambled (SCR-11 and SCR-13) were previously described (66). The final sequenced constructs were used to generate lentiviral particles in 293T cells following cotransfection with vesicular stomatitis virus G protein (VSVG) and Δ8.9 packaging plasmids according to standard protocols. Cells targeted for knockdown were infected with short hairpin lentivirus and at 48 h postinfection were selected with 4 μg/ml puromycin (Sigma) for approximately 4 days, at which point there was no survival of control cells lacking the puromycin cassette. The puromycin-selected short hairpin cells were rested for 2 days in the absence of puromycin prior to use in the experiments described here.
Western blots.
Whole-cell extracts were prepared by washing cells twice with ice-cold PBS and incubating them in lysis buffer (50 mM Tris [pH 7.5], 150 mM NaCl, 1 mM EDTA, 1% NP-40) with the addition of Phosphatase Inhibitor Cocktails 1 and 2 (catalog numbers P2850 and P5726, respectively; Sigma) and protease inhibitors (30 mM sodium fluoride, 1 mM phenylmethylsulfonyl fluoride, 10 μg/ml aprotinin, 10 μg/ml leupeptin, 1 μg/ml pepstatin, 1 mM benzamidine) for 30 min at 4°C on a rocking platform before scraping and transferring to tubes. The lysates were cleared by centrifugation at 13,000 × g for 20 min at 4°C, and protein quantification was performed with the DC protein assay kit (Bio-Rad Laboratories).
For Western blot analysis, 20 μg total protein was separated by using standard 10% SDS-polyacrylamide gels and transferred onto polyvinylidene difluoride (PVDF) membranes (Immobilon P; Millipore). All blots were blocked in 5% skim milk in Tris-buffered saline (TBS)–Tween (0.1%) at room temperature for 1 h. Phospho-IRF3 (Ser396) (catalog number 4947), phospho-STAT1 (58D6) (Tyr701) (catalog number 9167), beta-actin (catalog number 4967), total IRF3 (catalog number 4302), STING (catalog number 3337), TBK1 (catalog number 3503), pNF-kBp65 (Ser536) (catalog number 3033), pTBK1 (Ser172) (catalog number 5483), green fluorescent protein (GFP) (catalog number 2956), and horseradish peroxidase (HRP)-linked anti-rabbit IgG (catalog number 7074) antibodies were obtained from Cell Signaling. All primary antibodies were used at a dilution of 1:3,000 in 5% bovine serum albumin (BSA) in TBS. The HRP-linked secondary antibody was diluted 1:4,000 in 5% skim milk in Tween-TBS. Detection was performed with the Luminator Crescendo Western HRP substrate (Millipore).
SYBR green I RT-qPCR.
Total cellular mRNA was isolated by using RNAzol (RT) (Molecular Research Center) according to the manufacturer's instructions. For RT-quantitative PCR (qPCR), a two-step protocol was employed: first, cDNA was synthesized from 2 μg total RNA in a volume of 20 μl by using random hexamer primers with the Maxima first-strand cDNA synthesis kit (Fermentas), and second, amplifications were carried out in a total volume of 15 μl by using Maxima SYBR green/ROX qPCR master mix (Fermentas) in an Applied Biosystems Prism 7900H sequence detection system with SDS 2.1 software. Cycles consisted of an initial incubation step at 95°C for 10 min; 40 cycles at 95°C for 15 s, 60°C for 30 s, and 72°C for 30 s; and a melting-curve analysis cycle. Data acquisition was performed during the extension step. All determinations were performed in technical triplicates. Nontemplate and no-RT controls were run with every assay and had cycle thresholds (CTs) that were significantly higher than those of experimental samples or were undetermined. The relative abundance of each mRNA was calculated by the ΔΔCT method (67, 68), with normalization to the Tata binding protein (TBP) expression level and with standardization to one reference sample, as indicated. For comparisons between cell lines, or in late-stage virus infections, glyceraldehyde-3-phosphate dehydrogenase (GAPDH) was used as the normalization standard. Sequences of primers are available upon request.
qPCR viral DNA replication yield and infectious-genome assays. (i) Binding/uptake/replication assays.
For each assay, the specific cell type was seeded at 2 × 10⁵ cells/well in 12-well plates in 1 ml medium. Twenty-four hours after plating, medium was removed, and 1.0 ml serum-free medium containing virus corresponding to the desired number of particles/cell was added. Virus incubations were allowed to progress for the indicated times (3 or 6 h), after which virus-containing medium was removed and cells were washed twice with serum-free medium. Cells were then either (i) harvested by using lysis and a total DNA salting-out protocol (69) or (ii) incubated for an extended replication period by adding 1.0 ml serum-containing medium (cells harvested as described above at the indicated times). Following DNA purification and resuspension in 100 μl H2O, OD260/280 values for DNA concentrations were determined by using a Nanodrop instrument. Twenty nanograms of sample DNA in a final reaction volume of 15 μl, based on the Maxima SYBR green/ROX qPCR master mix (Fermentas) system, was used for each assay. Serotype-specific and cellular control primers were used to characterize each DNA sample. Normalization to the cellular genomic standard was used to derive the relative viral DNA yield per host genome. Assays were carried out with an Applied Biosystems Prism 7900H sequence detection system with SDS 2.1 software. Cycles consisted of an initial incubation step at 95°C for 10 min; 40 cycles at 95°C for 15 s, 60°C for 30 s, and 72°C for 30 s; and a melting-curve analysis cycle. Data acquisition was performed during the extension step. Data points represent the averages of data from biological and technical triplicates.
(ii) Infectious-genome titers.
Infectious-genome titers were determined according to the method of Gallaher and Berk (70). Briefly, dilutions of purified virus or viral lysates in 1 ml serum-free medium were used to infect 2 × 10⁵ HeLa cells in 12-well plates. Infections with dilutions of a known control standard viral stock were carried out in parallel to establish a standard curve. At 6 h postinfection, cells were washed, nuclei were harvested and washed, and total DNA purification was performed according to a standard DNA salting-out protocol (69). qPCR of genomic and viral DNA (as described above) harvested from the control standard dilutions established a standard curve for particles/infectious genome (∼10 Ad2 particles/infectious genome). Infectious-genome titers from unknown samples were derived from standard-curve values and expressed as total yields.
Statistical analysis.
Data were expressed as means ± standard errors of the means. Statistical analysis was performed with Student's t test. A P value of <0.05 was considered significant.
RESULTS
Dose-dependent activation of the cGAS/STING/TBK1/IRF3 cascade in HeLa cells.
HeLa cells, an aneuploid human papillomavirus (HPV)-transformed cervical carcinoma cell line, are known to undergo an interferon/ISG induction response following adenovirus infection (49). To establish the Ad pathogen recognition receptor (PRR) cascade involved in the HeLa cell IFN/ISG induction response, cells were infected with increasing amounts of Ad5CiG, a first-generation Ad5 vector compromised in E1 and E3 function with a CMV-CATiresGFP reporter cassette located in the E1 region (65, 71). By using a replication-defective E1-deficient vector, we assessed host cell antiviral recognition responses absent established E1 immune evasion functions. Protein lysates harvested at 6 and 24 h postinfection were characterized by Western analysis (Fig. 1A). Using anti-GFP antibody, we found a dose-dependent accumulation of GFP in lysates at 6 h. During this time frame, the virus effectively entered the cell, viral genomes were delivered to the nucleus, and viral genome-derived mRNA was effectively translated.
FIG 1.
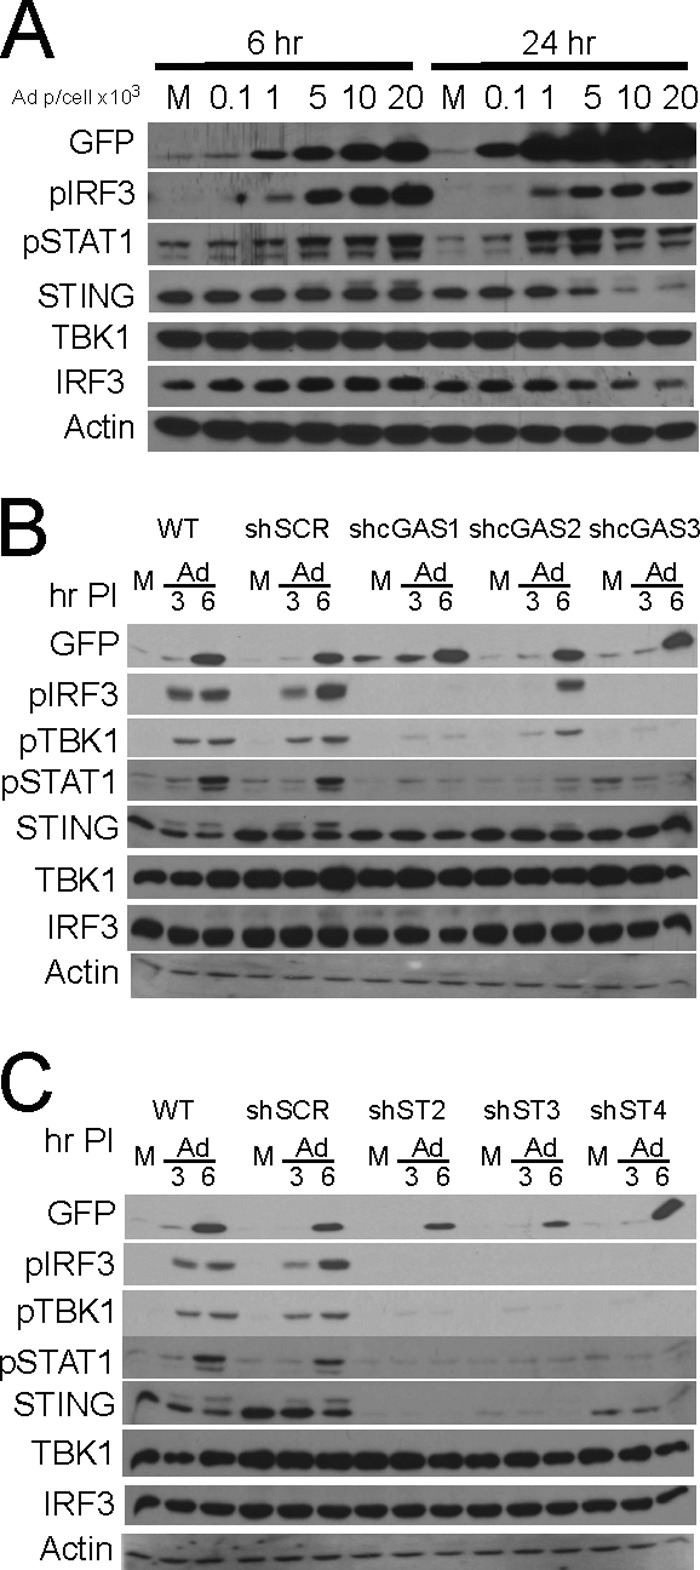
Adenovirus activation of cGAS/STING/TBK1/IRF3 in HeLa cells. (A) Western blot analysis of lysates harvested 6 or 24 h after mock (M) or Ad5CiG infection of HeLa cells probed with the indicated antibodies. (B) Western blot analysis of lysates harvested 3 and 6 h after Ad5CiG infection (5,000 particles [p]/cell) of HeLa cells or HeLa cells treated with shRNA lentiviral vectors targeting cGAS (shcGAS1, shcGAS2, and shcGAS3) and a scramble control (shSCR) following puromycin selection. (C) Same as panel B, using three stable STING shRNA knockdown cell line pools. PI, postinfection.
Detection of IRF3 phosphorylation using a phosphospecific (pSer396IRF3) antibody following virus infection provides an early Ad recognition response activation marker. AdV infection results in a dose-dependent induction of pSer396IRF3 (6-h lysates) (Fig. 1A). STING is a cytosolic adaptor protein that functions upstream of IRF3 in nucleic acid pathogen recognition response pathways (21, 22, 29, 66). With increasing doses of Ad5CiG, a higher-molecular-weight form of the STING adaptor protein was detected, and at later time points, STING protein degradation was observed (Fig. 1A). In other models, activation of the cGAS cascade (72) generates a modified form of STING, which is subsequently degraded. We found that a STING modification-and-degradation phenotype results from rAdV infection of HeLa cells.
A consequence of activating the primary PRR is induction and translation of cellular transcripts, particularly type I interferons. Through paracrine/autocrine signaling, interferon binding to type I IFN receptors activates the Jak-STAT pathway, resulting in the phosphorylation of STAT1 and -2. Phospho-STAT1/2 combined with IRF9 to form the interferon-stimulated gene factor 3 (ISGF3) transcription factor complex, which contributes to the transcriptional activation of ISGs (73). pTyr701STAT1 provides a secondary response marker for autocrine/paracrine interferon signaling. AdV infection of HeLa cells resulted in a dose-dependent accumulation of pTyr701STAT1 (Fig. 1A). AdV infection of HeLa cells resulted in the activation of an IRF3 primary response cascade and an IFN-α/β receptor (IFNAR)/Jak-STAT secondary response cascade.
These results are consistent with a DNA recognition response predicted to be dependent on the cGAS DNA sensor. We used lentiviral shRNA vectors targeting cGAS or STING to establish stable HeLa cell line pools knocked down in cGAS or STING mRNA (Fig. 1B and C, respectively, and 2A). Similar levels of GFP indicated that virus transduction was not influenced by lentiviral integrants. Each of the three cGAS shRNA cell line pools revealed compromised primary recognition responses, where sh-cGAS1 and -3 were essentially nonresponsive to viral infection at the levels of pSer396IRF3, pSer172TBK1, and pTyr701STAT1. Similarly, infection of each STING shRNA knockdown cell line pool revealed compromised activation of primary recognition response markers (IRF3 and TBK1) as well as the secondary response marker STAT1. In all cases, the sh-SCR control cell line pools were as responsive as or more responsive than wild-type HeLa cells. In the HeLa shSCR-13 pool, shRNA expression may contribute to a heightened priming of the IRF3/IFN/ISG cascade in an unknown manner. These results indicate that cGAS/STING recognition of rAdV in permissive human cells can function as the predominant pathway leading to IRF3 activation.
FIG 2.

Impact of STING and cGAS shRNA knockdown on Ad5CiG induction of antiviral response transcripts in HeLa cells. (A) Two-step RT-qPCR of mRNA isolated from wt HeLa cells or HeLa cells treated with shRNA lentiviral vectors targeting STING (shST2), cGAS (shcGAS1), and the scramble control (shSCR), using primers specific to TBK1, STING, and cGAS mRNAs. All samples were normalized to TBP values by using the ΔΔCT method, as described in Materials and Methods; mock scramble sample 1 was assigned an arbitrary value of 100. All RT-qPCR assays included biological triplicates as well as technical triplicates of each sample. The numbers above the bars indicate the unnormalized average CT as an indicator of relative abundance in mock-infected wt HeLa cells. (B) RT-qPCR of RNA isolated from mock- or Ad5CiG (5,000 particles/cell)-infected wt HeLa, sh-SCR, sh-ST2, and sh-cGAS1 shRNA knockdown cell pools harvested at 6 h postinfection. PCR primers correspond to IFN-β, ISG15, ISG54, IL-1β, TNF-α, IL-6, CXCL10, CCL5, and ISG56. Normalizations were carried out as described above.
We next determined the influence of sh-cGAS or sh-STING knockdown on AdV induction of IRF3- and IFN-responsive transcripts using RT-qPCR (Fig. 2B). All samples were normalized to TBP mRNA levels by using ΔΔCT method, where the value for mock SCR sample 1 was assigned an arbitrary value of 100. As a quantitative reference, in Fig. 2B, the unnormalized average CT of mock-infected HeLa cells is indicated above the expression bar (Δ1 log ∼3 CTs and CTs of >30 are relatively low-abundance transcripts). In comparison to 6-h-infected wt or sh-SCR HeLa cell line pools, RNAs isolated from infected sh-cGAS or sh-STING cell line pools were strongly diminished in IFN-β, ISG54, ISG15, CXCL10 (IP-10), and CCL5 (RANTES) transcripts. The modest induction of the inflammatory transcript IL-1β, TNF-α, or IL-6 was variably influenced by the knockdown of cGAS or STING. Although the shRNA knockdown efficiency is not 100% (Fig. 2A), the data indicate that the cGAS DNA sensor cascade makes an essential contribution to the detection of rAdV and induction of cellular antiviral immune response transcripts in HeLa cells.
cGAS/STING activation by wild-type adenovirus.
Previous studies have identified a number of strategies employed by adenovirus to suppress the antiviral immune response (reviewed in references 44−47). To determine if the cGAS/STING/TBK1/IRF3 cascade is directly targeted and suppressed by the expression of immediate early or early viral gene products, HeLa cells were infected with increasing concentrations of wt Ad2, Ad5CiG, and Ad5dl309. Ad5dl309 (74, 75) is deleted in E3, replicates in HeLa cells like wt Ad5, and serves as the base viral backbone for many E1/E3-deleted Ad5 vectors. Following infection, lysates at 6 and 24 h were harvested and characterized by Western analysis (Fig. 3A). Each virus led to a dose-dependent activation of the primary response markers TBK1 and IRF3. Each infection had a similar impact on STING modification and degradation. Therefore, the primary Ad recognition response was intact following infection by wt virus at 6 h postinfection. Furthermore, activation of the secondary response marker STAT1 was not compromised in cells infected by wt adenovirus. At 24 h postinfection, persistent phosphorylated IRF3 and STAT1 were detected in each viral infection, but phospho-TBK1 was diminished in cells infected with Ad2 or dl309.
FIG 3.

Wild-type adenovirus activation of cGAS/STING/TBK1/IRF3 impacts antiviral transcripts but not viral replication. (A) HeLa cells were infected with Ad2, Ad5CiG, or Ad5dl309 at the indicated doses; cell lysates harvested at 6 and 24 h postinfection were analyzed by Western analysis as described in the text. (B) RT-qPCR of RNA isolated from mock-infected or wt Ad2-, Ad5CiG-, or Ad5dl309-infected (5,000 particles/cell) HeLa cells harvested at 6 and 24 h postinfection. (C) qPCR quantitation of Ad2 DNA present in HeLa, HeLa sh-SCR, sh-STING, and sh-cGAS cells harvested at 3, 24, and 48 h postinfection with 50 or 500 particles/cell. A wt 3-h sample infected with 500 particles/cell was assigned an arbitrary value of 1. All vDNA values were normalized to that of a cellular DNA (IFN-β) control.
To assess the impact of wt virus infection on antiviral response transcripts, RNA at 6 and 24 h postinfection was isolated from Ad2, Ad5CiG, and dl309 infections (5,000 particles/cell) for RT-qPCR quantitation (Fig. 3B). At 6 h, antiviral transcripts were induced in wild-type virus-infected cells, and levels were frequently higher than those observed in Ad5CiG-infected cells. The influence of wt virus infection was apparent in RNA at 24 h postinfection. Induced transcript levels from Ad5CiG-infected cells were sustained or increased compared to those in the 6-h RNA pool. RNA from Ad2- or dl309-infected cells at 24 h presented a more complex RNA phenotype. One interesting and unexpected finding was that IFN-β and CCL5 (RANTES) steady-state mRNA levels at 24 h postinfection were increased over the levels at 6 h. Furthermore, levels of IFN-β mRNA following infection by wt viruses were higher than those found following infection by Ad5CiG. IFN mRNAs are unique polymerase II transcripts that do not undergo splicing (similar to Ad protein IX mRNA). This novel aspect of their biology may impact stability/expression following wt virus infection in HeLa cells. However, the levels of the remaining ISGs, ISG15, ISG54, ISG56, and CXCL10 (IP-10), were strongly decreased. Levels of the inflammatory transcripts IL-6, TNF-α, and IL-1β were below uninfected baseline levels. Consistent with data from previous Ad transcriptome studies (62, 63), as wt infection progressed into a late stage, the pool of antiviral mRNA transcripts underwent complex changes in abundance patterns.
To determine if the activation of the cGAS/STING cascade has any effect on viral DNA replication, an Ad2 replication time course was carried out in wt, sh-SCR, sh-STING, or sh-cGAS HeLa cell line pools (Fig. 3C). Cells were infected with a low input of 50 or 500 particles of virus/cell. In this assay, medium (and free virus) was removed at 3 h postinfection, and cells were washed twice with serum-free medium. Cells at the 3-h time point were harvested for total DNA by directly treating cells with lysis buffer. These samples provided a virus binding/uptake no-replication control. Medium was added back to the remaining samples until they were harvested at 24 or 48 h postinfection. qPCR quantitation of viral DNA (normalized to the value for a cellular IFN DNA control) was used to assess replication efficiency. Each HeLa cell line took up similar amounts of virus, and increasing viral doses gave proportionate increases in bound/internalized virus (Fig. 3C). DNA replication yields from assays at 24 and 48 h postinfection were similar when wt HeLa, sh-SCR, sh-cGAS, and STING knockdown cell lines were compared. To confirm that DNA replication yields were consistent with infectious-virus yields, cell lysates were harvested at 24 h postinfection (500 particles of Ad2/cell), and by using the method of Gallaher and Berk (70), the total infectious-genome yields were found to be 1 × 10⁹ ± 0.5 × 10⁹ for each cell line pool (data not shown). The data indicate that the cGAS-induced response does not impede wild-type adenovirus replication or virion production.
Cell line-specific induction of the cGAS pathway.
Permissivity to adenovirus can vary in a cell-specific manner. To determine if adenovirus detection by cGAS functions in other human cell types, an Ad5CiG dose-response activation profile was carried out with A549 alveolar epithelial carcinoma cells, ARPE19 retinal pigment epithelial (RPE) cells, and PMA-differentiated THP1 monocytic leukemia cells (Fig. 4A). Although GFP expression levels in A549 and ARPE19 cells were comparable to those found in HeLa cells, extremely low-level or no activation of the cGAS/STING/TBK1/IRF3 pathway occurred in these cells. Compared to A549, HeLa, or RPE cells, PMA-differentiated THP1 cells were resistant to Ad5CiG infection. Low levels of GFP and very weak TBK1, IRF3, and STAT1 phosphorylation were observed in THP1 cells at 6 h postinfection. However, in lysates at 24 h, levels of GFP had increased, and phosphorylation of both TBK1 and IRF3 was evident. A high basal level of pSTAT1 was found in PMA-differentiated THP1 cells, but pSTAT1 levels were increased in Ad5CiG-infected THP1 cell lysates at 24 h.
FIG 4.

Cell-specific response to Ad infection. (A) Western analysis of lysates harvested 6 or 24 h after mock or Ad5CiG infection of A549, ARPE19, or THP1 cells with increasing amounts of viral particles by using the indicated antibodies. (B) RT-qPCR of steady-state mRNA from uninfected A549, HeLa, ARPE19, and THP1 cells to assess basal levels of transcripts associated with antiviral nucleic acid signaling pathways. Values for all samples were normalized to GAPDH values by using the ΔΔCT method, as described in Materials and Methods; HeLa sample 1 was assigned an arbitrary value of 100. The numbers above the HeLa bars are unnormalized average CT values, indicating relative transcript abundance (a CT of 30 indicates relatively low abundance; higher numbers equate to decreasing abundance).
One simple explanation for cell-specific differences in the IRF3/IFN/ISG antiviral response to rAdV is varied levels of cellular transcripts and gene products involved in nucleic acid sensing pathways. Total mRNA harvested from each cell line was characterized by RT-qPCR to determine the abundance of transcripts corresponding to the DNA sensor proteins cGAS, TLR9, IFI16, DDx41, and Aim2; to the adaptor proteins STING, TRIF, MyD88, and MAVS; and to TBK1 and STAT1 (Fig. 4B). For normalization of all mRNA transcripts, one HeLa cell biological sample was assigned a value of 100. The unnormalized average CT for HeLa cell transcripts is shown as a reference indicator for transcript abundance. In A549 cells, comparatively low levels of both cGAS and STING may contribute to the lack of an antiviral response following infection. In RPE cells, the cGAS mRNA level was a log value below the levels found in HeLa cells, but STING levels were high. There were several other notable differences in steady-state transcript levels between cell lines: low levels of MyD88, TLR9, and STAT1 in HeLa cells; low levels of Aim2 in all cell lines except THP1; and comparatively high levels of TLR9 in THP1 cells. At the level of nucleic acid sensor component transcripts, THP1 cells are best equipped to respond to virus infection.
Viral replication in cell lines with distinct Ad primary response patterns.
To determine if cell line differences in the PRR activation profile influence virus replication, an Ad2 replication assay was carried out in all cell lines (Fig. 5A). Levels of viral genome uptake in A549, HeLa, and RPE cells (6-h time point) were closely matched, with correspondingly similar levels of viral DNA replication (24-h time point). For these cell lines, which were similar in virus uptake and DNA replication, an infectious-genome-yield assay was carried out (infecting similar cell numbers with 500 particles/cell). After 24 h, total cell lysates were harvested, and the yield of infectious genomes from each lysate was determined (Fig. 5B). Although similar, differences in virus yields were not found to strictly correlate with the IRF3/IFN response associated with each cell line. The absence of a cGAS primary response did not translate into higher levels of DNA replication or virus production.
FIG 5.

The cell line-specific response has a minimal impact on Ad2 replication efficiency. (A) Determination of Ad2 DNA uptake and DNA replication yield in A549, HeLa, RPE, and THP1 cell lines infected with 500 particles/cell (for THP1 cells, an additional dose of 5,000 particles/cell was included). HeLa 6-h sample 1 was assigned an arbitrary value of 1. (B) Average total yield of infectious Ad2 genomes (3 biological samples) generated from lysates of A549, HeLa, and RPE cells infected with 500 particles/cell for 24 h. Infectious viral genomes present in each lysate of HeLa cells were quantified as described in Materials and Methods (70) by determining nuclear-associated vDNA at 6 h postinfection compared to a stock of Ad2 (12 particles/infectious viral genome). (C) Western analysis of lysates harvested 24 h after mock or Ad5CiG infection of THP1 sh-SCR, cGAS1, and cGAS3 knockdown cell line pools infected with the indicated levels of Ad5CiG. (D) qPCR quantitation of Ad2 replication in THP1 and THP1 cGAS knockdown cell lines harvested at the indicated time points following infection with 500 particles/cell. sh-SCR 6-h sample 1 was assigned an arbitrary value of 1.
THP1 cells express high levels of antiviral sensor components (Fig. 4B); they take up 10-fold less viral DNA and are largely nonpermissive to Ad2 (Fig. 5A). Low levels of the CAR on human monocytic cells limit Ad5/2 transduction efficiency (76). Although the Ad response was weak and delayed, we asked if the Ad response detected in THP1 cells at 24 h postinfection was dependent on cGAS. We established cGAS shRNA knockdown cell lines (efforts to generate an efficient STING knockdown were unsuccessful). Using the sh-cGAS and sh-SCR cell line pools, a 24-h high-dose virus infection assay was carried out (Fig. 5C). The dose-dependent activation of TBK1, IRF3, and STAT1 was detected in the control sh-SCR THP1 cell line pool. Levels of STING are extremely high in THP1 cells and minimally affected by AdV infection. In contrast to the sh-SCR control, TBK1, IRF3, and STAT1 activation were strongly reduced in both cGAS knockdown cell pools. The delayed antiadenoviral activation response in THP1 cells was dependent on cGAS recognition of viral DNA.
An extended replication yield assay was carried out with THP1, sh-SCR, and sh-cGAS1,2,3 cell line pools to determine if the cGAS response to Ad contributes to the delayed/compromised viral DNA replication found in THP1 cells. For all THP1 cell pools, the viral DNA yield at 24 h was lower than that detected at 6 h postinfection (Fig. 5D). In THP1 cells, a significant fraction of viral genomes were lost or degraded. When the viral DNA yield was determined at 48 and 72 h, Ad2 replication occurred in all cell line pools. By 72 h postinfection, an approximately 2-log increase in the yield of viral genomes was detected. Based on the observations made from these assays, virus binding, entry, and translocation are major factors influencing viral DNA replication in THP1 cells. These same factors influence the cGAS recognition response. The activation of the cGAS pathway following virus entry does not appear to strongly influence Ad2 DNA replication.
Activation of the cGAS DNA sensing pathway by Ad7 and Ad35.
Species C adenoviruses bind cells with high affinity through attachment of the fiber capsid protein to the coxsackievirus-adenovirus receptor (CAR) (12). The CAR is the predominant viral high-affinity receptor for other Ad serotypes, with the exception of species B viruses. CD46 (13) is bound by group 1 species B viruses (Ad35), whereas desmoglein-2 (14) is the target of group 2 species B Ad (Ad7A). To assess IRF3/IFN/ISG activation with virus infections that utilize distinct receptor entry pathways, a viral activation assay was performed by infecting HeLa and HeLa shRNA knockdown cell line pools with 5,000 particles/cell of Ad2, Ad7A, and Ad35 (Fig. 6A). In HeLa and HeLa shSCR-11 and -13 cell lines, TBK1, IRF3, and STAT1 phosphorylation was induced by each virus, and the magnitude of IRF3, TBK1, and STAT1 phosphorylation was serotype dependent, with Ad35>Ad7>Ad2. Consistent with increased primary signaling, levels of Ad-inducible transcripts were substantially higher in wt HeLa cells infected by Ad35 and Ad7A than in cells infected by Ad2 (Fig. 6B). In HeLa sh-STING or cGAS knockdown cell line pools (Fig. 6A), viral activation by Ad2, Ad7A, and Ad35 was greatly diminished at the level of IRF3, TBK1, and STAT1 phosphorylation. cGAS responded to each viral infection, where the magnitude of the activation response demonstrated an Ad35>Ad7A>Ad2 bias.
FIG 6.

Serotype-specific response in HeLa cell lines. (A) HeLa cells and HeLa cell lines treated with sh-SCR-13, sh-SCR-11, sh-STING-2, sh-cGAS1, and sh-cGAS3 lentiviral vectors were infected with 5,000 particles/cell of Ad2, Ad7A, or Ad35 and harvested at 6 h postinfection for Western analysis as described in the text. (B) RNA isolated from wt HeLa cells infected for 6 or 24 h with 5,000 particles/cell of Ad5CiG, Ad2, Ad7A, or Ad35 was analyzed by RT-qPCR for the indicated Ad-inducible transcripts. (C) DNA replication yield assay with HeLa cells and HeLa knockdown sh-SCR-13, sh-STING-2, and sh-cGAS1 cell lines infected with 500 particles/cell of the indicated virus harvested at 6 and 24 h postinfection. DNA purification and qPCR using serotype-specific matched-efficiency primers were performed as described in Materials and Methods. An Ad2 6-h sample infected with 500 particles/cell was assigned an arbitrary value of 1. All vDNA levels were normalized to the level of a cellular DNA (IFN-β) control.
We next compared virus uptake and DNA replication for each serotype (Fig. 6C). Using the 6-h time point for binding/uptake comparisons, we found that similar amounts of each virus were taken up in each HeLa cell line pool (serospecific PCR primers with matched efficiency). Data from the 24-h replication yield assay indicated that sh-STING and sh-cGAS knockdowns did not influence the replication of Ad7A or Ad35. The assay also indicated differences in replication yields, where Ad2>Ad7>Ad35. Each serotype induced a cGAS recognition response, which did not compromise viral DNA replication.
cGAS recognition response to Ad7A and Ad35 in different cell types.
Non-CAR binding viruses may trigger cell-specific PRR cascades through the use of distinct entry pathways. We infected A549, RPE, and THP1 cells with 5,000 particles/cell of Ad2, Ad7A, and Ad35 to determine serotype-specific differences in antiviral activation (Fig. 7A). Lysates were harvested at 6 h postinfection. Neither A549 nor RPE cells generated a significant IRF3 response when infected with Ad7A or Ad35. Since A549 and RPE cells were nonresponsive, they were not studied further. In contrast, lysates from THP1 cells infected with Ad7A or Ad35 at 6 h indicated a strong activation response at the levels of primary (pTBK1 and pIRF3) and secondary (pSTAT1) signaling cascades.
FIG 7.

Serotype-specific response in differentiated THP1 cell lines. (A) Ad activation assay with serotypes 2, 7A, and 35 infecting A549, RPE, and THP1 cells at 5,000 particles/cell. Lysates were harvested at 6 h postinfection and screened by Western analysis as described in the text. (B) DNA replication yield assay for serotypes 2, 7A, and 35 in THP1 cells infected with 500 particles/cell with total DNA harvested at the indicated times. DNA purification and qPCR using serotype-specific matched-efficiency primers were performed as described in Materials and Methods. An Ad35 6-h sample infected with 500 particles/cell was assigned an arbitrary value of 1. All vDNA values were normalized to the value of a cellular DNA (IFN-β) control. (C) THP1 cell lines treated with sh-SCR-11, sh-cGAS1, and sh-cGAS3 lentiviral vectors were infected with 5,000 particles/cell of Ad2, Ad7A, or Ad35. Protein lysates were harvested at 6 h postinfection for Western analysis as previously described. (D) RNA isolated from sh-SCR-13, and sh-cGAS1 THP1 cell line pools infected for 6 h with 5,000 particles/cell of Ad2, Ad7A, or Ad35 analyzed by two-step RT-qPCR for the indicated Ad-inducible transcripts. THP1 sh-SCR mock sample 1 was assigned an arbitrary value of 100 for normalization, as described in the text.
To assess the relative levels of virus binding in THP1 cells, a virus binding/uptake/replication assay was performed. A total of 500 particles/cell of each serotype was incubated with THP1 cells for 6 h. Cells were washed twice with serum-free medium and harvested at the indicated time points (Fig. 7B). Using DNA yields at 6 h as the binding/uptake standard for each virus, we established a serotype-specific binding/uptake bias with Ad35>Ad7A>Ad2. Later time points revealed serotype-specific differences in DNA replication. At 24 h, Ad2 levels were diminished, and Ad35 levels were slightly decreased, but modest Ad7A DNA replication was detected. At 48 h, replication of Ad2 and A7A was evident, whereas Ad35 DNA yields were modestly increased. Similar results were obtained when replication assays were carried out with a lower input viral dose (data not shown). In wild-type THP1 cells, each serotype revealed distinct activation, binding/uptake, and DNA replication phenotypes.
To establish that the early response to Ad7A and Ad35 in THP1 cells was dependent on the cGAS PRR cascade, sh-cGAS THP1 knockdown cell line pools were used in Ad activation assays (Fig. 7C). Knockdown of cGAS in THP1 cells results in compromised activation (pIRF3, pTBK1, and pSTAT1) with Ad7 and Ad35 at 6 h postinfection. Residual levels of pIRF3, pTBK1, and pSTAT1 detected in cGAS knockdowns (by Ad35) are most likely the result of incomplete knockdown efficiency, the high level of cascade components in these cells, and the extreme potency of Ad35 in triggering the cGAS/STING PRR response. We next determined whether IRF3/STAT1 induction by Ad7A and Ad35 translates into an equally strong cGAS-dependent induction of antiviral response transcripts. sh-SCR and sh-cGAS THP1 knockdown cell line pools were infected with 5,000 particles/cell of Ad2, Ad7A, and Ad35. Total RNA was harvested at 6 h postinfection and characterized for induction of antiviral transcripts by RT-qPCR (Fig. 7D). sh-SCR mock sample 1 was assigned an arbitrary value of 100. Although these viruses differ in uptake efficiency, the transcript induction response to Ad7A and Ad35 exceeded that observed with Ad2 by an amount that was well beyond expectations based on differences in viral DNA uptake. Ad7 and Ad35 strongly induced both ISG and proinflammatory transcripts in THP1 cells. The impact of the cGAS knockdown on transcript induction by these viruses was highly significant. In comparison to infected sh-SCR THP1 cells, Ad7A and Ad35 antiviral transcript induction in sh-cGAS THP1 cells was decreased by as much as 3 to 4 logs. All transcript induction was influenced by cGAS. These data establish serospecific and cell-specific differences in the presentation of viral genomes to the cGAS PRR cascade (Fig. 7D). The data support a model where binding, internalization, and/or viral DNA exposure to cGAS is greater with the species B viruses than with Ad2 in THP1 monocyte-derived cells. This enhanced PRR response yields more robust IRF3/IFN/ISG signaling.
DISCUSSION
Adenovirus induction of the type I IFN antiviral response was established nearly 50 years ago. Activation of this pathway requires detection by a host cell pathogen recognition receptor and an appropriate downstream signal response cascade leading to transcriptional activation of type I IFNs. Using genetic knockouts in the murine model, several anti-Ad PRR cascades that contribute to the IFN activation response have been identified. TLR9 recognition of viral DNA signals through MyD88-IRF7 activation to induce type I IFNs. This pathway is dominant in plasmacytoid dendritic cells and contributes to the role of pDCs in innate and adaptive immunity (17, 77). rAdV stimulates a TLR/MyD88-independent DNA sensing cascade in murine macrophages, dendritic cells, and established murine cell lines through STING-dependent activation of IRF3 (17−21, 66). Using murine endothelial and macrophage-like cell lines infected by rAdV, the cGAS DNA sensor was demonstrated to be a dominant PRR signaling through STING/TBK1/IRF3 (21). A third pathway occurs by way of systemic infection where serum proteins, including immunoglobulin, complement, and FX, bind adenovirus (78). The coated or opsonized virus is taken up by endothelial cells, macrophages, or DCs and activates a TLR2/4-MyD88 signaling cascade that contributes to antiviral signaling (79, 80). The antiviral response to adenovirus is layered and dynamic and integrates several PRR recognition cascades.
This study was undertaken (i) to determine if cyclic guanine-adenine synthase functions as a DNA recognition sensor for adenovirus infections in permissive human cell lines, (ii) to determine if viral gene products generated during the course of a wild-type virus infection suppress activation of the cGAS/STING/TBK1/IRF3 cascade, (iii) to determine if activation of this pathway directly influences viral replication, and (iv) to determine if the cGAS recognition cascade responds equally to adenoviruses that bind through different high-affinity membrane receptors. The data indicate that the cGAS pathway is essential to the activation of the type I interferon antiviral response and that all serotypes tested activate the cGAS cascade, where both serotype and cell type play a role in determining the magnitude of the response. We did not find evidence that adenovirus infection suppressed cGAS/STING/TBK1/IRF3 activation by 6 h postinfection. Viral replication was largely independent of the cGAS activation response.
Scoring for both primary and secondary response targets (pSer396IRF3 and pTyr701STAT1, respectively), it is clear that not all human cell lines are equally equipped to initiate an antiviral response to adenovirus. In the cell lines assayed, the cGAS/STING/TBK1/IRF3 cascade was found to be the dominant IFN-inducing PRR signaling cascade. Knockdown of cGAS or STING in multiple cell lines results in a loss of TBK1 and IRF3 phosphorylation but also a loss of STAT1 activation. Since both type I and type II IFNs can activate STAT1, the complete loss of STAT1 phosphorylation following cGAS knockdown provides a strong measure of the overall contribution that cGAS makes to this component of the antiadenoviral response. Complementing the Western analysis, an equally compelling result was obtained by quantitation of Ad-inducible ISGs in sh-cGAS or sh-STING HeLa cell lines. The 2- to 3-log increase in ISG abundance following Ad infection was consistently reduced to mock levels in cGAS and STING knockdown cell line pools. Weakly induced inflammatory transcripts (IL-1β, TNF-α, and IL-6) were less responsive to the knockdown of the cGAS pathway. As in HeLa cells, cGAS knockdown in THP1 cells severely compromised the IRF3/IFN/ISG antiviral response to all serotypes of virus tested.
The lack of an IRF3/IFN/ISG response in A549 cells is attributed to insufficient levels of cGAS and/or STING. These cells were nonresponsive when transfected with viral DNA and/or noncanonical 2′,3′-cGAMP, but they respond to transfection with poly(I·C) (data not shown). RPE cells were nonresponsive to Ad infection and expressed low levels of cGAS and modest levels of STING. Transfection of either DNA or 2′,3′-cGAMP resulted in modest TBK1 and IRF3 activation (data not shown). The low level of cGAS undoubtedly contributes to the lack of an IRF3/IFN/ISG response in these cells. In all cell lines and treatments, we observed a consistent correlation between the level of cGAS cascade activation and the transcriptional induction of ISG transcripts. It is worth noting that cell lines with limited vDNA PRR signaling cascades may have intact cascades for recognition of RNA viruses [All cell lines used here induce IRF3 following poly(I·C) transfection (data not shown)].
THP1 cells provide a useful platform for examining how differences in Ad virion proteins impact virus uptake and the innate response to virus infection. It is established that CAR binding vectors weakly transduce human monocyte-derived cells, whereas subgroup B (CD46 and desmoglein-2 binding) viruses are more efficiently taken up by these cells (13, 14). Similar levels of Ad35, Ad7A, and Ad2 bind to HeLa cells, but binding/uptake in THP1 cells was biased in favor of Ad35>Ad7A>Ad2. Not surprisingly, a much stronger antiviral response was detected following THP1 infection by Ad35, with a direction bias of Ad35>Ad7A>Ad2. Importantly, knockdown of cGAS attenuates the IRF3/IFN/ISG response to each serotype at the levels of both primary and secondary signaling. In THP1 cells, we initially attributed the serotype difference in IRF3/IFN/ISG activation to differences in viral uptake, which clearly is the case. However, levels of antiviral activation induced by Ad7 and Ad35 were disproportionately high. Therefore, we suspect that a serotype-specific capsid function also contributes to higher levels of cGAS activation. In support of this model, in HeLa cells, where levels of virus uptake were similar, the Ad35>Ad7A>Ad2 bias in IRF3/IFN/ISG activation also occurred. We believe that the data support a model where serotype-specific enhancement of cGAS signaling occurs through differences in virus entry and escape and vDNA presentation to cGAS. Further investigation will reveal the serotype-specific components that influence IRF3/IFN/ISG activation profiles.
In wild-type virus infections, viral immunoevasins are remarkably effective at suppressing host IFN-mediated antiviral pathways that block viral replication. E1A suppresses signaling downstream of IFNR activation at STAT1 (51, 81), compromises IFN-directed ISG activation by disrupting IFN-induced histone 2B monoubiquitination required for ISG induction (82), and blocks RNA activation of a TRIF/BS69 signalosome, which leads to NF-κB and IRF3 activation (83). E1B functions to effectively repress IFN-induced antiviral strategies that impact replication (53, 54). Ad expression of short hairpin VAI/II RNAs interferes with PKR activation and phosphorylation of eIF2, resulting in viral protein translation (56, 57). We considered the cGAS primary response cascade as a potential target of adenoviral immunoevasins. By screening activation of cascade proteins with representative wt viruses, in wt and shRNA knockdown cell line models, we found no evidence that the cGAS/STING cascade was specifically targeted at immediate early- to early-stage infections (6 h postinfection). Therefore, established, varied, and overlapping Ad immunoevasin strategies that target secondary response signaling cascades provide sufficient protection against host antiviral mechanisms that interfere with vDNA replication.
During late-stage infection, the influence of viral gene expression on the downregulation of inducible transcripts was obvious. We were not expecting pSer396IRF3, IFN-β transcript, and pTyr706STAT1 to persist at this stage of infection. This observation is consistent with previous reports that active STAT1 is associated with Ad replication foci (84), where this association was hypothesized to represent a functional diversion of STAT1 away from ISGs. However, these observations raise the question, does adenovirus induction of the cGAS cascade generate cellular products that are essential or critical to viral replication? Two lines of data argue that products of primary or secondary IRF3/IFN/ISG activation are not necessary for virus replication. In A549, HeLa, and RPE cells, viral uptake and viral DNA replication were essentially identical. A549 and RPE cells were essentially devoid of an IRF3/IFN/ISG response, whereas HeLa cells present with a classic response. In cells knocked down in cGAS or STING, there was no compelling impact on DNA replication or viral yield. Therefore, we conclude that Ad replication does not depend on or utilize immediate early IRF3/IFN/ISG response components to enhance viral DNA replication.
Serotype-specific differences in IRF3/IFN/ISG activation and replication may contribute to differences in viral pathogenesis, and they may impact the utility of different serotype-based vectors for therapeutic applications. Differences in viral replication kinetics may impact function when tumor-specific Ad replication is a functional component of oncolytic vector strategies. Similarly, differences in antiviral innate immune activation may have consequences for vaccine strategies when vectors are based on different viral backbones. Recent reports identified serotype-specific innate immune responses in the in vivo murine model (16). Suggestions that differences in immune potency correlate with genome sequence have been made (42). Our data indicate that serotypic differences in the entry and presentation of viral genomes to the cGAS PRR have a major impact on the IRF3/IFN/ISG response in human cell lines. To our knowledge, there are no sequence-specific requirements for cGAS recognition of DNA. Further investigation will be required to determine if other anti-Ad PRRs reveal serotype-specific responses and to determine the virion attributes that account for differences in IRF3/IFN/ISG activation potency.
ACKNOWLEDGMENTS
E.F.-P. is a recipient of a Hearst Foundation award. This work was supported by Public Health Service grant RO1 AI094050 to E.F.-P.
Footnotes
Published ahead of print 8 October 2014
REFERENCES
- 1.Lynch JP, III, Fishbein M, Echavarria M. 2011. Adenovirus. Semin. Respir. Crit. Care Med. 32:494–511. 10.1055/s-0031-1283287. [DOI] [PubMed] [Google Scholar]
- 2.Pham TTM, Burchette JL, Jr, Hale LP. 2003. Fatal disseminated adenovirus infections in immunocompromised patients. Am. J. Clin. Pathol. 120:575–583. 10.1309/AWXDGNC5D70EN7YT. [DOI] [PubMed] [Google Scholar]
- 3.Ip WW, Qasim W. 2013. Management of adenovirus in children after allogeneic hematopoietic stem cell transplantation. Adv. Hematol. 2013:176418. 10.1155/2013/176418. [DOI] [PMC free article] [PubMed] [Google Scholar]
- 4.Elkon KB, Liu CC, Gall JG, Trevejo J, Marino MW, Abrahamsen KA, Song X, Zhou JL, Old LJ, Crystal RG, Falck-Pedersen E. 1997. Tumor necrosis factor alpha plays a central role in immune-mediated clearance of adenoviral vectors. Proc. Natl. Acad. Sci. U. S. A. 94:9814–9819. 10.1073/pnas.94.18.9814. [DOI] [PMC free article] [PubMed] [Google Scholar]
- 5.Muruve DA, Barnes MJ, Stillman IE, Libermann TA. 1999. Adenoviral gene therapy leads to rapid induction of multiple chemokines and acute neutrophil-dependent hepatic injury in vivo. Hum. Gene Ther. 10:965–976. 10.1089/10430349950018364. [DOI] [PubMed] [Google Scholar]
- 6.Trevejo JM, Marino MW, Philpott N, Josien R, Richards EC, Elkon KB, Falck-Pedersen E. 2001. TNF-alpha-dependent maturation of local dendritic cells is critical for activating the adaptive immune response to virus infection. Proc. Natl. Acad. Sci. U. S. A. 98:12162–12167. 10.1073/pnas.211423598. [DOI] [PMC free article] [PubMed] [Google Scholar]
- 7.Yang Y, Li Q, Ertl HC, Wilson JM. 1995. Cellular and humoral immune responses to viral antigens create barriers to lung-directed gene therapy with recombinant adenoviruses. J. Virol. 69:2004–2015. [DOI] [PMC free article] [PubMed] [Google Scholar]
- 8.Yang Y, Su Q, Wilson JM. 1996. Role of viral antigens in destructive cellular immune responses to adenovirus vector-transduced cells in mouse lungs. J. Virol. 70:7209–7212. [DOI] [PMC free article] [PubMed] [Google Scholar]
- 9.Beladi I, Pusztai R. 1967. Interferon-like substance produced in chick fibroblast cells inoculated with human adenoviruses. Z. Naturforsch. B 22:165–169. [DOI] [PubMed] [Google Scholar]
- 10.Ho M, Kohler K. 1967. Studies on human adenoviruses as inducers of interferon in chick cells. Arch. Gesamte Virusforsch. 22:69–78. 10.1007/BF01240504. [DOI] [PubMed] [Google Scholar]
- 11.Toth M, Bakay M, Tarodi B, Toth S, Pusztai R, Beladi I. 1983. Different interferon-inducing ability of human adenovirus types in chick embryo cells. Acta Virol. 27:337–345. [PubMed] [Google Scholar]
- 12.Bergelson JM, Cunningham JA, Droguett G, Kurt-Jones EA, Krithivas A, Hong JS, Horwitz MS, Crowell RL, Finberg RW. 1997. Isolation of a common receptor for coxsackie B viruses and adenoviruses 2 and 5. Science 275:1320–1323. 10.1126/science.275.5304.1320. [DOI] [PubMed] [Google Scholar]
- 13.Gaggar A, Shayakhmetov DM, Lieber A. 2003. CD46 is a cellular receptor for group B adenoviruses. Nat. Med. 9:1408–1412. 10.1038/nm952. [DOI] [PubMed] [Google Scholar]
- 14.Wang H, Li ZY, Liu Y, Persson J, Beyer I, Moller T, Koyuncu D, Drescher MR, Strauss R, Zhang XB, Wahl JK, III, Urban N, Drescher C, Hemminki A, Fender P, Lieber A. 2011. Desmoglein 2 is a receptor for adenovirus serotypes 3, 7, 11 and 14. Nat. Med. 17:96–104. 10.1038/nm.2270. [DOI] [PMC free article] [PubMed] [Google Scholar]
- 15.Miyazawa N, Leopold PL, Hackett NR, Ferris B, Worgall S, Falck-Pedersen E, Crystal RG. 1999. Fiber swap between adenovirus subgroups B and C alters intracellular trafficking of adenovirus gene transfer vectors. J. Virol. 73:6056–6065. [DOI] [PMC free article] [PubMed] [Google Scholar]
- 16.Teigler JE, Kagan JC, Barouch DH. 2014. Late endosomal trafficking of alternative serotype adenovirus vaccine vectors augments antiviral innate immunity. J. Virol. 88:10354–10363. 10.1128/JVI.00936-14. [DOI] [PMC free article] [PubMed] [Google Scholar]
- 17.Zhu J, Huang X, Yang Y. 2007. Innate immune response to adenoviral vectors is mediated by both Toll-like receptor-dependent and -independent pathways. J. Virol. 81:3170–3180. 10.1128/JVI.02192-06. [DOI] [PMC free article] [PubMed] [Google Scholar]
- 18.Nociari M, Ocheretina O, Schoggins JW, Falck-Pedersen E. 2007. Sensing infection by adenovirus: Toll-like receptor-independent viral DNA recognition signals activation of the interferon regulatory factor 3 master regulator. J. Virol. 81:4145–4157. 10.1128/JVI.02685-06. [DOI] [PMC free article] [PubMed] [Google Scholar]
- 19.Nociari M, Ocheretina O, Murphy M, Falck-Pedersen E. 2009. Adenovirus induction of IRF3 occurs through a binary trigger targeting Jun N-terminal kinase and TBK1 kinase cascades and type I interferon autocrine signaling. J. Virol. 83:4081–4091. 10.1128/JVI.02591-08. [DOI] [PMC free article] [PubMed] [Google Scholar]
- 20.Fejer G, Drechsel L, Liese J, Schleicher U, Ruzsics Z, Imelli N, Greber UF, Keck S, Hildenbrand B, Krug A, Bogdan C, Freudenberg MA. 2008. Key role of splenic myeloid DCs in the IFN-alphabeta response to adenoviruses in vivo. PLoS Pathog. 4:e1000208. 10.1371/journal.ppat.1000208. [DOI] [PMC free article] [PubMed] [Google Scholar]
- 21.Lam E, Stein S, Falck-Pedersen E. 2014. Adenovirus detection by the cGAS/STING/TBK1 DNA sensing cascade. J. Virol. 88:974–981. 10.1128/JVI.02702-13. [DOI] [PMC free article] [PubMed] [Google Scholar]
- 22.Sun L, Wu J, Du F, Chen X, Chen ZJ. 2013. Cyclic GMP-AMP synthase is a cytosolic DNA sensor that activates the type I interferon pathway. Science 339:786–791. 10.1126/science.1232458. [DOI] [PMC free article] [PubMed] [Google Scholar]
- 23.Gao P, Ascano M, Wu Y, Barchet W, Gaffney BL, Zillinger T, Serganov AA, Liu Y, Jones RA, Hartmann G, Tuschl T, Patel DJ. 2013. Cyclic [G(2′,5′)pA(3′,5′)p] is the metazoan second messenger produced by DNA-activated cyclic GMP-AMP synthase. Cell 153:1094–1107. 10.1016/j.cell.2013.04.046. [DOI] [PMC free article] [PubMed] [Google Scholar]
- 24.Li XD, Wu J, Gao D, Wang H, Sun L, Chen ZJ. 2013. Pivotal roles of cGAS-cGAMP signaling in antiviral defense and immune adjuvant effects. Science 341:1390–1394. 10.1126/science.1244040. [DOI] [PMC free article] [PubMed] [Google Scholar]
- 25.Ablasser A, Goldeck M, Cavlar T, Deimling T, Witte G, Rohl I, Hopfner KP, Ludwig J, Hornung V. 2013. cGAS produces a 2′-5′-linked cyclic dinucleotide second messenger that activates STING. Nature 498:380–384. 10.1038/nature12306. [DOI] [PMC free article] [PubMed] [Google Scholar]
- 26.Gao P, Ascano M, Zillinger T, Wang W, Dai P, Serganov AA, Gaffney BL, Shuman S, Jones RA, Deng L, Hartmann G, Barchet W, Tuschl T, Patel DJ. 2013. Structure-function analysis of STING activation by c[G(2′,5′)pA(3′,5′)p] and targeting by antiviral DMXAA. Cell 154:748–762. 10.1016/j.cell.2013.07.023. [DOI] [PMC free article] [PubMed] [Google Scholar]
- 27.Zhang X, Shi H, Wu J, Zhang X, Sun L, Chen C, Chen ZJ. 2013. Cyclic GMP-AMP containing mixed phosphodiester linkages is an endogenous high-affinity ligand for STING. Mol. Cell 51:226–235. 10.1016/j.molcel.2013.05.022. [DOI] [PMC free article] [PubMed] [Google Scholar]
- 28.Ishikawa H, Ma Z, Barber GN. 2009. STING regulates intracellular DNA-mediated, type I interferon-dependent innate immunity. Nature 461:788–792. 10.1038/nature08476. [DOI] [PMC free article] [PubMed] [Google Scholar]
- 29.Ishikawa H, Barber GN. 2008. STING is an endoplasmic reticulum adaptor that facilitates innate immune signalling. Nature 455:674–678. 10.1038/nature07317. [DOI] [PMC free article] [PubMed] [Google Scholar]
- 30.McWhirter SM, Fitzgerald KA, Rosains J, Rowe DC, Golenbock DT, Maniatis T. 2004. IFN-regulatory factor 3-dependent gene expression is defective in Tbk1-deficient mouse embryonic fibroblasts. Proc. Natl. Acad. Sci. U. S. A. 101:233–238. 10.1073/pnas.2237236100. [DOI] [PMC free article] [PubMed] [Google Scholar]
- 31.Servant MJ, Grandvaux N, ten Oever BR, Duguay D, Lin R, Hiscott J. 2003. Identification of the minimal phosphoacceptor site required for in vivo activation of interferon regulatory factor 3 in response to virus and double-stranded RNA. J. Biol. Chem. 278:9441–9447. 10.1074/jbc.M209851200. [DOI] [PubMed] [Google Scholar]
- 32.Clement JF, Bibeau-Poirier A, Gravel SP, Grandvaux N, Bonneil E, Thibault P, Meloche S, Servant MJ. 2008. Phosphorylation of IRF-3 on Ser 339 generates a hyperactive form of IRF-3 through regulation of dimerization and CBP association. J. Virol. 82:3984–3996. 10.1128/JVI.02526-07. [DOI] [PMC free article] [PubMed] [Google Scholar]
- 33.Panne D, Maniatis T, Harrison SC. 2007. An atomic model of the interferon-beta enhanceosome. Cell 129:1111–1123. 10.1016/j.cell.2007.05.019. [DOI] [PMC free article] [PubMed] [Google Scholar]
- 34.Unterholzner L, Keating SE, Baran M, Horan KA, Jensen SB, Sharma S, Sirois CM, Jin T, Latz E, Xiao TS, Fitzgerald KA, Paludan SR, Bowie AG. 2010. IFI16 is an innate immune sensor for intracellular DNA. Nat. Immunol. 11:997–1004. 10.1038/ni.1932. [DOI] [PMC free article] [PubMed] [Google Scholar]
- 35.Kerur N, Veettil MV, Sharma-Walia N, Bottero V, Sadagopan S, Otageri P, Chandran B. 2011. IFI16 acts as a nuclear pathogen sensor to induce the inflammasome in response to Kaposi sarcoma-associated herpesvirus infection. Cell Host Microbe 9:363–375. 10.1016/j.chom.2011.04.008. [DOI] [PMC free article] [PubMed] [Google Scholar]
- 36.Hansen K, Prabakaran T, Laustsen A, Jorgensen SE, Rahbaek SH, Jensen SB, Nielsen R, Leber JH, Decker T, Horan KA, Jakobsen MR, Paludan SR. 2014. Listeria monocytogenes induces IFNbeta expression through an IFI16-, cGAS- and STING-dependent pathway. EMBO J. 33:1654–1666. 10.15252/embj.201488029. [DOI] [PMC free article] [PubMed] [Google Scholar]
- 37.Zhang Z, Yuan B, Bao M, Lu N, Kim T, Liu YJ. 2011. The helicase DDX41 senses intracellular DNA mediated by the adaptor STING in dendritic cells. Nat. Immunol. 12:959–965. 10.1038/ni.2091. [DOI] [PMC free article] [PubMed] [Google Scholar]
- 38.Parvatiyar K, Zhang Z, Teles RM, Ouyang S, Jiang Y, Iyer SS, Zaver SA, Schenk M, Zeng S, Zhong W, Liu ZJ, Modlin RL, Liu YJ, Cheng G. 2012. The helicase DDX41 recognizes the bacterial secondary messengers cyclic di-GMP and cyclic di-AMP to activate a type I interferon immune response. Nat. Immunol. 13:1155–1161. 10.1038/ni.2460. [DOI] [PMC free article] [PubMed] [Google Scholar]
- 39.Basner-Tschakarjan E, Gaffal E, O'Keeffe M, Tormo D, Limmer A, Wagner H, Hochrein H, Tuting T. 2006. Adenovirus efficiently transduces plasmacytoid dendritic cells resulting in TLR9-dependent maturation and IFN-alpha production. J. Gene Med. 8:1300–1306. 10.1002/jgm.964. [DOI] [PubMed] [Google Scholar]
- 40.Cerullo V, Seiler MP, Mane V, Brunetti-Pierri N, Clarke C, Bertin TK, Rodgers JR, Lee B. 2007. Toll-like receptor 9 triggers an innate immune response to helper-dependent adenoviral vectors. Mol. Ther. 15:378–385. 10.1038/sj.mt.6300031. [DOI] [PubMed] [Google Scholar]
- 41.McGuire KA, Barlan AU, Griffin TM, Wiethoff CM. 2011. Adenovirus type 5 rupture of lysosomes leads to cathepsin B-dependent mitochondrial stress and production of reactive oxygen species. J. Virol. 85:10806–10813. 10.1128/JVI.00675-11. [DOI] [PMC free article] [PubMed] [Google Scholar]
- 42.Perreau M, Welles HC, Pellaton C, Gjoksi B, Potin L, Martin R, Harari A, Bett A, Casimiro D, Gall J, Barouch DH, Kremer EJ, Pantaleo G. 2012. The number of Toll-like receptor 9-agonist motifs in the adenovirus genome correlates with induction of dendritic cell maturation by adenovirus immune complexes. J. Virol. 86:6279–6285. 10.1128/JVI.00123-12. [DOI] [PMC free article] [PubMed] [Google Scholar]
- 43.Iacobelli-Martinez M, Nemerow GR. 2007. Preferential activation of Toll-like receptor nine by CD46-utilizing adenoviruses. J. Virol. 81:1305–1312. 10.1128/JVI.01926-06. [DOI] [PMC free article] [PubMed] [Google Scholar]
- 44.Wold WS. 1993. Adenovirus genes that modulate the sensitivity of virus-infected cells to lysis by TNF. J. Cell. Biochem. 53:329–335. 10.1002/jcb.240530410. [DOI] [PubMed] [Google Scholar]
- 45.Burgert HG, Ruzsics Z, Obermeier S, Hilgendorf A, Windheim M, Elsing A. 2002. Subversion of host defense mechanisms by adenoviruses. Curr. Top. Microbiol. Immunol. 269:273–318. [DOI] [PubMed] [Google Scholar]
- 46.Hendrickx R, Stichling N, Koelen J, Kuryk L, Lipiec A, Greber UF. 2014. Innate immunity to adenovirus. Hum. Gene Ther. 25:265–284. 10.1089/hum.2014.001. [DOI] [PMC free article] [PubMed] [Google Scholar]
- 47.Mahr JA, Gooding LR. 1999. Immune evasion by adenoviruses. Immunol. Rev. 168:121–130. 10.1111/j.1600-065X.1999.tb01287.x. [DOI] [PubMed] [Google Scholar]
- 48.Anderson KP, Fennie EH. 1987. Adenovirus early region 1A modulation of interferon antiviral activity. J. Virol. 61:787–795. [DOI] [PMC free article] [PubMed] [Google Scholar]
- 49.Reich N, Pine R, Levy D, Darnell JE., Jr 1988. Transcription of interferon-stimulated genes is induced by adenovirus particles but is suppressed by E1A gene products. J. Virol. 62:114–119. [DOI] [PMC free article] [PubMed] [Google Scholar]
- 50.Duerksen-Hughes P, Wold WS, Gooding LR. 1989. Adenovirus E1A renders infected cells sensitive to cytolysis by tumor necrosis factor. J. Immunol. 143:4193–4200. [PubMed] [Google Scholar]
- 51.Look DC, Roswit WT, Frick AG, Gris-Alevy Y, Dickhaus DM, Walter MJ, Holtzman MJ. 1998. Direct suppression of Stat1 function during adenoviral infection. Immunity 9:871–880. 10.1016/S1074-7613(00)80652-4. [DOI] [PubMed] [Google Scholar]
- 52.Miller DL, Rickards B, Mashiba M, Huang W, Flint SJ. 2009. The adenoviral E1B 55-kilodalton protein controls expression of immune response genes but not p53-dependent transcription. J. Virol. 83:3591–3603. 10.1128/JVI.02269-08. [DOI] [PMC free article] [PubMed] [Google Scholar]
- 53.Chahal JS, Qi J, Flint SJ. 2012. The human adenovirus type 5 E1B 55 kDa protein obstructs inhibition of viral replication by type I interferon in normal human cells. PLoS Pathog. 8:e1002853. 10.1371/journal.ppat.1002853. [DOI] [PMC free article] [PubMed] [Google Scholar]
- 54.Chahal JS, Gallagher C, DeHart CJ, Flint SJ. 2013. The repression domain of the E1B 55-kilodalton protein participates in countering interferon-induced inhibition of adenovirus replication. J. Virol. 87:4432–4444. 10.1128/JVI.03387-12. [DOI] [PMC free article] [PubMed] [Google Scholar]
- 55.Sparer TE, Tripp RA, Dillehay DL, Hermiston TW, Wold WS, Gooding LR. 1996. The role of human adenovirus early region 3 proteins (gp19K, 10.4K, 14.5K, and 14.7K) in a murine pneumonia model. J. Virol. 70:2431–2439. [DOI] [PMC free article] [PubMed] [Google Scholar]
- 56.Thimmappaya B, Weinberger C, Schneider RJ, Shenk T. 1982. Adenovirus VAI RNA is required for efficient translation of viral mRNAs at late times after infection. Cell 31:543–551. 10.1016/0092-8674(82)90310-5. [DOI] [PubMed] [Google Scholar]
- 57.Liao HJ, Kobayashi R, Mathews MB. 1998. Activities of adenovirus virus-associated RNAs: purification and characterization of RNA binding proteins. Proc. Natl. Acad. Sci. U. S. A. 95:8514–8519. 10.1073/pnas.95.15.8514. [DOI] [PMC free article] [PubMed] [Google Scholar]
- 58.Ferrari R, Su T, Li B, Bonora G, Oberai A, Chan Y, Sasidharan R, Berk AJ, Pellegrini M, Kurdistani SK. 2012. Reorganization of the host epigenome by a viral oncogene. Genome Res. 22:1212–1221. 10.1101/gr.132308.111. [DOI] [PMC free article] [PubMed] [Google Scholar]
- 59.Ferrari R, Pellegrini M, Horwitz GA, Xie W, Berk AJ, Kurdistani SK. 2008. Epigenetic reprogramming by adenovirus e1a. Science 321:1086–1088. 10.1126/science.1155546. [DOI] [PMC free article] [PubMed] [Google Scholar]
- 60.Berk AJ. 2005. Recent lessons in gene expression, cell cycle control, and cell biology from adenovirus. Oncogene 24:7673–7685. 10.1038/sj.onc.1209040. [DOI] [PubMed] [Google Scholar]
- 61.Miller DL, Myers CL, Rickards B, Coller HA, Flint SJ. 2007. Adenovirus type 5 exerts genome-wide control over cellular programs governing proliferation, quiescence, and survival. Genome Biol. 8:R58. 10.1186/gb-2007-8-4-r58. [DOI] [PMC free article] [PubMed] [Google Scholar]
- 62.Dorer DE, Holtrup F, Fellenberg K, Kaufmann JK, Engelhardt S, Hoheisel JD, Nettelbeck DM. 2011. Replication and virus-induced transcriptome of HAdV-5 in normal host cells versus cancer cells—differences of relevance for adenoviral oncolysis. PLoS One 6:e27934. 10.1371/journal.pone.0027934. [DOI] [PMC free article] [PubMed] [Google Scholar]
- 63.Zhao H, Dahlo M, Isaksson A, Syvanen AC, Pettersson U. 2012. The transcriptome of the adenovirus infected cell. Virology 424:115–128. 10.1016/j.virol.2011.12.006. [DOI] [PubMed] [Google Scholar]
- 64.Juang YT, Lowther W, Kellum M, Au WC, Lin R, Hiscott J, Pitha PM. 1998. Primary activation of interferon A and interferon B gene transcription by interferon regulatory factor 3. Proc. Natl. Acad. Sci. U. S. A. 95:9837–9842. 10.1073/pnas.95.17.9837. [DOI] [PMC free article] [PubMed] [Google Scholar]
- 65.Schoggins JW, Falck-Pedersen E. 2006. Fiber and penton base capsid modifications yield diminished adenovirus type 5 transduction and proinflammatory gene expression with retention of antigen-specific humoral immunity. J. Virol. 80:10634–10627. 10.1128/JVI.01359-06. [DOI] [PMC free article] [PubMed] [Google Scholar]
- 66.Stein SC, Falck-Pedersen E. 2012. Sensing adenovirus infection: activation of interferon regulatory factor 3 in RAW 264.7 cells. J. Virol. 86:4527–4537. 10.1128/JVI.07071-11. [DOI] [PMC free article] [PubMed] [Google Scholar]
- 67.Schmittgen TD, Livak KJ. 2008. Analyzing real-time PCR data by the comparative C(T) method. Nat. Protoc. 3:1101–1108. 10.1038/nprot.2008.73. [DOI] [PubMed] [Google Scholar]
- 68.Livak KJ, Schmittgen TD. 2001. Analysis of relative gene expression data using real-time quantitative PCR and the 2(-delta delta CT) method. Methods 25:402–408. 10.1006/meth.2001.1262. [DOI] [PubMed] [Google Scholar]
- 69.Miller SA, Dykes DD, Polesky HF. 1988. A simple salting out procedure for extracting DNA from human nucleated cells. Nucleic Acids Res. 16:1215. 10.1093/nar/16.3.1215. [DOI] [PMC free article] [PubMed] [Google Scholar]
- 70.Gallaher SD, Berk AJ. 2013. A rapid Q-PCR titration protocol for adenovirus and helper-dependent adenovirus vectors that produces biologically relevant results. J. Virol. Methods 192:28–38. 10.1016/j.jviromet.2013.04.013. [DOI] [PMC free article] [PubMed] [Google Scholar]
- 71.Schoggins JW, Nociari M, Philpott N, Falck-Pedersen E. 2005. Influence of fiber detargeting on adenovirus-mediated innate and adaptive immune activation. J. Virol. 79:11627–11637. 10.1128/JVI.79.18.11627-11637.2005. [DOI] [PMC free article] [PubMed] [Google Scholar]
- 72.Konno H, Konno K, Barber GN. 2013. Cyclic dinucleotides trigger ULK1 (ATG1) phosphorylation of STING to prevent sustained innate immune signaling. Cell 155:688–698. 10.1016/j.cell.2013.09.049. [DOI] [PMC free article] [PubMed] [Google Scholar]
- 73.Qureshi SA, Salditt-Georgieff M, Darnell JE., Jr 1995. Tyrosine-phosphorylated Stat1 and Stat2 plus a 48-kDa protein all contact DNA in forming interferon-stimulated-gene factor 3. Proc. Natl. Acad. Sci. U. S. A. 92:3829–3833. 10.1073/pnas.92.9.3829. [DOI] [PMC free article] [PubMed] [Google Scholar]
- 74.Thimmappaya B, Jones N, Shenk T. 1979. A mutation which alters initiation of transcription by RNA polymerase III on the Ad5 chromosome. Cell 18:947–954. 10.1016/0092-8674(79)90207-1. [DOI] [PubMed] [Google Scholar]
- 75.Bett AJ, Krougliak V, Graham FL. 1995. DNA sequence of the deletion/insertion in early region 3 of Ad5 dl309. Virus Res. 39:75–82. 10.1016/S0168-1702(95)00071-2. [DOI] [PubMed] [Google Scholar]
- 76.Shayakhmetov DM, Papayannopoulou T, Stamatoyannopoulos G, Lieber A. 2000. Efficient gene transfer into human CD34(+) cells by a retargeted adenovirus vector. J. Virol. 74:2567–2583. 10.1128/JVI.74.6.2567-2583.2000. [DOI] [PMC free article] [PubMed] [Google Scholar]
- 77.Guiducci C, Ghirelli C, Marloie-Provost MA, Matray T, Coffman RL, Liu YJ, Barrat FJ, Soumelis V. 2008. PI3K is critical for the nuclear translocation of IRF-7 and type I IFN production by human plasmacytoid predendritic cells in response to TLR activation. J. Exp. Med. 205:315–322. 10.1084/jem.20070763. [DOI] [PMC free article] [PubMed] [Google Scholar]
- 78.Xu Z, Tian J, Smith JS, Byrnes AP. 2008. Clearance of adenovirus by Kupffer cells is mediated by scavenger receptors, natural antibodies, and complement. J. Virol. 82:11705–11713. 10.1128/JVI.01320-08. [DOI] [PMC free article] [PubMed] [Google Scholar]
- 79.Rhee EG, Blattman JN, Kasturi SP, Kelley RP, Kaufman DR, Lynch DM, La Porte A, Simmons NL, Clark SL, Pulendran B, Greenberg PD, Barouch DH. 2011. Multiple innate immune pathways contribute to the immunogenicity of recombinant adenovirus vaccine vectors. J. Virol. 85:315–323. 10.1128/JVI.01597-10. [DOI] [PMC free article] [PubMed] [Google Scholar]
- 80.Hartman ZC, Kiang A, Everett RS, Serra D, Yang XY, Clay TM, Amalfitano A. 2007. Adenovirus infection triggers a rapid, MyD88-regulated transcriptome response critical to acute-phase and adaptive immune responses in vivo. J. Virol. 81:1796–1812. 10.1128/JVI.01936-06. [DOI] [PMC free article] [PubMed] [Google Scholar]
- 81.Leonard GT, Sen GC. 1997. Restoration of interferon responses of adenovirus E1A-expressing HT1080 cell lines by overexpression of p48 protein. J. Virol. 71:5095–5101. [DOI] [PMC free article] [PubMed] [Google Scholar]
- 82.Fonseca GJ, Thillainadesan G, Yousef AF, Ablack JN, Mossman KL, Torchia J, Mymryk JS. 2012. Adenovirus evasion of interferon-mediated innate immunity by direct antagonism of a cellular histone posttranslational modification. Cell Host Microbe 11:597–606. 10.1016/j.chom.2012.05.005. [DOI] [PubMed] [Google Scholar]
- 83.Takaki H, Oshiumi H, Sasai M, Kawanishi T, Matsumoto M, Seya T. 2009. Oligomerized TICAM-1 (TRIF) in the cytoplasm recruits nuclear BS69 to enhance NF-kappaB activation and type I IFN induction. Eur. J. Immunol. 39:3469–3476. 10.1002/eji.200939878. [DOI] [PubMed] [Google Scholar]
- 84.Sohn SY, Hearing P. 2011. Adenovirus sequesters phosphorylated STAT1 at viral replication centers and inhibits STAT dephosphorylation. J. Virol. 85:7555–7562. 10.1128/JVI.00513-11. [DOI] [PMC free article] [PubMed] [Google Scholar]