

Abstract
Concomitant treatment of tuberculosis (TB) and HIV is recommended and improves outcomes. Bedaquiline is a novel drug for the treatment of multidrug-resistant (MDR) TB; combined use with antiretroviral drugs, nevirapine, or ritonavir-boosted lopinavir (LPV/r) is anticipated, but no clinical data from coinfected patients are available. Plasma concentrations of bedaquiline and its M2 metabolite after single doses were obtained from interaction studies with nevirapine or LPV/r in healthy volunteers. The antiretrovirals' effects on bedaquiline and M2 pharmacokinetics were assessed by nonlinear mixed-effects modeling. Potential dose adjustments were evaluated with simulations. No significant effects of nevirapine on bedaquiline pharmacokinetics were identified. LPV/r decreased bedaquiline and M2 clearances to 35% (relative standard error [RSE], 9.2%) and 58% (RSE, 8.4%), respectively, of those without comedication. As almost 3-fold (bedaquiline) and 2-fold (M2) increases in exposures during chronic treatment with LPV/r are expected, dose adjustments are suggested for evaluation. Efficacious, safe bedaquiline dosing for MDR-TB patients receiving antiretrovirals is important. Modeling results suggest that bedaquiline can be coadministered with nevirapine without dose adjustments. The predicted elevation of bedaquiline and M2 levels during LPV/r coadministration may be a safety concern, and careful monitoring is recommended. Further data are being collected in coinfected patients to determine whether dose adjustments are needed. (These studies have been registered at ClinicalTrials.gov under registration numbers NCT00828529 [study C110] and NCT00910806 [study C117].)
INTRODUCTION
Of the 8.6 million people who developed tuberculosis (TB) in 2012, 1.1 million (13%) were also infected with HIV (1). Early initiation of antiretroviral therapy (ART) during TB therapy substantially reduces TB-related morbidity and mortality rates for coinfected patients (2, 3), and the World Health Organization recommends that ART be started as soon as possible but within 8 weeks after the initiation of TB therapy (4). Simultaneously, the global emergence and increased dissemination of multidrug-resistant (MDR) and extensively drug-resistant (XDR) TB have increased the need for novel anti-TB drugs with new mechanisms of action. Data from Eastern Europe indicate that multidrug resistance is approximately twice as common among patients with TB who have HIV, compared with patients without HIV (5), and a South African study found that 100% of patients with XDR-TB who were tested had HIV infections (6). Ensuring access to novel anti-TB compounds and determining safe and efficacious doses for coinfected patients must be priorities (7).
The diarylquinoline bedaquiline (BDQ) (previously called TMC207) was recently approved for the treatment of MDR-TB and XDR-TB by the U.S. Food and Drug Administration (FDA) and the European Medicines Agency. The mechanism of action is novel and involves the inhibition of mycobacterial ATP synthase, leading to disrupted energy metabolism (8, 9). Phase II trials showed that BDQ significantly decreased the time to sputum culture conversion and increased the proportion of patients with negative culture results after 6 months of treatment, when added to a regimen of other anti-TB drugs (10, 11). This treatment benefit was sustained at the end of the 120-week trial (12). The exposure-response relationship for BDQ is poorly characterized, but a recent study of early bactericidal activity detected a linear increase in bactericidal activity with increasing doses over 14 days of treatment (13). The main safety issue for BDQ is moderate QT prolongation; in addition, an unexplained increase in late deaths, compared to the placebo group, was observed in one phase II study in which all patients also received standard MDR-TB treatment, which resulted in a black-box warning in the U.S. label (12, 14). In general, however, BDQ is better tolerated than other second-line TB drugs, the majority of which produce clinically significant and often treatment-limiting side effects (15). The current standard dosing regimen for BDQ is 2 weeks of 400 mg given daily, followed by 22 weeks of 200 mg administered three times per week. BDQ is extensively distributed to the tissues and has a multiphasic elimination pattern with a long terminal half-life (4 to 5 months) (16, 17). It is mainly metabolized by the cytochrome P450 (CYP) enzyme CYP3A4 to a N-monodesmethyl metabolite, M2 (38). The activity of M2 against Mycobacterium tuberculosis is 3- to 6-fold weaker than the activity of BDQ, and there is concern that the metabolite may have a higher risk of toxicity (39). M2, though, circulates at much lower concentrations than the parent drug in humans. M2 is further primarily demethylated to the M3 metabolite, likely also by CYP3A4 (11, 18).
Nevirapine (NVP), a nonnucleoside reverse transcriptase inhibitor, and ritonavir-boosted lopinavir (LPV/r), a protease inhibitor, are widely used antiretroviral (ARV) drugs, and each has an impact on enzymes involved in BDQ metabolism. NVP is an inducer of CYP3A4 (19), while ritonavir is a potent inhibitor (20, 21) and possibly simultaneously an inducer (22, 23) of CYP3A4; therefore, drug-drug interactions (DDIs) when these drugs are coadministered with BDQ are expected. Noncompartmental analysis (NCA) based on data from the same studies as used in this work and quantifying drug exposure over 2 weeks after single doses of BDQ detected only moderate changes in a comparison of administration of BDQ alone versus BDQ in combination with steady-state NVP or LPV/r (17). The U.S. label therefore allows concomitant treatment (14) but warns that bedaquiline should be used with caution when coadministered with LPV/r, and only if the benefits outweigh the risks, and it reminds providers that clinical data from patients taking these drugs together are not yet available. Previous modeling work demonstrated that an NCA of single-dose data underestimated the inductive effect of efavirenz on BDQ pharmacokinetics (PK) during continuous efavirenz coadministration (18). The objectives of this work were to guide the safe and efficacious use of BDQ for patients with MDR-TB/HIV coinfections by presenting model-based estimates of the impact of ART on the PK of BDQ and M2 during continuous administration and to provide suggestions for potential dose adjustments to evaluate in this population.
MATERIALS AND METHODS
Population.
Participants in study C110 (registered at ClinicalTrials.gov under registration number NCT00828529) were HIV-seronegative healthy volunteers. Other entry criteria included age of 18 to 55 years, body mass index (BMI) of 18 to 32 kg/m2, and smoking less than 10 cigarettes per day. Women of childbearing potential, individuals with TB, HIV-1, or HIV-2, and individuals with a history of substance abuse were excluded. Participants in study C117 (registered at ClinicalTrials.gov under registration number NCT00910806) had HIV-1 infections and were ART naive, with a medical indication to start ART with NVP plus two nucleoside reverse transcriptase inhibitors (NRTIs). Included participants were 18 to 65 years of age, had BMI values of 18 to 30 kg/m2, and had documented HIV-1 infections but no history of ART. Women of childbearing potential, individuals with active AIDS-defining illnesses or TB, and individuals with a history of substance abuse could not participate. Subjects previously enrolled in trials involving BDQ were ineligible to participate in study C110 or study C117. The trials were conducted in accordance with good clinical practice standards and local ethics legislation.
Data.
Data were obtained from two DDI studies sponsored by Tibotec (now known as Janssen), one with BDQ and LPV/r (study C110) and one with BDQ and NVP (study C117). Study C110 was a crossover study with sequence randomization, wherein two doses of 400 mg BDQ were given 4 weeks apart; administration of LPV/r at 400/100 mg twice daily was started 10 days before either the first or second BDQ dose. Study C117 was a single-sequence study including two 400-mg BDQ doses; administration of NVP at standard doses (200 mg once daily for 2 weeks, followed by 200 mg twice daily) was started prior to the second BDQ dose; participants received at least 4 weeks of the twice-daily dosing prior to the second BDQ dose. PK samples were collected before and 1, 2, 3, 4, 5, 6, 8, 12, 24, 48, 72, 120, 168, 216, 264, and 336 h after each BDQ dose in both studies. Plasma concentrations of BDQ and M2 were determined using a validated liquid chromatography-tandem mass spectrometry (LC-MS/MS) method with a lower limit of quantification of 1.00 ng/ml (24). The assay was validated according to FDA guidelines and met the acceptance criteria for accuracy and precision specified therein. ARV trough concentrations were assessed on several occasions.
Nonlinear mixed-effects modeling.
The population PK of BDQ and M2 were described by nonlinear mixed-effects models containing structural components (fixed effects) and stochastic components (random effects). The random effects included one part assigned to specific parameters (i.e., between-subject variability [BSV] and between-occasion variability [BOV]) and the other part assigned to observations (i.e., residual variability). The BSV and BOV were assumed to follow log-normal distributions, and the two BDQ doses were regarded as separate occasions. A correlation between the residual errors for BDQ and M2 was included in the estimations. The model development started from a previously published population PK model (18), and data from the two current studies were fitted separately. All disposition parameters were estimated as relative to the bioavailability. To render the model formally identifiable, the portion of BDQ metabolized to M2 was assumed to be constant, and parameters for M2 were estimated relative to this fraction. Allometric scaling of disposition parameters with body weight as the size descriptor and fixed coefficients (0.75 for clearance [CL] and 1 for volume of distribution) was applied. The impacts of LPV/r (inhibition) were assumed to start immediately upon initiation of administration and to vanish within 1 day after the last LPV/r dose, while the impacts of NVP (induction) were assumed to start after 2 weeks of twice-daily administration. The effects of LPV/r or NVP coadministration on the bioavailability and CL of BDQ and M2 were evaluated. In addition, BSV correlations were estimated for interaction effects and CLs. Average trough concentrations of the ARVs were evaluated as a covariate of the interaction effects. The model selection was based on maximum likelihood statistics (5% significance level) and goodness-of-fit plots, including prediction- and variability-corrected visual predictive checks (1,000 replicated simulations) (25).
Software.
The analysis and simulations were performed in NONMEM 7.2 with the first-order conditional estimation method, including eta-epsilon interaction (26). Perl-speaks-NONMEM functionalities aided the development work (27), and Xpose 4 was used for graphical evaluation (28). Pirana was utilized as a link between the aforementioned software and the computation cluster and for creation of documentation (29).
Impact of interactions.
The predicted impact of ART on BDQ PK during continuous coadministration was assessed by comparison of the average steady-state concentrations (Css,avg), as follows: Css,avg = (F·dose)/(CL·τ) where F is the bioavailability and τ is the dosing interval. Assuming the same BDQ dosing strategy, relative Css,avg, comparing coadministration (denoted ART) to no coadministration, is given as follows: relative Css,avg =Css,avg(ART)/Css,avg = (CL/F)/[CL(ART)/F(ART)]. The same equations can be used analogously in calculations for M2.
Simulations of alternative dosing.
When a significant interaction effect was found, alternative regimens to achieve BDQ exposures similar to those achieved when BDQ was given alone (i.e., without interaction) were evaluated with stochastic simulations. Three different clinical scenarios were hypothesized, i.e., the patient is newly diagnosed with TB, has known HIV, and is already established on ART (scenario 1), the patient is newly diagnosed with both TB and HIV and has a CD4+ cell count of <50 cells/mm3 (scenario 2), or the patient is newly diagnosed with TB and HIV and has a CD4+ cell count of >50 cells/mm3 (scenario 3). The recommendations from the Panel on Antiretroviral Guidelines for Adults and Adolescents, Department of Health and Human Services, are to start ART within 2 weeks after the initiation of TB treatment in scenario 2 and as early as possible but 4 to 8 weeks after the initiation of TB treatment in scenario 3 (http://aidsinfo.nih.gov/contentfiles/lvguidelines/AdultandAdolescentGL.pdf). The simulations represent one clinical trial including 143 MDR-TB patients and demographic characteristics mimicking the population of a published phase II study (12). The results were evaluated as the weekly average concentration (Cavg), maximal concentration (Cmax), and minimal concentration (Cmin) values for BDQ and M2, and the alternative BDQ regimens were compared with the standard regimen without and with concomitant ART.
RESULTS
Data.
Sixteen individuals were included in each study. Their demographic information is summarized in Table 1. In total, 532 PK samples for each of BDQ and M2 were available from study C110; 20 samples for M2 were found to be below the limit of quantification (BLQ). In study C117, the total number of available samples was 528 for each compound; 1 and 33 samples were BLQ for BDQ and M2, respectively. Since the fraction of samples BLQ was so low for both BDQ and M2, these samples were omitted from the modeling analyses.
TABLE 1.
Summary of demographic information for studies C110 and C117a
| Characteristic | Study C110 (LPV/r DDI) | Study C117 (NVP DDI) |
|---|---|---|
| No. of subjects | 16 | 16 |
| Median wt (range) (kg) | 75 (65–103) | 55 (48–71) |
| Median age (range) (yr) | 25.5 (20–54) | 30 (22–51) |
| No. male/no. female | 15/1 | 10/6 |
| No. black/no. white/no. mixed race | 6/10/0 | 8/0/8 |
| No. HIV-1 seropositive | 0 | 16 |
LPV/r, ritonavir-boosted lopinavir; NVP, nevirapine; DDI, drug-drug interaction.
Nonlinear mixed-effects modeling.
The previously developed structural model, including absorption through an estimated number of transit compartments, with three distribution compartments for BDQ and two for M2, was found to fit the data from both studies well (Fig. 1). Estimates of key parameters (CLs and interaction effects) are presented in Table 2; all parameter estimates with precision are presented in Table S1 in the supplemental material. NVP was not found to have a significant effect on BDQ bioavailability, and the effects on CL were small, i.e., changes to 91.5% (relative standard error [RSE], 5.9%) and 105% (RSE, 10.3%) of BDQ and M2 CL values without comedication, respectively. LPV/r was found to decrease the CL of both BDQ and M2 substantially, to 35% (RSE, 9.2%) and 58% (RSE, 8.4%) of CL values without comedication, respectively. The values for BSV in the decreases were 35% (RSE, 17%) and 12% (RSE, 73%), respectively. The BSV values for the interaction effects for BDQ and M2 were 100% correlated but were not significantly correlated with the BSV in the CL of BDQ or M2. Parameterizing the interaction effect on bioavailability instead of CL resulted in a worse fit. Allowing effects on both CL and bioavailability simultaneously did not markedly improve the fit to the data; therefore, the model with the effect on CL only was selected as the final model. Using an average trough concentration of LPV or ritonavir for each individual as a covariate for the interaction effect did not significantly improve the fit.
FIG 1.

Prediction- and variability-corrected visual predictive check of study C117 (upper) and study C110 (lower), showing the 5th, 50th, and 95th percentiles (lines) of observed data (dots) (sampling points were before and 1, 2, 3, 4, 5, 6, 8, 12, 24, 48, 72, 120, 168, 216, 264, and 336 h after the dose) and the 95% confidence intervals (shaded areas) of the same percentiles of bedaquiline and M2 data simulated from the model.
TABLE 2.
Summary of estimates of key parameters reflecting effects of ritonavir-boosted lopinavir, nevirapine, or efavirenz on population pharmacokinetics of bedaquiline and its M2 metabolitea
| Parameter | Study C110 (LPV/r DDI) | Study C117 (NVP DDI) | Published modelb (EFV DDI) |
|---|---|---|---|
| BDQ CL/F (liters/h) (BSV [CV %])c | 3.09 (39.2) | 3.34 (18.0) | 2.96 (23.7) |
| M2 CL/F/fm (liters/h) (BSV [CV %])c | 14.6 (40.5) | 16.0 (19.2) | 12.3 (18.8) |
| Factor changed in BDQ CL/F (BSV [CV %]) | 0.347 (34.6) | 0.915 (—)e | 2.07 (20.6) |
| Factor changed in M2 CL/F/fm (BSV [CV %]) | 0.578 (11.5) | 1.05 (—)e | 2.07 (28.2) |
BSV, between-subject variability; CV, coefficient of variation; DDI, drug-drug interaction; BDQ, bedaquiline; M2, N-monodesmethyl metabolite; CL, clearance; F, bioavailability; fm, fraction of BDQ metabolized to M2; EFV, efavirenz.
See reference 18.
For a typical subject weighing 70 kg.
With coadministration, compared to when bedaquiline is administered alone.
—, not estimated.
Impact of interactions.
The model predicts that concomitant administration of LPV/r will cause close to 3- and 2-fold increases in Css,avg values for BDQ and M2, respectively. NVP is predicted to have little impact, increasing BDQ Css,avg by 9% and decreasing M2 Css,avg by 5%. The predicted effects of ART, quantified as relative Css,avg, are provided in Table 3.
TABLE 3.
Impact of continuous ART coadministration on BDQ and M2 pharmacokinetics quantified by relative average steady-state concentrations and relative standard errorsa
| ART | Relative Css,avg (%) (RSE [%]) |
|
|---|---|---|
| BDQ | M2 | |
| LPV/r | 288 (9.3) | 173 (8.4) |
| NVP | 109 (5.9) | 95.2 (10.3) |
ART, antiretroviral therapy; RSE, relative standard error; BDQ, bedaquiline; M2, N-monodesmethyl metabolite; LPV/r, ritonavir-boosted lopinavir; NVP, nevirapine.
Simulations of alternative dosing.
No dose adjustments were evaluated for NVP. Lower doses were evaluated for LPV/r, and the suggested alternative regimens for the three clinical scenarios are listed in Table 4. For scenario 1, 300 mg once daily for 2 weeks followed by 100 mg thrice weekly (alternative 2) was the regimen that provided weekly Cavg, Cmax, and Cmin values most similar to those of the standard BDQ regimen without LPV/r coadministration. Figure 2 shows weekly Cavg values for the standard regimen with and without LPV/r and for the dose-adjusted regimen (alternative 2). Cavg and Cmax values at week 2 and week 24 of treatment for all simulated alternative regimens in scenario 1 are presented in Fig. S2 in the supplemental material. Regimens in scenarios 2 and 3 were evaluated in the same manner, and alternative dosing regimens 4 and 6, respectively, were found to be best (results not shown).
TABLE 4.
Alternative dosing regimens for bedaquiline coadministered with ritonavir-boosted lopinavir, as evaluated with simulations
| Scenario | Regimen | Weeks 1 and 2 | Weeks 3–24 |
|---|---|---|---|
| 0: no LPV/ra | Standard | 400 mg once daily | 200 mg thrice weekly |
| 1: LPV/r from start of TB treatment | Standard | 400 mg once daily | 200 mg thrice weekly |
| Alternative 1 | 200 mg once daily | 100 mg thrice weekly | |
| Alternative 2b | 300 mg once daily | 100 mg thrice weekly | |
| Alternative 3 | 300 mg once daily | 100 mg twice weekly | |
| 2: LPV/r beginning in week 3 of TB treatment | Standard | 400 mg once daily | 200 mg thrice weekly |
| Alternative 4b | 400 mg once daily | 100 mg thrice weekly | |
| Alternative 5 | 400 mg once daily | 100 mg twice weekly | |
| 3: LPV/r beginning in week 5 of TB treatment | Standard | 400 mg once daily | 200 mg thrice weekly |
| Alternative 6b | 400 mg once daily | 200 mg thrice weekly for 2 wk, followed by 100 mg thrice weekly | |
| Alternative 7 | 400 mg once daily | 200 mg thrice weekly for 2 wk, followed by 100 mg twice weekly |
LPV/r, ritonavir-boosted lopinavir.
Best alternative dosing strategy for this clinical scenario.
FIG 2.

Simulated weekly average concentration (Cavg) values (means and interquartile ranges) for BDQ (upper) and M2 (lower) when BDQ is administered at standard doses alone, at standard doses with ritonavir-boosted lopinavir throughout treatment, and at recommended adjusted doses with ritonavir-boosted lopinavir.
DISCUSSION
The clinical data and our modeling work show that BDQ and M2 exposure remains nearly unchanged when BDQ is administered together with NVP. This is reassuring and gives patients coinfected with HIV and TB an important treatment option. It also reveals that 3- and 2-fold elevated BDQ and M2 exposures, respectively, are to be expected when BDQ is administered together with LPV/r on a long-term basis, since LPV/r slows the metabolism of BDQ and M2 substantially. The exposure-response relationships for the efficacy and safety of BDQ and M2 are not established; therefore, it is difficult to draw inferences regarding the clinical effects of the interaction. However, the long-term safety of the increased exposures to BDQ and M2 that are predicted by our models has not been tested. It is possible that patients taking LPV/r and BDQ concomitantly need a reduced dose of BDQ; this needs to be proven clinically in patients with coinfections. From model-based simulations, we estimate alternative dosing regimens suitable for mitigating the impact of the interaction for further evaluation in HIV/MDR-TB-coinfected patients.
Earlier analyses, which form the basis for the current recommendations of the drug labeling, evaluated DDIs by comparing exposure over 2 weeks following single doses of BDQ, using NCA. Our modeling work advances the analysis through the development of compartmental models based on the same data, which enable predictions of the impact of the interactions on the total exposure during continuous coadministration. This model-based approach takes into account the long terminal half-life of BDQ and the fact that only a fraction of the total exposure (quantified as area under the concentration curve [AUC]) is captured over 2 weeks of observations, because of the long terminal elimination phase. This fraction can be calculated from model predictions of AUC0–336h and the individual CL/F values (giving total AUC [AUCinf]), and values were found to be on average 42% for BDQ and 26% for M2 when BDQ was administered without interacting drugs. The analysis of PK DDIs based on a fraction of the total exposure is problematic for two reasons, i.e., the fraction captured within a certain time frame changes with interactions that modify the PK parameters, and the full impact on elimination is not captured when only part of the elimination is observed. It is therefore not surprising that the NCA, quantifying the effects observed during a limited time period after a single dose, and our model-based analysis, quantifying the effects on primary PK parameters translated to steady-state conditions, generate different results (+22% and +188% changes in BDQ exposure during LPV/r coadministration, respectively). Figure 3 shows predictions of individual AUC0–336h and AUCinf values for BDQ and M2 for the subjects in study C110. The ratio of average model-predicted single-dose AUC values over just 2 weeks (AUC0–336h) with and without LPV/r was 1.25, well in line with the original NCA results. When applying NCA to data generated by simulations (n = 1,000, with the same dosing and sampling schedule as in the original study) from the developed model, a change in BDQ exposure similar to that reported earlier was obtained (+31% versus +22%), further demonstrating the agreement with evaluation of the partial AUCs alone.
FIG 3.
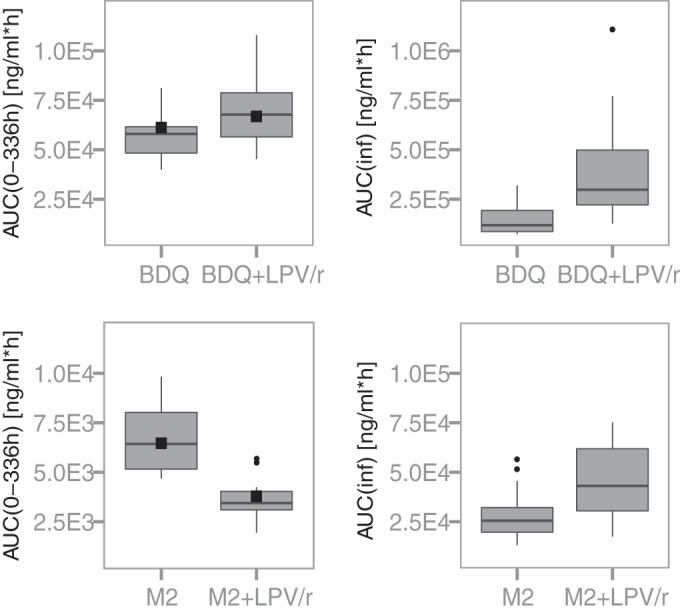
Box plots showing model-derived exposures of bedaquiline (upper) and its M2 metabolite (lower) up to 336 h (AUC0–336h) (left) and in total (AUCinf) (right) for the 16 individuals participating in study C110, following a single dose of 400 mg of bedaquiline administered alone or with steady-state ritonavir-boosted lopinavir. Black squares in the left panels represent average observed AUC0–336h values during the first dosing occasion for the 8 individuals who then received bedaquiline alone and the 8 individuals who received bedaquiline and LPV/r concomitantly.
Conclusions regarding the need for dose adjustments based on the predicted impact on steady-state exposure may differ from conclusions based on changes in exposure over 2 weeks after a single dose. For coadministration with NVP, no significant changes in BDQ and M2 Css,avg values were predicted; therefore, the standard regimen should be adequate. For coadministration with LPV/r, however, dose adjustments may be needed. As mentioned previously, the lack of established exposure-response relationships for BDQ and M2 and the absence of dose-ranging trials of >2-week duration at doses higher than the licensed doses make it difficult to assess the clinical impact. Nonetheless, we regard the 188% and 73% increases in Css,avg values predicted for BDQ and M2, respectively, to be a potential safety concern, given the side effect profile of the drug. The increases are large, compared to the random variability observed in patients during week 24 of treatment (study 208), where the Cavg coefficient of variation (CV) for BDQ was 33% and that for M2 was 35% (17). The results from the simulations with alternative regimens demonstrate that simple dose adjustments can mitigate the impact of LPV/r on BDQ exposure in all three scenarios investigated. When a patient is already established on LPV/r at the start of TB therapy, a dose decrease from 400 mg to 300 mg during the first 2 weeks of therapy results in estimated concentrations similar to those of patients not taking LPV/r. One-half of the standard dose, 100 mg three times per week, was appropriate in all three scenarios and is estimated to yield levels close to standard levels during weeks 3 to 24 of TB treatment. Careful evaluation in clinical trials of the suggested lower dose of BDQ for patients with MDR-TB/HIV who are receiving ART containing LPV/r is needed to confirm the model predictions.
If an adjusted BDQ regimen is administered, then coordination of TB and HIV care is crucial to make sure that the BDQ regimen is changed back to standard dosing if HIV treatment is altered and LPV/r administration is stopped. The inhibition by ritonavir is commonly viewed to occur almost instantaneously and to cease when the drug has been cleared (30). It has been reported that the impact of high doses of ritonavir can last up to 48 h after the dose, despite the short half-life (3 to 5 h) (31). Switching back to standard dosing within 24 to 48 h after discontinuation of LPV/r is likely to be appropriate.
With the standard-dose BDQ regimen and concomitant LPV/r administration, exposure to M2 is predicted to be lower than without the comedication during the first half of treatment; during the second half, however, average, maximal, and minimal concentrations are all predicted to be higher, as shown in Fig. 2. This may be a concern, largely based on preclinical safety findings (11). First, BDQ and M2 are both cationic amphiphilic drugs, and the positively charged amino group at physiological pH leads to drug accumulation inside cells. M2 is a stronger base and has been predicted to be cytotoxic and to cause phospholipidosis at lower concentrations than BDQ in vitro (32, 39). Phospholipidosis is a reversible drug-induced storage disorder characterized by intracellular accumulation of phospholipids and formation of lysosomal lamellar bodies. It is not thought to be directly toxic, and it is reversible (33, 34). Second, BDQ and M2 inhibit cardiac hERG/IKr potassium channels in vitro (11) and prolong the QT interval in some subjects when used clinically (17). Caution in situations in which M2 levels are expected to be elevated is therefore warranted. If suggested dose adjustments are implemented, then the M2 exposures are predicted to be lower than those seen among patients taking standard-dose BDQ without LPV/r during the whole course of treatment, since the estimated inhibition of M2 CL is smaller than that of BDQ CL.
Neither of the studies analyzed here contained observations of the M3 metabolite that is formed from M2; therefore, no predictions of the impact on M3 levels could be made. M3 is normally present at concentrations that are 1 order of magnitude lower than those of M2, and the toxicity profile is not well studied. Our previous analysis of a DDI study with efavirenz showed that induction of CYP3A4 increased the M3 CL less than the BDQ and M2 CLs (18). Similarly, if the CL of M3 is affected less than the CLs of BDQ and M2, this would lead to decreased M3 levels when BDQ is administered together with LPV/r. This is a potential benefit, since M3 is inactive against mycobacteria and may potentially induce phospholipidosis (11).
These population PK models were developed based on data from individuals who did not have MDR-TB, and PK in patients with TB and/or HIV may differ. Differences could be caused by altered levels of plasma proteins (BDQ is >99.99% bound [11], and the concentration of plasma albumin is decreased in patients with TB [35] or TB/HIV coinfections [36]), altered bioavailability (37), or malnutrition. BDQ and M2 exposures were generally lower in patients with MDR-TB than would be expected based on data from healthy volunteers, and differences in bedaquiline CL and bioavailability have been shown (11, 24). Therefore, the model-predicted Css,avg values should not be interpreted as being directly representative of the concentrations expected among patients with MDR-TB. However, there is no clear reason why the mechanisms of the interactions would differ between the study population and patients with TB and/or HIV, and the magnitude of the interactions is likely to be similar in patients. The effects of sex and race on these drug interactions could not be evaluated, given the small sample size and limited diversity of the study participants.
Using a model-based approach to analyze the results from two clinical interaction studies, we determined that NVP has no impact on BDQ PK, but substantial inhibitory effects of LPV/r were identified. If BDQ at standard doses is administered continuously with concomitant LPV/r administration, then close to 3-fold higher BDQ exposures are expected, and careful safety monitoring is highly recommended. The developed model was utilized to suggest dose adjustments to mitigate the impact of LPV/r, recognizing the importance of ensuring access to efficacious and safe treatment with BDQ for MDR-TB/HIV-coinfected patients receiving ART.
Supplementary Material
ACKNOWLEDGMENTS
This work was supported by the Swedish Research Council (grant 521-2011-3442 to E.M.S. and M.O.K.), by the Innovative Medicines Initiative Joint Undertaking (www.imi.europa.eu) (grant agreement 115337 to E.M.S. and M.O.K.) for the PreDiCT-TB consortium, resources of which include financial contributions from the European Union Seventh Framework Programme (grant FP7/2007-2013) and European Federation of Pharmaceutical Industries and Associations companies' in-kind contributions, and by the National Institutes of Health (grant K23AI080842 to K.E.D.). The data analyzed were an in-kind contribution to the PreDiCT-TB consortium from Janssen Research & Development, LLC.
E.M.S. and K.E.D. have no conflicts of interest to declare. M.O.K. has received research grants from Janssen.
Footnotes
Published ahead of print 11 August 2014
Supplemental material for this article may be found at http://dx.doi.org/10.1128/AAC.03246-14.
REFERENCES
- 1.World Health Organization. 2013. Global tuberculosis report. World Health Organization, Geneva, Switzerland. [Google Scholar]
- 2.Abdool Karim SS, Naidoo K, Grobler A, Padayatchi N, Baxter C, Gray A, Gengiah T, Nair G, Bamber S, Singh A, Khan M, Pienaar J, El-Sadr W, Friedland G, Abdool Karim Q. 2010. Timing of initiation of antiretroviral drugs during tuberculosis therapy. N. Engl. J. Med. 362:697–706. 10.1056/NEJMoa0905848. [DOI] [PMC free article] [PubMed] [Google Scholar]
- 3.Blanc F-X, Sok T, Laureillard D, Borand L, Rekacewicz C, Nerrienet E, Madec Y, Marcy O, Chan S, Prak N, Kim C, Lak KK, Hak C, Dim B, Sin CI, Sun S, Guillard B, Sar B, Vong S, Fernandez M, Fox L, Delfraissy J-F, Goldfeld AE. 2011. Earlier versus later start of antiretroviral therapy in HIV-infected adults with tuberculosis. N. Engl. J. Med. 365:1471–1481. 10.1056/NEJMoa1013911. [DOI] [PMC free article] [PubMed] [Google Scholar]
- 4.World Health Organization. 2014. WHO policy on collaborative TB/HIV activities: guidelines for national programmes and other stakeholders. World Health Organization, Geneva, Switzerland. [PubMed] [Google Scholar]
- 5.World Health Organization. 2014. Anti-tuberculosis drug resistance in the world: fourth global report. World Health Organization, Geneva, Switzerland. [Google Scholar]
- 6.Gandhi NR, Moll A, Sturm AW, Pawinski R, Govender T, Lalloo U, Zeller K, Andrews J, Friedland G. 2006. Extensively drug-resistant tuberculosis as a cause of death in patients co-infected with tuberculosis and HIV in a rural area of South Africa. Lancet 368:1575–1580. 10.1016/S0140-6736(06)69573-1. [DOI] [PubMed] [Google Scholar]
- 7.Dooley KE, Kim PS, Williams SD, Hafner R. 2012. TB and HIV therapeutics: pharmacology research priorities. AIDS Res. Treat. 2012:874083. 10.1155/2012/874083. [DOI] [PMC free article] [PubMed] [Google Scholar]
- 8.Andries K, Verhasselt P, Guillemont J, Göhlmann HWH, Neefs J-M, Winkler H, Van Gestel J, Timmerman P, Zhu M, Lee E, Williams P, de Chaffoy D, Huitric E, Hoffner S, Cambau E, Truffot-Pernot C, Lounis N, Jarlier V. 2005. A diarylquinoline drug active on the ATP synthase of Mycobacterium tuberculosis. Science 307:223–227. 10.1126/science.1106753. [DOI] [PubMed] [Google Scholar]
- 9.Koul A, Dendouga N, Vergauwen K, Molenberghs B, Vranckx L, Willebrords R, Ristic Z, Lill H, Dorange I, Guillemont J, Bald D, Andries K. 2007. Diarylquinolines target subunit c of mycobacterial ATP synthase. Nat. Chem. Biol. 3:323–324. 10.1038/nchembio884. [DOI] [PubMed] [Google Scholar]
- 10.Diacon AH, Donald PR, Pym A, Grobusch M, Patientia RF, Mahanyele R, Bantubani N, Narasimooloo R, De Marez T, van Heeswijk R, Lounis N, Meyvisch P, Andries K, McNeeley DF. 2012. Randomized pilot trial of eight weeks of bedaquiline (TMC207) treatment for multidrug-resistant tuberculosis: long-term outcome, tolerability, and effect on emergence of drug resistance. Antimicrob. Agents Chemother. 56:3271–3276. 10.1128/AAC.06126-11. [DOI] [PMC free article] [PubMed] [Google Scholar]
- 11.FDA Office of Antimicrobial Products. 2014. Briefing package, NDA 204-384, Sirturo (bedaquiline 100 mg tablets), for the treatment of adults (≥18 years) as part of combination therapy of pulmonary multi-drug resistant tuberculosis (MDRTB). Food and Drug Administration, Silver Spring, MD. [Google Scholar]
- 12.Diacon AH, Pym A, Grobusch MP, de los Rios JM, Gotuzzo E, Vasilyeva I, Leimane V, Andries K, Bakare N, De Marez T, Haxaire-Theeuwes M, Lounis N, Meyvisch P, De Paepe E, van Heeswijk RP, Dannemann B, TMC207-C208 Study Group 2014. Multidrug-resistant tuberculosis and culture conversion with bedaquiline. N. Engl. J. Med. 371:723–732. 10.1056/NEJMoa1313865. [DOI] [PubMed] [Google Scholar]
- 13.Diacon AH, Dawson R, Von Groote-Bidlingmaier F, Symons G, Venter A, Donald PR, Conradie A, Erondu N, Ginsberg AM, Egizi E, Winter H, Becker P, Mendel CM. 2013. Randomized dose-ranging study of the 14-day early bactericidal activity of bedaquiline (TMC207) in patients with sputum microscopy smear-positive pulmonary tuberculosis. Antimicrob. Agents Chemother. 57:2199–2203. 10.1128/AAC.02243-12. [DOI] [PMC free article] [PubMed] [Google Scholar]
- 14.Janssen Pharmaceuticals. 2014. Sirturo, United States product insert. Janssen Pharmaceuticals, Beerse, Belgium: http://www.sirturo.com/sites/default/files/pdf/sirturo-pi.pdf. [Google Scholar]
- 15.Wu S, Zhang Y, Sun F, Chen M, Zhou L, Wang N, Zhan S. 26 November 2013. Adverse events associated with the treatment of multidrug-resistant tuberculosis: a systematic review and meta-analysis. Am. J. Ther. 10.1097/01.mjt.0000433951.09030.5a. [DOI] [PubMed] [Google Scholar]
- 16.van Heeswijk RPG, Dannemann B, Hoetelmans RMW. 23 May 2014. Bedaquiline: a review of human pharmacokinetics and drug-drug interactions. J. Antimicrob. Chemother. 10.1093/jac/dku171. [DOI] [PubMed] [Google Scholar]
- 17.Janssen Pharmaceuticals. 2014. Anti-Infective Drugs Advisory Committee meeting briefing document: TMC207 (bedaquiline): treatment of patients with MDR-TB. Janssen Pharmaceuticals, Beerse, Belgium: http://www.fda.gov/downloads/advisorycommittees/committeesmeetingmaterials/drugs/anti-infectivedrugsadvisorycommittee/ucm329260.pdf. [Google Scholar]
- 18.Svensson EM, Aweeka F, Park J-G, Marzan F, Dooley KE, Karlsson MO. 2013. Model-based estimates of the effects of efavirenz on bedaquiline pharmacokinetics and suggested dose adjustments for patients coinfected with HIV and tuberculosis. Antimicrob. Agents Chemother. 57:2780–2787. 10.1128/AAC.00191-13. [DOI] [PMC free article] [PubMed] [Google Scholar]
- 19.Lamson M, MacGregor T, Riska P, Erickson D, Maxfield P, Rowland L, Gigliotti M, Robinson P, Azzam S, Keirns J. 1999. Nevirapine induces both CYP3A4 and CYP2B6 metabolic pathways. Clin. Pharmacol. Ther. 65:137–137. [Google Scholar]
- 20.Kumar GN, Rodrigues AD, Buko AM, Denissen JF. 1996. Cytochrome P450-mediated metabolism of the HIV-1 protease inhibitor ritonavir (ABT-538) in human liver microsomes. J. Pharmacol. Exp. Ther. 277:423–431. [PubMed] [Google Scholar]
- 21.Eagling VA, Back DJ, Barry MG. 1997. Differential inhibition of cytochrome P450 isoforms by the protease inhibitors, ritonavir, saquinavir and indinavir. Br. J. Clin. Pharmacol. 44:190–194. [DOI] [PMC free article] [PubMed] [Google Scholar]
- 22.Luo G, Cunningham M, Kim S, Burn T, Lin J, Sinz M, Hamilton G, Rizzo C, Jolley S, Gilbert D, Downey A, Mudra D, Graham R, Carroll K, Xie J, Madan A, Parkinson A, Christ D, Selling B, LeCluyse E, Gan L-S. 2002. CYP3A4 induction by drugs: correlation between a pregnane X receptor reporter gene assay and CYP3A4 expression in human hepatocytes. Drug Metab. Dispos. 30:795–804. 10.1124/dmd.30.7.795. [DOI] [PubMed] [Google Scholar]
- 23.Ouellet D, Hsu A, Qian J, Locke CS, Eason CJ, Cavanaugh JH, Leonard JM, Granneman GR. 1998. Effect of ritonavir on the pharmacokinetics of ethinyl oestradiol in healthy female volunteers. Br. J. Clin. Pharmacol. 46:111–116. [DOI] [PMC free article] [PubMed] [Google Scholar]
- 24.McLeay SC, Vis P, van Heeswijk RPG, Green B. 23 June 2014. The population pharmacokinetics of bedaquiline (TMC207), a novel anti-tuberculosis drug. Antimicrob. Agents Chemother. 10.1128/AAC.01418-13. [DOI] [PMC free article] [PubMed] [Google Scholar]
- 25.Bergstrand M, Hooker AC, Wallin JE, Karlsson MO. 2011. Prediction-corrected visual predictive checks for diagnosing nonlinear mixed-effects models. AAPS J. 13:143–151. 10.1208/s12248-011-9255-z. [DOI] [PMC free article] [PubMed] [Google Scholar]
- 26.Beal S, Sheiner LB, Boeckmann A, Bauer RJ. 2012. NONMEM user's guides (1989–2012). Icon Development Solutions, Ellicott City, MD. [Google Scholar]
- 27.Lindbom L, Pihlgren P, Jonsson EN, Jonsson N. 2005. PsN-Toolkit: a collection of computer intensive statistical methods for non-linear mixed effect modeling using NONMEM. Comput. Methods Programs Biomed. 79:241–257. 10.1016/j.cmpb.2005.04.005. [DOI] [PubMed] [Google Scholar]
- 28.Jonsson EN, Karlsson MO. 1999. Xpose: an S-PLUS based population pharmacokinetic/pharmacodynamic model building aid for NONMEM. Comput. Methods Programs Biomed. 58:51–64. [DOI] [PubMed] [Google Scholar]
- 29.Keizer RJ, van Benten M, Beijnen JH, Schellens JHM, Huitema ADR. 2011. Piraña and PCluster: a modeling environment and cluster infrastructure for NONMEM. Comput. Methods Programs Biomed. 101:72–79. 10.1016/j.cmpb.2010.04.018. [DOI] [PubMed] [Google Scholar]
- 30.de Maat DMMR, Ekhart GC, Huitema ADR, Koks CHW, Mulder JW, Beijnen JH. 2003. Drug interactions between antiretroviral drugs and comedicated agents. Clin. Pharmacokinet. 42:223–282. 10.2165/00003088-200342030-00002. [DOI] [PubMed] [Google Scholar]
- 31.Washington CB, Flexner C, Sheiner LB, Rosenkranz SL, Segal Y, Aberg JA, Blaschke TF, AIDS Clinical Trials Group Protocol (ACTG 378) Study Team 2003. Effect of simultaneous versus staggered dosing on pharmacokinetic interactions of protease inhibitors. Clin. Pharmacol. Ther. 73:406–416. 10.1016/S0009-9236(03)00006-7. [DOI] [PubMed] [Google Scholar]
- 32.Mesens N, Steemans M, Hansen E, Verheyen GR, Van Goethem F, Van Gompel J. 2010. Screening for phospholipidosis induced by central nervous drugs: comparing the predictivity of an in vitro assay to high throughput in silico assays. Toxicol. In Vitro 24:1417–1425. 10.1016/j.tiv.2010.04.007. [DOI] [PubMed] [Google Scholar]
- 33.Reasor MJ, Hastings KL, Ulrich RG. 2006. Drug-induced phospholipidosis: issues and future directions. Expert Opin. Drug Saf. 5:567–583. 10.1517/14740338.5.4.567. [DOI] [PubMed] [Google Scholar]
- 34.Food and Drug Administration. 2014. The regulatory challenges of drug-induced phospholipidosis. Food and Drug Administration, Silver Spring, MD: http://www.fda.gov/downloads/advisorycommittees/committeesmeetingmaterials/drugs/advisorycommitteeforpharmaceuticalscienceandclinicalpharmacology/ucm210798.pdf. [Google Scholar]
- 35.Peresi E, Silva SMUR, Calvi SA, Marcondes-Machado J. 2008. Cytokines and acute phase serum proteins as markers of inflammatory regression during the treatment of pulmonary tuberculosis. J. Bras. Pneumol. 34:942–949. 10.1590/S1806-37132008001100009. [DOI] [PubMed] [Google Scholar]
- 36.Ramakrishnan K, Shenbagarathai R, Kavitha K, Uma A, Balasubramaniam R, Thirumalaikolundusubramanian P. 2008. Serum zinc and albumin levels in pulmonary tuberculosis patients with and without HIV. Jpn. J. Infect. Dis. 61:202–204. [PubMed] [Google Scholar]
- 37.Zhu M, Namdar R, Stambaugh JJ, Starke JR, Bulpitt AE, Berning SE, Peloquin CA. 2002. Population pharmacokinetics of ethionamide in patients with tuberculosis. Tuberculosis 82:91–96. 10.1054/tube.2002.0330. [DOI] [PubMed] [Google Scholar]
- 38.Van Heeswijk R, Lachaert R, Leopold L, DeBeule K, McNeeley D, Hoetelmans R. 2007. The effect of CYP3A4 inhibition on the clinical pharmacokinetics of TMC207. abstr PS-71358–11 Proc. 38th World Conf. Lung Health, Cape Town, South Africa. [Google Scholar]
- 39.Mesens N, Verbeeck J, Rouan M. 2007. Elucidating the role of M2 in the preclinical safety profile of TMC207, abstr PS-71291–11 Proc. 38th World Conf. Lung Health, Cape Town, South Africa. [Google Scholar]
Associated Data
This section collects any data citations, data availability statements, or supplementary materials included in this article.