

Abstract
Azole antifungal agents such as fluconazole exhibit fungistatic activity against Candida albicans. Strategies to enhance azole antifungal activity would be therapeutically appealing. In an effort to identify transcriptional pathways that influence the killing activity of fluconazole, we sought to identify transcription factors (TFs) involved in this process. From a collection of C. albicans strains disrupted for genes encoding TFs (O. R. Homann, J. Dea, S. M. Noble, and A. D. Johnson, PLoS Genet. 5:e1000783, 2009, http://dx.doi.org/10.1371/journal.pgen.1000783), four strains exhibited marked reductions in minimum fungicidal concentration (MFCs) in both RPMI and yeast extract-peptone-dextrose (YPD) media. One of these genes, UPC2, was previously characterized with regard to its role in azole susceptibility. Of mutants representing the three remaining TF genes of interest, one (CAS5) was unable to recover from fluconazole exposure at concentrations as low as 2 μg/ml after 72 h in YPD medium. This mutant also showed reduced susceptibility and a clear zone of inhibition by Etest, was unable to grow on solid medium containing 10 μg/ml fluconazole, and exhibited increased susceptibility by time-kill analysis. CAS5 disruption in highly azole-resistant clinical isolates exhibiting multiple resistance mechanisms did not alter susceptibility. However, CAS5 disruption in strains with specific resistance mutations resulted in moderate reductions in MICs and MFCs. Genome-wide transcriptional analysis was performed in the presence of fluconazole and was consistent with the suggested role of CAS5 in cell wall organization while also suggesting a role in iron transport and homeostasis. These findings suggest that Cas5 regulates a transcriptional network that influences the response of C. albicans to fluconazole. Further delineation of this transcriptional network may identify targets for potential cotherapeutic strategies to enhance the activity of the azole class of antifungals.
INTRODUCTION
Candida albicans is the most prevalent opportunistic human fungal pathogen, causing mucosal, cutaneous, and systemic infections, including oropharyngeal candidiasis (OPC), which is the most common opportunistic infection among AIDS patients (1, 2). Candida species collectively are also the fourth leading cause of nosocomial infections and are associated with high mortality rates (3, 4). The azole antifungals, particularly fluconazole (FLC), are the most widely used antifungals for treatment of Candida infections (1). However, C. albicans exhibits inhibited growth in the presence of azole antifungals; thus, these agents are fungistatic against this organism (5). Identifying strategies to impart enhanced killing activity to the azoles could improve their efficacy against C. albicans and may also diminish the development of resistance.
In C. albicans, inhibition of the ergosterol biosynthesis pathway is not lethal (5). It is possible that specific stress responses may circumvent or counter the activity of the azoles. Such an adaptive response would permit fungal survival in the presence of these antifungal agents. Indeed, in response to antifungal stress, specific signal transduction and transcriptional activation programs are affected (6). Drug efflux pump and ergosterol biosynthesis gene expression (6), the Ras-cyclic AMP (cAMP)-protein kinase A (PKA) pathway (7), the calcineurin pathway (8–10), the Ssk1p/Chk1p pathway (11), and the cell wall integrity pathway (12, 13) have all been implicated in stress responses upon azole exposure, yet the transcriptional activation pathways involved in these processes have yet to be fully elucidated. Moreover, it is likely that additional biological processes influence susceptibility to the azole antifungals as well as their ability to kill C. albicans.
Recently, a library of C. albicans transcription factor (TF) mutants was created and examined under 55 different growth conditions. Phenotypic profiling of the responses to various stress agents, including fluconazole, identified the possible biological roles of many previously uncharacterized TFs (14). While initial screens identified several TFs that affect fluconazole susceptibility, we undertook a more comprehensive analysis of this library in order to identify transcriptional activation programs that influence fluconazole killing activity and would therefore be implicated in the mechanisms by which C. albicans survives in the presence of the azoles. We identified one TF in particular, Cas5, whose disruption resulted in enhanced azole killing activity. This indicates a role for the Cas5 transcriptional network in the response of C. albicans to the azole antifungal agents.
MATERIALS AND METHODS
Strains and growth conditions.
All C. albicans strains (see Table S1 in the supplemental material) were stored as frozen stocks in 40% glycerol at −80°C. YPD (1% yeast extract, 2% peptone, and 2% dextrose) agar plates and YPD liquid medium were used for routine growth of strains at 30°C (15–17). For CFU counts during time-kill analysis, PDA (0.4% potato starch, 2% dextrose, and 1.5% agar) plates were used, and cultures grown on PDA were incubated at 35°C.
Drug susceptibility testing.
The MICs of fluconazole were determined by using broth microdilution as described by the Clinical and Laboratory Standards Institute (18, 19), modified by using both RPMI and YPD media, and were read both visually and spectrophotometrically at 24, 48, and 72 h for at least a 50% reduction in growth (20–22). Minimum fungicidal concentrations (MFCs) were measured by removing 2 μl from each well of the MIC plate and plating onto Sabouraud dextrose (SD) or YPD agar, respectively (23, 24). The MFC was defined as the lowest drug concentration that yielded no growth on plates. All MIC and MFC determinations were reproduced in triplicate. Also, serial dilutions from a suspension at an optical density at 600 nm (OD600) of 0.1 were diluted 4-fold, and 2 μl of each dilution was plated onto YPD agar plates with and without 10 μg/ml fluconazole and then incubated at 30°C for 24 and 48 h. Fluconazole activity was also assessed by using Epsilometer test (Etest) strips (bioMérieux) according to the manufacturer's instructions, with the following modifications. Plates containing Etest strips were incubated at 30°C to mimic growth conditions utilized for MFC determinations and serial dilutions. A standardized cell suspension (0.5 McFarland standard) was used to create a confluent lawn across YPD agar plates prior to Etest strip placement and then incubated at 30°C for 24 and 48 h. Time-kill analyses were performed with a cell suspension at a 0.5 McFarland standard, which was diluted 10-fold into YPD medium with or without 10 μg/ml fluconazole and incubated at 35°C (25). Aliquots were removed at 0, 6, 12, and 24 h; 10-fold serially diluted; and plated onto PDA agar plates. CFU were counted after 48 h at 35°C, and the means and standard errors were plotted on a log-scale curve versus time. Time-kill experiments were run in triplicate.
Screening of the TF library.
We screened a collection of strains disrupted for genes encoding transcription factors (14) in order to identify those genes required for normal susceptibility to fluconazole. We first subjected these strains to susceptibility testing for determination of both MIC by broth microdilution (18, 19) and MFC (23, 24) in RPMI medium using a 48-h endpoint and a dilution range of 0.007 to 4 μg/ml. Mutants exhibiting any reduction in MIC were then rescreened in rich YPD medium using a dilution range of 0.125 to 64 μg/ml. For this secondary screen, an earlier endpoint of 24 h was used, as by 48 h, the parent strain, SN152, was able to resume growth at the later time point at all concentrations of fluconazole tested. We then selected any mutant that exhibited a reduction in MFC in both screens for further study. Independent mutants were constructed for these transcription factor genes of interest in the SC5314 background.
Construction of gene deletion strains.
Plasmid pBSS2 contains the entire SAT1-flipper disruption cassette from pSFS2 in a pBluescript vector backbone. The SAT1-flipper cassette consists of the SAT1 selectable marker, which confers resistance to nourseothricin, and the FLP flipper recombinase gene, both flanked by FRT (flipper recombinase target) sites. The target gene's 5′-flanking sequence was cloned upstream of the SAT1-flipper cassette, while the 3′-flanking sequence was cloned downstream of the SAT1-flipper cassette (see Table S2 in the supplemental material). Upon transformation into C. albicans strain SC5314, the SAT1-flipper cassette was inserted into the coding region of one allele, and positive transformants (nourseothricin resistant [NouR]) were selected on YPD-nourseothricin agar plates containing 200 μg/ml of nourseothricin. Induction of the FLP gene occurred by growing the transformants in YPD medium for 24 h without selective pressure. Positive cells (nourseothricin susceptible [NouS]) were selected by replica plating onto YPD plates with or without 200 μg/ml of nourseothricin. Upon induction of the FLP gene, the cassette was excised such that only one copy of the FRT site remained in the locus. Another round was required to disrupt the second allele (26).
For gene complementation, the target gene's open reading frame (ORF) plus or minus ∼1 kb was cloned in place of the target gene's 5′-flanking sequence in the above-mentioned disruption cassette. Upon transformation into strain SC5314, one allele of the gene's coding region was inserted into the original locus in conjunction with the SAT1-flipper cassette, and positive transformants (NouR) were selected on YPD-nourseothricin agar plates containing 200 μg/ml of nourseothricin. Induction of the FLP gene occurred by growing the transformants in YPD medium for 24 h without selective pressure. Positive cells (NouS) were selected by replica plating onto YPD plates with or without 200 μg/ml of nourseothricin. Upon induction of the FLP gene, the cassette was excised such that only the gene's allele with a downstream FRT site was left in the locus. Appropriate gene disruption and complementation were confirmed by Southern hybridization (26).
Isolation of genomic DNA and Southern hybridization.
Genomic DNA was isolated as described previously (27). DNA (4 μg per sample) was digested with an appropriate restriction endonuclease, resolved on a 1% agarose gel, and, after staining with ethidium bromide, transferred by vacuum blotting onto a nylon membrane and fixed by UV cross-linking. Southern hybridization with enhanced chemiluminescence-labeled probes was performed with the Amersham ECL Direct nucleic acid labeling and detection system according to the instructions provided by the manufacturer.
RNA isolation for quantitative reverse transcription-PCR (qRT-PCR).
RNA was isolated by using a small-scale modification of the hot-phenol method of RNA isolation described previously by Schmitt et al. (28). Briefly, cultures grown overnight were diluted to an OD600 of 0.2 in 20 ml YPD medium and then incubated at 30°C with shaking for 3 h. Cells were collected by centrifugation, medium was decanted, and cell pellets were stored at −80°C. Cells were resuspended in 950 μl of AE buffer (50 mM sodium acetate [pH 5.3], 10 mM EDTA [pH 8.0]) and then transferred into a 2-ml RNase-free microcentrifuge tube containing 950 μl acid phenol (pH 4.3) with 1% SDS. Cells were incubated with agitation at 65°C for 10 min, and lysates were then clarified by centrifugation. The supernatant was then divided into two new 2-ml microcentrifuge tubes, each containing 950 μl of chloroform, and mixed. The sample was then subjected to centrifugation again, and the top aqueous layer was transferred into a new tube containing 1 ml of isopropanol and 100 μl 2 M sodium acetate. The RNA pellet was subsequently washed with 500 μl of 70% ethanol and collected by centrifugation. The RNA was then suspended in DNase/RNase-free H2O. Quantity and purity were determined spectrophotometrically at A260 and A280.
Quantitative RT-PCR.
First-strand cDNAs were synthesized from 1 μg of total RNA by using a SuperScript first-strand synthesis system for qRT-PCR (Invitrogen). Gene-specific primers (see Table S2 in the supplemental material) were designed by using Primer Express software (Applied Biosystems) and synthesized by Integrated DNA Technologies (Coralville, IA). Quantitative PCRs were performed in triplicate by using the 7000 sequence detection system (Applied Biosystems), independently amplifying ACT1 (normalizing gene) and the genes of interest, as described previously (29). To assess statistical significance, the Student t test was performed by using a significance level of 0.05.
RNA isolation for microarray.
RNA was isolated by using a large-scale version of the hot-phenol method of RNA isolation described by previously by Schmitt et al. (28). Briefly, cultures grown overnight were diluted to an OD600 of 0.005 in 100 ml YPD medium and then incubated at 30°C with shaking for an additional 8 h to an OD600 of 1.0. Cultures were diluted again to an OD600 of 0.025 in 100 ml fresh YPD medium, allowed to incubate at 30°C with shaking for one doubling, inoculated with or without 10 μg/ml fluconazole, and then incubated at 30°C with shaking for 6 h. Cells were collected by centrifugation and stored at −80°C. Cell pellets were resuspended in 12 ml of AE buffer and then transferred into 50-ml Oak Ridge tubes treated with RNase Away (Molecular BioProducts) containing 12 ml acid phenol (pH 4.3) with 1% SDS. Cells were incubated at 65°C for 10 min, and lysates were then clarified by centrifugation. The supernatant was then transferred into a new tube containing 15 ml of chloroform and mixed. The sample was then subjected to centrifugation again, and the top aqueous layer was transferred into a new tube containing 1 volume of isopropanol and 0.1 volume of 2 M sodium acetate. The RNA pellet was subsequently washed with 10 ml of 70% ethanol and collected by centrifugation. The RNA pellet was resuspended in DNase/RNase-free H2O. Quantity and purity were determined spectrophotometrically at A260 and A280.
Transcriptional profiling.
Gene expression profiles were obtained by hybridizing labeled cRNAs generated from C. albicans total RNA onto Affymetrix C. albicans custom expression arrays (CAN07; catalog number 49-5241) (30), which were described previously (31). Microarray hybridization and analysis were performed as described previously (31). Genes were considered to be differentially expressed in response to drug if their expression level changed by ≥1.5-fold in two independent experiments. Genes induced by fluconazole were considered to be CAS5 dependent if induction was abrogated in the deletion mutant ≥2.0-fold (50%) less than in the wild type.
Microarray data accession number.
All microarray data are available for download from the NCBI at the Gene Expression Omnibus website (http://www.ncbi.nlm.nih.gov/geo) under accession number GSE57930.
RESULTS
Disruption of Cas5 enhances fluconazole killing activity against C. albicans.
In order to identify transcriptional activation programs that influence the killing activity of the azole antifungals against C. albicans, we first screened a collection of TF deletion mutants for those mutants that displayed increased fluconazole susceptibility, as measured by broth microdilution in RPMI medium (14). In order to detect marked reductions in MICs, a smaller range of fluconazole concentrations, from 0.007 to 4 μg/ml, was used, and 19 TFs from the library with reductions in fluconazole MICs at 48 h in RPMI medium were identified. These hits were then rescreened for those TFs that also displayed reductions in fluconazole MFCs in both RPMI (48 h) and YPD (24 h) media (see Table S3 in the supplemental material). We identified four TF mutants that met the criteria: CAS5, RPN4, UPC2, and CZF1 (Table 1). The observation that disruption of UPC2 increased susceptibility to fluconazole was not surprising, as this was reported previously (20, 32, 33), validating the results of our screen. The remaining three TF deletion mutants that exhibited reductions in MFCs in both RPMI and YPD media were prioritized as being of the greatest interest, and independent mutants were generated in the SC5314 background (Table 2). In order to determine the extent to which disruption of these TF genes impacts the killing activity of fluconazole, the deletion mutants were subjected to various susceptibility tests using nutrient-rich YPD medium in order to detect strong phenotypes despite existing in an environment that promotes growth.
TABLE 1.
Library hits with reduced MICs and MFCs in both RPMI (48 h) and YPD (24 h) mediuma
| Clone | CGD name | orf19 designation | MIC (μg/ml) |
MFC (μg/ml) |
||
|---|---|---|---|---|---|---|
| RPMI | YPD | RPMI | YPD | |||
| WT | 0.25 | 0.5 | >4 | >64 | ||
| TF3 | RPN4 | orf19.1069 | 0.0625 | 0.25 | 0.125 | 32 |
| TF33 | CAS5 | orf19.4670 | 0.125 | 0.25 | 4 | 2 |
| TF77 | UPC2 | orf19.391 | 0.03125 | 0.125 | 1 | 1 |
| TF104 | CZF1 | orf19.3127 | 0.0625 | 0.5 | 0.25 | 8 |
WT, wild type; CGD, Candida Genome Database.
TABLE 2.
MICs and MFCs in YPD medium in the SC5314 background
| Strain | Relevant genotypea | MIC (μg/ml) |
MFC (μg/ml) |
||||
|---|---|---|---|---|---|---|---|
| 24 h | 48 h | 72 h | 24 h | 48 h | 72 h | ||
| SC5314 | CAS5/CAS5 | 0.5 | 0.5 | >64 | >64 | >64 | >64 |
| cas5Δ/Δ | cas5Δ::FRT/cas5Δ::FRT | 0.5 | 1 | 1 | 1 | 1 | 1 |
| cas5Δ/Δ+CAS5 | cas5Δ::FRT/CAS5-caSAT1 | 0.5 | 0.5 | >64 | >64 | >64 | >64 |
| rpn4Δ/Δ | rpn4Δ::FRT/rpn4Δ::FRT | 0.5 | 1 | >64 | 8 | 8 | 8 |
| rpn4Δ/Δ+RPN4 | rpn4Δ::FRT/RPN4-caSAT1 | 0.5 | 0.5 | >64 | >64 | >64 | >64 |
| czf1Δ/Δ | czf1Δ::FRT/czf1Δ::FRT | 0.5 | 0.5 | >64 | >64 | >64 | >64 |
caSAT1, C. albicans SAT1.
CAS5 and RPN4 disruption had a moderate impact on fluconazole MICs and a marked impact on MFCs determined by broth microdilution (Table 2) and Etest (Fig. 1A), while disruption of CZF1 had no impact by all methods (data not shown). It should be noted that the disruption of CAS5 resulted in slightly slower growth, which may explain the subtle changes in fluconazole susceptibility that were observed. The fluconazole MFC at 24 h in YPD for SC5314 was >64 μg/ml, whereas those for the cas5Δ/Δ, rpn4Δ/Δ, and czf1Δ/Δ mutants were 1, 8, and >64 μg/ml, respectively (Table 2), indicating that CZF1 could not be independently confirmed as influencing susceptibility to fluconazole, and therefore, CZF1 did not proceed through any further examination. For SC5314, the 48-h MIC determined by Etest was 1.0 μg/ml, and a halo of reduced growth was observed up to the Etest strip, consistent with the fungistatic nature of fluconazole. At 48 h, the MICs determined by Etest for the cas5Δ/Δ and rpn4Δ/Δ mutants were 0.25 μg/ml and 1.5 μg/ml, respectively. A large clear zone of inhibition was observed for the cas5Δ/Δ mutant, but the zone of inhibition was smaller for the rpn4Δ/Δ mutant (Fig. 1A). Similar changes in fluconazole MICs, MFCs, and zones of inhibition determined by Etest were likewise observed for the previously reported cas5Δ/Δ mutant strain 1186 compared to its parent strain BWP17 (data not shown) (34). Using a 72-h endpoint for a broth microdilution assay using YPD medium as a way to assess the requirement of CAS5 for growth in the presence of fluconazole, we found that SC5314 and the rpn4Δ/Δ mutant were able to resume growth at all concentrations of fluconazole tested, whereas the cas5Δ/Δ mutant grew only at the lowest concentrations (Fig. 1B). When cells were plated onto YPD agar plates containing 10 μg/ml of fluconazole, growth was reduced for the cas5Δ/Δ mutant but only slightly for the rpn4Δ/Δ mutant compared to SC5314 (Fig. 1C). Time-kill analysis showed enhanced killing activity for 10 μg/ml fluconazole against the cas5Δ/Δ mutant but not the rpn4Δ/Δ mutant compared to the parent strain (Fig. 1D). RPN4 was not pursued in further analyses due to its minimal impact at the therapeutically relevant concentration of fluconazole, 10 μg/ml. All phenotypes were reverted by reintegration of one allele of the disrupted gene.
FIG 1.

(A) Effect of CAS5 and RPN4 on MIC and growth on YPD agar as determined by Etest. A confluent lawn of C. albicans was streaked prior to the addition of Etest strips and then incubated for 48 h. (B) MIC heat map of SC5314, mutants, and complemented derivatives. Susceptibility was determined by broth microdilution in YPD medium at 72 h. Growth was quantified spectrophotometrically and assigned to a colorimetric scale. (C) Effect of CAS5 and RPN4 on growth on solid medium containing fluconazole. From 4-fold serial dilutions of C. albicans strains, 2-μl aliquots were spotted onto YPD agar with or without 10 μg/ml FLC and incubated for 48 h. (D) Effect of fluconazole on CAS5 and RPN4 in time-kill assays. SC5314, cas5Δ/Δ, or rpn4Δ/Δ cells were diluted in YPD medium containing FLC (10 μg/ml) or the solvent dimethyl sulfoxide (DMSO). After 0, 6, 12, and 24 h, samples from each dilution were diluted and plated for CFU. Shown are the means of data from three independent experiments with standard error bars.
Disruption of Cas5 does not override combinations of clinical drug resistance mechanisms.
In order to determine whether Cas5 influences the fluconazole susceptibility of azole-resistant clinical isolates, we constructed cas5Δ/Δ mutant strains in the background of an azole-resistant clinical isolate (12-99) known to constitutively maintain four of the most common mechanisms of azole resistance: overexpression of CDR1 and CDR2, overexpression of MDR1, overexpression of ERG11, and mutation in ERG11 (35). The disruption of CAS5 in isolate 12-99 (12-99cas5Δ/Δ) did not result in a reduction in the MIC or MFC and therefore was not able to overcome the combined mechanisms of resistance operative in this isolate (Table 3). Time-kill analysis revealed an overall growth defect, but this did not alter the effect of fluconazole against 12-99cas5Δ/Δ at 10 μg/ml (Fig. 2).
TABLE 3.
MICs and MFCs in YPD medium in the background of resistant clinical strains
| Strain | Relevant characteristic or genotype | MIC (μg/ml) |
MFC (μg/ml) |
||||
|---|---|---|---|---|---|---|---|
| 24 h | 48 h | 72 h | 24 h | 48 h | 72 h | ||
| SC5314 | CAS5/CAS5 | 0.5 | 0.5 | >64 | >64 | >64 | >64 |
| 2-79 | Susceptible isolate | 1 | 1 | >64 | >64 | >64 | >64 |
| 12-99 | Resistant isolate | >64 | >64 | >64 | >64 | >64 | >64 |
| 12-99cas5Δ/Δ | cas5Δ::FRT/cas5Δ::FRT | >64 | >64 | >64 | >64 | >64 | >64 |
| G2 | Susceptible isolate | 1 | >64 | >64 | >64 | >64 | >64 |
| G5 | Resistant isolate | >64 | >64 | >64 | >64 | >64 | >64 |
| G5cas5Δ/Δ | cas5Δ::FRT/cas5Δ::FRT | 32 | 32 | 32 | >64 | >64 | >64 |
| Gu2 | Susceptible isolate | 0.5 | 1 | >64 | >64 | >64 | >64 |
| Gu5 | Resistant isolate | >64 | >64 | >64 | >64 | >64 | >64 |
| Gu5cas5Δ/Δ | cas5Δ::FRT/cas5Δ::FRT | >64 | >64 | >64 | >64 | >64 | >64 |
| S1 | Susceptible isolate | 2 | >64 | >64 | >64 | >64 | >64 |
| S2 | Resistant isolate | >64 | >64 | >64 | >64 | >64 | >64 |
| S2cas5Δ/Δ | cas5Δ::FRT/cas5Δ::FRT | 64 | >64 | >64 | >64 | >64 | >64 |
FIG 2.
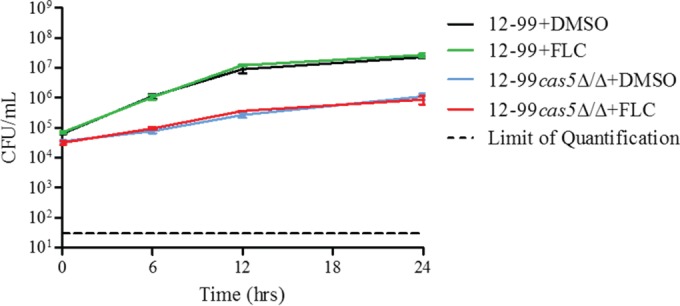
Effect of fluconazole on CAS5 in 12-99 as determined by time-kill assays. 12-99 or 12-99cas5Δ/Δ cells were diluted in YPD medium containing FLC (10 μg/ml) or the solvent dimethyl sulfoxide (DMSO). After 0, 6, 12, and 24 h, samples from each dilution were diluted and plated for CFU. Shown are the means of data from three independent experiments with standard error bars.
Isolate 12-99 simultaneously overexpresses CDR1 and CDR2 as well as MDR1 (36). Since previous studies have shown that azole-resistant isolates usually do not simultaneously overexpress these transporter genes (37–39), CAS5 was also disrupted in clinical isolates S2, G5, and Gu5. Isolate S2 was previously shown to have a G-to-S amino acid substitution at position 464 (G464S) in Upc2p, which renders it constitutively active, resulting in the upregulation of ERG11 and increased fluconazole resistance (30, 40). Isolate G5 has a G997V amino acid substitution in Mrr1p, resulting in increased MDR1 expression levels, and is also homozygous for an ERG11 mutation (40, 41). Isolate Gu5 displays increased expression levels of CDR1 and CDR2 (42). As with isolate 12-99, the disruption of CAS5 in these three clinical isolates did not markedly alter the MIC or MFC in these resistant backgrounds when examined by broth microdilution (Table 3).
Disruption of CAS5 in strains containing resistance mutations in MRR1, TAC1, and ERG11 impacts fluconazole susceptibility.
Since the deletion of CAS5 was unable to override common resistance mechanisms acting together, we sought to investigate the requirement for CAS5 for specific mechanisms of resistance. Independent mutants were constructed in strains containing two copies of a gene conferring reduced susceptibility to fluconazole: MRR1 encoding a P683S mutation (MRR1P683S), TAC1G980E, UPC2G648D, or ERG11K143R. The MRR1P683S, TAC1G980E, and UPC2G648D alleles contain gain-of-function (GOF) mutations which render the transcription factors that they encode constitutively active, resulting in the upregulation of MDR1, CDR1 and CDR2, and ERG11, respectively, and decreased fluconazole susceptibility (30, 40, 43–45). The ERG11K143R allele contains a point mutation postulated to be located near the azole access channel, interfering with the entry of fluconazole, which results in decreased fluconazole susceptibility (46). Interestingly, we observed that UPC2G648D cas5Δ/Δ mutant cells were larger than those of the parent strain and also were elongated and clumped together. As a result, susceptibility testing results by both broth microdilution and Etest for this strain were inconsistent due to the extreme variability in optical density versus cell density and therefore were not reported. The disruption of CAS5 in each remaining background did not markedly impact the MICs at 24 h but did result in reductions in MICs at later time points by all methods. The MFCs at 48 h in YPD medium for ERG11K143R cas52Δ/Δ, MRR1P683S cas5Δ/Δ, and TAC1G980E cas5Δ/Δ mutants were all reduced from 8 μg/ml, >64 μg/ml, and >64 μg/ml in their background strains to 4 μg/ml, 8 μg/ml, and 16 μg/ml, respectively (Table 4). At 48 h, the MICs for ERG11K143R cas52Δ/Δ, MRR1P683S cas5Δ/Δ, and TAC1G980E cas5Δ/Δ mutants determined by Etest were all reduced from 1.5 μg/ml, 6 μg/ml, and 8 μg/ml in their background strains to 0.5 μg/ml, 1.5 μg/ml, and 6 μg/ml, respectively (Fig. 3A). When cells were plated onto YPD agar plates containing 10 μg/ml fluconazole, growth was slightly reduced in the presence of fluconazole for the cas5Δ/Δ mutants compared to their respective backgrounds (Fig. 3B).
TABLE 4.
MICs and MFCs in YPD in the background of strains expressing resistance mechanisms
| Strain | Relevant characteristic or genotype | MIC (μg/ml) |
MFC (μg/ml) |
||||
|---|---|---|---|---|---|---|---|
| 24 h | 48 h | 72 h | 24 h | 48 h | 72 h | ||
| SC5314 | CAS5/CAS5 | 0.5 | 0.5 | >64 | >64 | >64 | >64 |
| ERG11K143R | ERG11K143R::FRT/ERG11K143R::FRT CAS5/CAS5 | 4 | 8 | 8 | 4 | 8 | 8 |
| ERG11K143R cas5Δ/Δ | ERG11K143R::FRT/ERG11K143R::FRT cas5Δ::FRT/cas5Δ::FRT | 4 | 4 | 4 | 4 | 4 | 4 |
| MRR1P683S | MRR1P683S::FRT/MRR1P683S::FRT CAS5/CAS5 | 8 | 16 | >64 | >64 | >64 | >64 |
| MRR1P683S cas5Δ/Δ | MRR1P683S::FRT/MRR1P683S::FRT cas5Δ::FRT/cas5Δ::FRT | 8 | 8 | 8 | 8 | 8 | 8 |
| TAC1G980E | TAC1G980E::FRT/TAC1G980E::FRT CAS5/CAS5 | 8 | 16 | >64 | >64 | >64 | >64 |
| TAC1G980E cas5Δ/Δ | TAC1G980E::FRT/TAC1G980E::FRT cas5Δ::FRT/cas5Δ::FRT | 8 | 16 | 16 | 16 | 16 | 16 |
FIG 3.

(A) Effect of CAS5 in isogenic resistant backgrounds on MIC and growth on YPD agar as determined by Etest. A confluent lawn of C. albicans was streaked prior to the addition of Etest strips and then incubated for 48 h. (B) Effect of CAS5 on the ability of isogenic strains to grow on solid medium containing fluconazole. From 4-fold serial dilutions of C. albicans strains, 2-μl aliquots were spotted onto YPD agar with or without 10 μg/ml FLC and incubated for 48 h.
Expression of ERG11, CDR1, CDR2, and MDR1 when CAS5 is disrupted in resistant backgrounds.
One possible explanation for the enhanced killing activity of fluconazole in the absence of Cas5 could be decreased expression levels of ERG11 or genes encoding the Cdr1 and Cdr2 or Mdr1 efflux pump. In order to determine if this was the case, we measured ERG11, CDR1, CDR2, and MDR1 mRNA abundances by qRT-PCR in strains containing a single resistance mechanism and their respective cas5Δ/Δ mutants (Fig. 4). Interestingly, the cas5Δ/Δ mutant constructed in the SC5314 background showed a slight reduction in the baseline ERG11 expression level. This was also the case for the cas5Δ/Δ mutants constructed in the MRR1P683S and UPC2G648D backgrounds. Disruption of CAS5 did not result in decreased CDR1 expression levels. Alternatively, disruption of CAS5 increased CDR2 expression levels in all backgrounds, except for TAC1G980E and MRR1P683S. Likewise, MDR1 expression levels also increased with the disruption of TAC1 in the SC5314 and TAC1G980E backgrounds. The significance of the increased expression levels of these transporter genes is unclear. These data suggest that the enhanced killing activity of fluconazole observed for resistant strains lacking CAS5 is not due to decreased levels of transporter gene expression. Instead, the observed phenotypes may be associated with reductions in ERG gene expression levels, particularly ERG11.
FIG 4.

Expression levels of ERG11, CDR1, CDR2, and MDR1 in mutants compared to those in SC5314. Expression levels of ERG11, CDR1, CDR2, and MDR1 were measured in triplicate by qRT-PCR and compared to the expression levels in SC5314. Error bars represent the standard errors of the means. Asterisks represent significance levels (*, P < 0.05; **, P < 0.01).
Comparison of the gene expression profiles of wild-type strain SC5314 and the cas5Δ/Δ mutant exposed to fluconazole.
In order to identify genes whose expression in response to fluconazole is influenced by Cas5, we compared the transcriptional profiles of SC5314 and its cas5Δ/Δ derivative after treatment with or without 10 μg/ml fluconazole for 6 h. Genes were considered to be differentially expressed in response to fluconazole if their expression levels changed by ≥1.5-fold in two independent experiments (see Dataset S1 in the supplemental material). Fluconazole-inducible genes were also considered to be CAS5 dependent if their induction was abrogated in the deletion mutant and was ≥2.0-fold (50%) less than that of SC5314. Using these criteria, there were 209 genes upregulated by fluconazole whose induction was abrogated in the absence of CAS5 (Table 5). The most common biological processes represented by these genes include transport, response to chemical stimulus, the oxidation-reduction process, filamentous growth, the lipid metabolic process, and cell wall organization. Interestingly, there were also six genes involved in iron ion transport, binding, and homeostasis (CFL2, CFL4, FET34, FRE10, FTR1, and orf19.1411).
TABLE 5.
Genes upregulated by ≥1.5-fold by fluconazole that are dependent upon Cas5
| Processa | orf19 designation | CGD | Fold change in expression |
|||||
|---|---|---|---|---|---|---|---|---|
| SC5314 + FLC/SC5314 (A) |
cas5Δ/Δ+ FLC/cas5Δ/Δ (B) |
B/A ratio |
||||||
| Expt 1 | Expt 2 | Expt 1 | Expt 2 | Expt 1 | Expt 2 | |||
| Lipid metabolic process | orf19.10 | ALK8 | 9.0 | 8.1 | 3.0 | 3.5 | 0.3 | 0.4 |
| orf19.2248 | ARE2 | 1.7 | 1.6 | 0.7 | 0.7 | 0.4 | 0.4 | |
| orf19.2670 | 1.6 | 1.8 | 0.4 | 0.4 | 0.3 | 0.2 | ||
| orf19.2909 | ERG26 | 2.4 | 1.7 | 0.9 | 0.9 | 0.4 | 0.5 | |
| orf19.4897 | SFH5 | 2.4 | 2.4 | 1.3 | 1.2 | 0.5 | 0.5 | |
| orf19.4982 | 2.1 | 2.3 | 0.9 | 0.6 | 0.4 | 0.3 | ||
| orf19.5640 | PEX5 | 2.2 | 2.6 | 0.9 | 0.9 | 0.4 | 0.3 | |
| orf19.5751 | ORM1 | 3.3 | 3.6 | 1.6 | 1.7 | 0.5 | 0.5 | |
| orf19.6594 | PLB3 | 2.1 | 3.4 | 1.1 | 0.9 | 0.5 | 0.3 | |
| Cell wall organization | orf19.212 | VPS28 | 1.7 | 2.1 | 0.5 | 0.5 | 0.3 | 0.3 |
| orf19.5302 | PGA31 | 17.6 | 4.1 | 2.1 | 1.5 | 0.1 | 0.4 | |
| orf19.5644 | 2.3 | 3.5 | 1.1 | 1.0 | 0.5 | 0.3 | ||
| orf19.6102 | RCA1 | 2.5 | 3.4 | 1.2 | 1.2 | 0.5 | 0.4 | |
| orf19.6420 | PGA13 | 15.6 | 30.6 | 2.4 | 2.3 | 0.2 | 0.1 | |
| orf19.6481 | YPS7 | 1.6 | 2.3 | 0.4 | 0.4 | 0.3 | 0.2 | |
| orf19.719 | 1.8 | 3.3 | 1.0 | 1.0 | 0.5 | 0.3 | ||
| Iron ion transport | orf19.1415 | FRE10 | 2.0 | 4.2 | 0.9 | 2.3 | 0.5 | 0.5 |
| orf19.1932 | CFL4 | 35.6 | 359 | 2.4 | 6.6 | 0.1 | 0.0 | |
| orf19.4215 | FET34 | 2.1 | 5.2 | 0.2 | 0.5 | 0.1 | 0.1 | |
| orf19.7219 | FTR1 | 3.2 | 7.8 | 0.5 | 1.1 | 0.1 | 0.1 | |
| Iron ion binding | orf19.1411 | 2.7 | 4.8 | 1.1 | 0.9 | 0.4 | 0.2 | |
| Iron ion homeostasis | orf19.1264 | CFL2 | 2.0 | 6.0 | 0.6 | 0.5 | 0.3 | 0.1 |
| Transport | orf19.111 | CAN2 | 1.7 | 13.0 | 0.7 | 1.5 | 0.4 | 0.1 |
| orf19.1252 | YME1 | 1.9 | 3.0 | 1.0 | 0.7 | 0.5 | 0.2 | |
| orf19.1313 | CDR3 | 1.9 | 2.1 | 0.9 | 1.0 | 0.5 | 0.5 | |
| orf19.1352 | TIM22 | 3.6 | 4.4 | 0.9 | 1.1 | 0.2 | 0.3 | |
| orf19.1563 | ECM3 | 1.5 | 1.5 | 0.4 | 0.6 | 0.3 | 0.4 | |
| orf19.1867 | 2.6 | 4.2 | 0.7 | 0.6 | 0.3 | 0.2 | ||
| orf19.2073 | 1.5 | 1.6 | 0.6 | 0.5 | 0.4 | 0.3 | ||
| orf19.2292 | OPT4 | 5.2 | 3.7 | 1.2 | 1.0 | 0.2 | 0.3 | |
| orf19.2350 | 2.5 | 4.1 | 0.6 | 1.0 | 0.3 | 0.3 | ||
| orf19.2810 | AAP1 | 18.9 | 19.6 | 7.5 | 8.8 | 0.4 | 0.4 | |
| orf19.2946 | HNM4 | 8.4 | 4.9 | 2.9 | 2.5 | 0.3 | 0.5 | |
| orf19.3015 | ARX1 | 2.7 | 3.9 | 1.3 | 1.7 | 0.5 | 0.4 | |
| orf19.3195 | HIP1 | 1.5 | 2.6 | 0.6 | 0.7 | 0.4 | 0.3 | |
| orf19.3232 | 24.6 | 5.3 | 2.6 | 1.0 | 0.1 | 0.2 | ||
| orf19.3574 | MDJ2 | 5.6 | 3.1 | 2.0 | 1.2 | 0.4 | 0.4 | |
| orf19.4041 | PEX4 | 4.9 | 4.3 | 1.3 | 1.5 | 0.3 | 0.4 | |
| orf19.4090 | 2.1 | 1.7 | 1.1 | 0.8 | 0.5 | 0.5 | ||
| orf19.4372 | 1.8 | 3.0 | 0.6 | 0.6 | 0.3 | 0.2 | ||
| orf19.4384 | HXT5 | 70.6 | 75.5 | 11.1 | 23.4 | 0.2 | 0.3 | |
| orf19.4546 | HOL4 | 4.3 | 5.1 | 1.7 | 2.3 | 0.4 | 0.4 | |
| orf19.4682 | HGT17 | 45.0 | 24.7 | 7.0 | 7.3 | 0.2 | 0.3 | |
| orf19.4887 | ECM21 | 2.7 | 3.1 | 0.8 | 1.0 | 0.3 | 0.3 | |
| orf19.5539 | 1.6 | 1.6 | 0.7 | 0.8 | 0.5 | 0.5 | ||
| orf19.5902 | RAS2 | 7.6 | 6.2 | 0.8 | 1.1 | 0.1 | 0.2 | |
| orf19.5958 | CDR2 | 2.1 | 2.5 | 0.9 | 1.0 | 0.4 | 0.4 | |
| orf19.6117 | 1.5 | 2.3 | 0.6 | 0.4 | 0.4 | 0.2 | ||
| orf19.6249 | HAK1 | 4.4 | 10.7 | 2.1 | 3.2 | 0.5 | 0.3 | |
| orf19.6648 | SDA1 | 3.2 | 6.8 | 1.6 | 3.2 | 0.5 | 0.4 | |
| orf19.6993 | GAP2 | 21.7 | 8.6 | 3.0 | 4.5 | 0.1 | 0.5 | |
| orf19.7056 | 6.2 | 120.3 | 2.5 | 2.7 | 0.4 | 0.0 | ||
| orf19.7093 | HGT13 | 30.7 | 13.2 | 2.0 | 1.5 | 0.1 | 0.1 | |
| orf19.7094 | HGT12 | 423.2 | 19.8 | 8.0 | 1.9 | 0.0 | 0.1 | |
| Response to chemical stimulus | orf19.2060 | SOD5 | 33.2 | 14.2 | 5.4 | 6.1 | 0.2 | 0.4 |
| orf19.2838 | 2.5 | 2.9 | 0.8 | 0.7 | 0.3 | 0.3 | ||
| orf19.2876 | CBF1 | 2.3 | 3.2 | 0.5 | 0.5 | 0.2 | 0.2 | |
| orf19.3159 | UTP20 | 3.8 | 8.9 | 1.9 | 3.5 | 0.5 | 0.4 | |
| orf19.3736 | KAR4 | 2.8 | 2.6 | 1.2 | 1.0 | 0.4 | 0.4 | |
| orf19.4015 | CAG1 | 3.1 | 3.6 | 0.8 | 0.7 | 0.3 | 0.2 | |
| orf19.4317 | GRE3 | 1.5 | 1.5 | 0.8 | 0.6 | 0.5 | 0.4 | |
| orf19.4318 | MIG1 | 1.7 | 2.1 | 0.7 | 1.0 | 0.4 | 0.5 | |
| orf19.5326 | 1.5 | 1.9 | 0.6 | 0.7 | 0.4 | 0.4 | ||
| orf19.5591 | ADO1 | 2.4 | 2.9 | 01.1 | 1.5 | 0.4 | 0.5 | |
| orf19.6202 | RBT4 | 3.3 | 6.2 | 1.6 | 2.2 | 0.5 | 0.3 | |
| orf19.6881 | YTH1 | 1.9 | 2.0 | 0.9 | 0.9 | 0.4 | 0.4 | |
| orf19.7316 | 2.0 | 2.3 | 0.7 | 0.8 | 0.3 | 0.3 | ||
| orf19.7384 | NOG1 | 3.7 | 7.2 | 1.2 | 2.1 | 0.3 | 0.3 | |
| Filamentous growth | orf19.2397.3 | 2.0 | 4.3 | 0.9 | 1.2 | 0.5 | 0.3 | |
| orf19.4055 | 1.9 | 2.5 | 0.9 | 0.7 | 0.5 | 0.3 | ||
| orf19.4815 | YTM1 | 2.3 | 3.2 | 0.6 | 1.4 | 0.3 | 0.4 | |
| orf19.4928 | SEC2 | 2.0 | 2.1 | 0.4 | 0.4 | 0.2 | 0.2 | |
| orf19.5741 | ALS1 | 66.8 | 79.0 | 22.6 | 21.0 | 0.3 | 0.3 | |
| orf19.5798 | LIG4 | 1.8 | 2.6 | 0.9 | 0.8 | 0.5 | 0.3 | |
| orf19.6595 | RTA4 | 10.4 | 15.0 | 3.0 | 2.9 | 0.3 | 0.2 | |
| orf19.6888 | 4.3 | 5.7 | 1.4 | 1.1 | 0.3 | 0.2 | ||
| orf19.7313 | SSU1 | 4.5 | 4.8 | 1.3 | 1.1 | 0.3 | 0.2 | |
| orf19.7374 | CTA4 | 1.7 | 2.2 | 0.8 | 1.1 | 0.5 | 0.5 | |
| orf19.7436 | AAF1 | 2.0 | 4.4 | 1.0 | 1.2 | 0.5 | 0.3 | |
| orf19.795 | VPS36 | 2.0 | 2.5 | 0.6 | 0.6 | 0.3 | 0.3 | |
| Oxidation-reduction process | orf19.1117 | 5.7 | 2.3 | 0.7 | 1.1 | 0.1 | 0.5 | |
| orf19.1473 | 35.0 | 15.0 | 3.8 | 4.8 | 0.1 | 0.3 | ||
| orf19.2108 | SOD6 | 7.9 | 10.6 | 1.6 | 1.1 | 0.2 | 0.1 | |
| orf19.3538 | FRE9 | 4.7 | 14.9 | 2.5 | 3.6 | 0.5 | 0.2 | |
| orf19.3707 | YHB1 | 3.0 | 2.8 | 0.9 | 0.6 | 0.3 | 0.2 | |
| orf19.4747 | HEM14 | 1.7 | 2.0 | 0.6 | 0.4 | 0.3 | 0.2 | |
| orf19.4871 | ERO1 | 1.9 | 1.9 | 0.9 | 0.6 | 0.5 | 0.3 | |
| orf19.5879 | 3.3 | 2.9 | 1.5 | 1.2 | 0.5 | 0.4 | ||
| orf19.638 | FDH1 | 22.7 | 19.5 | 4.4 | 3.9 | 0.4 | 0.2 | |
| orf19.6837 | FMA1 | 1.5 | 1.5 | 0.7 | 0.7 | 0.5 | 0.4 | |
| orf19.7111.1 | SOD3 | 40.5 | 69.2 | 9.4 | 15.0 | 0.2 | 0.2 | |
| orf19.7314 | CDG1 | 7.5 | 6.0 | 1.0 | 0.6 | 0.1 | 0.1 | |
| orf19.742 | ALD6 | 11.5 | 10.4 | 4.1 | 1.7 | 0.4 | 0.2 | |
| orf19.7551 | ALO1 | 1.5 | 2.8 | 0.7 | 0.6 | 0.5 | 0.2 | |
Descriptions are from the Candida Genome Database (http://www.candidagenome.org/).
Validation of microarray data by real-time RT-PCR.
In order to validate the differential expression of genes identified by microarray, we examined the mRNA abundances of five genes of interest using the same RNA isolated for the microarray experiments. PGA13 was chosen because it is involved in cell wall organization and was also identified previously by Bruno et al. to be Cas5 dependent (34). In addition, four other genes were chosen based on their involvement in cell wall organization (PGA31), iron ion transport (CFL4 and FTR1), and the lipid metabolic process (ERG26). The microarray data and the real-time RT-PCR results were consistent (Fig. 5). The expressions of the CFL4, ERG26, FTR1, PGA13, and PGA31 genes were upregulated in wild-type strain SC5314 when treated with fluconazole but could not respond to the same extent when CAS5 was disrupted.
FIG 5.
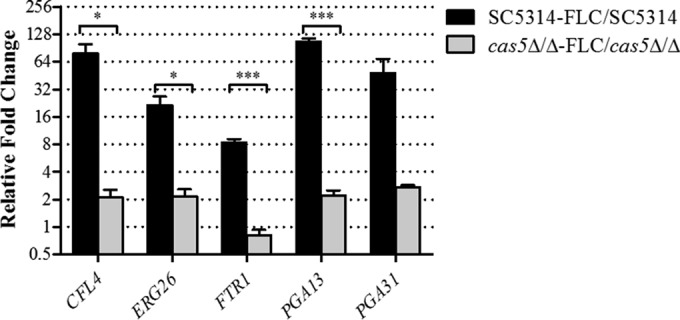
Validation of fluconazole-inducible and Cas5-dependent gene expression. Expression levels of CFL4, ERG26, FTR1, PGA13, and PGA31 were measured in triplicate by qRT-PCR and compared to the expression levels in SC5314. Shown are the relative n-fold changes in gene expression in SC5314 and cas5Δ/Δ mutants treated with fluconazole (FLC). Error bars represent the standard errors of the means. Asterisks represent significance levels (*, P < 0.05; ***, P < 0.001).
DISCUSSION
Identifying transcriptional networks that are central to azole antifungal killing activity would be instructive for developing cotherapeutic strategies that could enhance their activity against C. albicans. Several signal transduction and transcriptional activation programs have been identified to respond to antifungal stress, but the transcription factors and their respective target genes have yet to be identified for many of these processes (6–13). In the present study, we screened a library of C. albicans mutants disrupted for genes encoding TFs in order to identify those genes which resulted in increased killing activity of fluconazole. We observed that disruption of CAS5 resulted in slightly reduced MICs but also resulted in substantial reductions in fluconazole MFCs at 24, 48, and 72 h. Indeed, disruption of CAS5 in an azole-susceptible strain prevented its regrowth in YPD medium in the presence of higher fluconazole concentrations after 72 h, resulted in a clear zone of inhibition around a fluconazole Etest strip, and prevented growth on solid medium containing a therapeutically relevant concentration of fluconazole (10 μg/ml). Time-kill analysis also demonstrated an enhanced killing effect of 10 μg/ml fluconazole against the cas5Δ/Δ mutant compared to its parent strain. The disruption of RPN4 did not display as strong of an effect, suggesting that RPN4 influences fungistatic azole activity to a lesser extent, while CZF1 disruption had no impact on the killing activity of fluconazole. As previously observed for disruption of UPC2, CAS5 disruption enhanced the killing activity of fluconazole (20).
Upon disruption of CAS5 in fluconazole-resistant clinical isolates 12-99, G5, Gu5, and S2, which carry combinations of the four most common mechanisms of resistance, there was no marked change in fluconazole killing activity, although there was a slight change in susceptibility in the G5 background. The disruption of CAS5 in isogenic strains containing specific resistance mutations in ERG11, MRR1, or TAC1 resulted in slightly increased killing activity. However, the strain containing the UPC2G648D GOF mutation rendered irregular cell shape and size. This phenotype was also present when CAS5 was disrupted in strains constructed to contain a UPC2G648S or UPC2A643V allele (data not shown). This may suggest a relationship between the two TFs. When UPC2 is constitutively active, ergosterol biosynthesis genes are upregulated, and cellular ergosterol content increases (29), consequently impacting membrane fluidity, which affects cell wall composition (47). CAS5 is the putative transcriptional regulator of the cell wall integrity pathway (34), and upon its disruption in the presence of a UPC2 GOF mutation, it is possible that the cell cannot effectively regulate the morphology of its cell wall and membrane. Also, the similarity of Cas5p- and Upc2p-dependent genes (discussed below) suggests cross talk between the two transcription factors. Studies to examine such a relationship may uncover other currently unknown roles for each TF.
The strain containing the ERG11K143R mutation had MICs in YPD medium of 4 μg/ml at 24 h and 8 μg/ml at 48 and 72 h. Although this background was not as highly resistant as others, its respective CAS5 deletion mutant had 2-fold decreases in both the fluconazole MIC and MFC at 48 and 72 h. The MRR1P683S and TAC1G980E mutant fluconazole-resistant strains both had MICs in YPD medium of 8 μg/ml at 24 h, 16 μg/ml at 48 h, and >64 μg/ml at 72 h and MFCs of >64 μg/ml at all time points. These values decreased moderately in the respective cas5Δ/Δ mutants. A halo of reduced confluent growth was observed around the Etest strip for the constructed MRR1P683S and TAC1G980E mutants but not in the ERG11K143R background. Fitness defects have been shown to be associated with the introduction of resistance mutations and may explain the growth of the ERG11K143R mutant when examined by Etest (48). Despite the absence of reduced confluent growth, the cas5Δ/Δ mutants in each background showed increased susceptibility to fluconazole by Etest and a decreased ability to grow in the presence of fluconazole at 10 μg/ml. Although the loss of CAS5 in strains containing a single mechanism of resistance resulted in slightly enhanced susceptibility to fluconazole, this modest effect is not practical for clinical applications in overcoming resistance. The differences in susceptibilities observed for the mutants constructed in the azole-resistant clinical isolates versus the isogenic strains may be due to the possibility that clinical isolates have compensatory mutations mitigating any decrease in fitness resulting from such resistance mutations (48).
We then sought to determine if CAS5 might influence fluconazole susceptibility through altered expression of the efflux pump genes CDR1, CDR2, and MDR1. The expression of CDR1 was unchanged in the absence of CAS5, in all mutant backgrounds. However, CDR2 expression was upregulated in three of the five backgrounds, and MDR1 expression was upregulated in two of the five backgrounds. Therefore, the moderate effect on susceptibility observed upon disruption of CAS5 did not appear to be due to altered expression of the efflux pumps.
Another hypothesis for the enhanced killing activity of fluconazole against the cas5Δ/Δ mutants is changes in cell wall structure. Previous reports have shown that when the cell wall integrity pathway is disrupted, specifically by disrupting the protein kinase gene MKC1, the cell exhibits increased susceptibility to fluconazole and caspofungin (12, 13). The upstream kinase Pkc1p phosphorylates Mkc1p in response to fluconazole. Cas5p has been postulated to be the functional equivalent of the Saccharomyces cerevisiae cell wall integrity downstream transcriptional regulator ScRlm1p (34). As previous reports have suggested that cell wall integrity is critical for the fungistatic effect of sterol biosynthesis inhibitors (49), this implies that when CAS5 is disrupted, the integrity of the cell wall is compromised, which results in enhanced fluconazole killing activity. Indeed, expression levels of cell wall integrity genes measured by microarray analysis were reduced in the cas5Δ/Δ mutant compared to its parent strain, SC5314, upon exposure to fluconazole. The PGA13, PGA31, RCA1, VPS7, VPS28, orf19.5644, and orf19.719 genes are all proposed to be involved in cell wall integrity. Interestingly, the gene ontology process categories of iron ion transport and iron ion homeostasis were also found to be dependent upon CAS5. This is consistent with the involvement of some cell wall proteins in iron acquisition (50).
Previous studies by our group also identified a similar set of iron ion transport and iron ion homeostasis genes to be dependent upon UPC2 (20), suggesting cross talk between the two transcription factors. Indeed, upon disruption of CAS5, the baseline expression level of ERG11 was reduced in isolate SC5314, as measured by real-time RT-PCR. Additionally, several genes involved in the lipid metabolic process were also identified to be Cas5 dependent, including ERG26 of the ergosterol biosynthesis pathway, a process that is regulated by Upc2 (33, 45). ERG26 encodes C-4 sterol decarboxylase and has been found to be an essential gene in C. albicans (51). Therefore, inhibition of this step may represent a potential drug target and warrants further investigation.
These data suggest that the enhanced killing activity of fluconazole observed in both susceptible and resistant strains lacking CAS5 may be due to deregulation of iron ion transport and ERG26 expression, in addition to the inability to upregulate genes involved in the cell wall integrity pathway. Delineation of which downstream targets influence azole killing activity would identify potential targets for cotherapeutic strategies rendering enhanced killing activity to the azoles and, as a result, may mitigate the development of resistance. Moreover, the known hypersusceptibility to caspofungin of C. albicans strains lacking CAS5 suggests that inhibitors of this pathway may be valuable as cotherapeutic agents administered in tandem with the echinocandins as well (34).
Supplementary Material
ACKNOWLEDGMENTS
This research was supported in part by a grant from the Children's Foundation Research Center at Le Bonheur Children's Hospital, Memphis, TN (E.M.V.), and National Institutes of Health grant R01AI058145 (P.D.R.).
We are grateful to Joachim Morschhäuser, Spencer Redding, and Ted White for mutant strains and clinical isolates. We thank Qing Zhang for her invaluable assistance in the laboratory.
We have no financial or commercial conflicts of interest to declare.
Footnotes
Published ahead of print 2 September 2014
Supplemental material for this article may be found at http://dx.doi.org/10.1128/AAC.00064-14.
REFERENCES
- 1.Marie C, White TC. 2009. Genetic basis of antifungal drug resistance. Curr. Fungal Infect. Rep. 3:163–169. 10.1007/s12281-009-0021-y. [DOI] [PMC free article] [PubMed] [Google Scholar]
- 2.Lewis RE, Rogers PD. 2010. Invasive fungal infections, p 1375–1393 In Chisholm-Burns MA, Schwinghammer TL, Wells BG, Malone PM, Kolesar JM, DiPiro JT. (ed), Pharmacotherapy principles & practice, 2nd ed. McGraw-Hill Medical, New York, NY. [Google Scholar]
- 3.Gudlaugsson O, Gillespie S, Lee K, Vande Berg J, Hu J, Messer S, Herwaldt L, Pfaller M, Diekema D. 2003. Attributable mortality of nosocomial candidemia, revisited. Clin. Infect. Dis. 37:1172–1177. 10.1086/378745. [DOI] [PubMed] [Google Scholar]
- 4.Jarvis WR. 1995. Epidemiology of nosocomial fungal infections, with emphasis on Candida species. Clin. Infect. Dis. 20:1526–1530. 10.1093/clinids/20.6.1526. [DOI] [PubMed] [Google Scholar]
- 5.Pfaller MA, Sheehan DJ, Rex JH. 2004. Determination of fungicidal activities against yeasts and molds: lessons learned from bactericidal testing and the need for standardization. Clin. Microbiol. Rev. 17:268–280. 10.1128/CMR.17.2.268-280.2004. [DOI] [PMC free article] [PubMed] [Google Scholar]
- 6.Liu TT, Lee RE, Barker KS, Lee RE, Wei L, Homayouni R, Rogers PD. 2005. Genome-wide expression profiling of the response to azole, polyene, echinocandin, and pyrimidine antifungal agents in Candida albicans. Antimicrob. Agents Chemother. 49:2226–2236. 10.1128/AAC.49.6.2226-2236.2005. [DOI] [PMC free article] [PubMed] [Google Scholar]
- 7.Jain P, Akula I, Edlind T. 2003. Cyclic AMP signaling pathway modulates susceptibility of Candida species and Saccharomyces cerevisiae to antifungal azoles and other sterol biosynthesis inhibitors. Antimicrob. Agents Chemother. 47:3195–3201. 10.1128/AAC.47.10.3195-3201.2003. [DOI] [PMC free article] [PubMed] [Google Scholar]
- 8.Onyewu C, Wormley FL, Jr, Perfect JR, Heitman J. 2004. The calcineurin target, Crz1, functions in azole tolerance but is not required for virulence of Candida albicans. Infect. Immun. 72:7330–7333. 10.1128/IAI.72.12.7330-7333.2004. [DOI] [PMC free article] [PubMed] [Google Scholar]
- 9.Sanglard D, Ischer F, Marchetti O, Entenza J, Bille J. 2003. Calcineurin A of Candida albicans: involvement in antifungal tolerance, cell morphogenesis and virulence. Mol. Microbiol. 48:959–976. 10.1046/j.1365-2958.2003.03495.x. [DOI] [PubMed] [Google Scholar]
- 10.Cruz MC, Goldstein AL, Blankenship JR, Del Poeta M, Davis D, Cardenas ME, Perfect JR, McCusker JH, Heitman J. 2002. Calcineurin is essential for survival during membrane stress in Candida albicans. EMBO J. 21:546–559. 10.1093/emboj/21.4.546. [DOI] [PMC free article] [PubMed] [Google Scholar]
- 11.Chauhan N, Kruppa M, Calderone R. 2007. The Ssk1p response regulator and Chk1p histidine kinase mutants of Candida albicans are hypersensitive to fluconazole and voriconazole. Antimicrob. Agents Chemother. 51:3747–3751. 10.1128/AAC.00929-07. [DOI] [PMC free article] [PubMed] [Google Scholar]
- 12.Agarwal AK, Rogers PD, Baerson SR, Jacob MR, Barker KS, Cleary JD, Walker LA, Nagle DG, Clark AM. 2003. Genome-wide expression profiling of the response to polyene, pyrimidine, azole, and echinocandin antifungal agents in Saccharomyces cerevisiae. J. Biol. Chem. 278:34998–35015. 10.1074/jbc.M306291200. [DOI] [PubMed] [Google Scholar]
- 13.Reinoso-Martin C, Schuller C, Schuetzer-Muehlbauer M, Kuchler K. 2003. The yeast protein kinase C cell integrity pathway mediates tolerance to the antifungal drug caspofungin through activation of Slt2p mitogen-activated protein kinase signaling. Eukaryot. Cell 2:1200–1210. 10.1128/EC.2.6.1200-1210.2003. [DOI] [PMC free article] [PubMed] [Google Scholar]
- 14.Homann OR, Dea J, Noble SM, Johnson AD. 2009. A phenotypic profile of the Candida albicans regulatory network. PLoS Genet. 5:e1000783. 10.1371/journal.pgen.1000783. [DOI] [PMC free article] [PubMed] [Google Scholar]
- 15.Sherman F. 2002. Getting started with yeast. Methods Enzymol. 350:3–41. 10.1016/S0076-6879(02)50954-X. [DOI] [PubMed] [Google Scholar]
- 16.Green SR, Moehle CM. 2001. Media and culture of yeast. Curr. Protoc. Cell Biol. Chapter 1:Unit 1.6. 10.1002/0471143030.cb0106s04. [DOI] [PubMed] [Google Scholar]
- 17.Burke D, Dawson D, Stearns T. 2000. Methods in yeast genetics: a Cold Spring Harbor Laboratory course manual. Cold Spring Harbor Laboratory Press, Cold Spring Harbor, NY. [Google Scholar]
- 18.CLSI. 2008. Reference method for broth microdilution antifungal susceptibility testing of yeasts; approved standard, 3rd ed. CLSI document M27-A3. Clinical and Laboratory Standards Institute, Wayne, PA. [Google Scholar]
- 19.CLSI. 2012. Reference method for broth microdilution antifungal susceptibility testing of yeasts; fourth informational supplement. CLSI document M27-S4. Clinical and Laboratory Standards Institute, Wayne, PA. [Google Scholar]
- 20.Vasicek EM, Berkow EL, Flowers SA, Barker KS, Rogers PD. 2014. UPC2 is universally essential for azole antifungal resistance in Candida albicans. Eukaryot. Cell 13:933–946. 10.1128/EC.00221-13. [DOI] [PMC free article] [PubMed] [Google Scholar]
- 21.Hill JA, Ammar R, Torti D, Nislow C, Cowen LE. 2013. Genetic and genomic architecture of the evolution of resistance to antifungal drug combinations. PLoS Genet. 9:e1003390. 10.1371/journal.pgen.1003390. [DOI] [PMC free article] [PubMed] [Google Scholar]
- 22.Epp E, Vanier G, Harcus D, Lee AY, Jansen G, Hallett M, Sheppard DC, Thomas DY, Munro CA, Mullick A, Whiteway M. 2010. Reverse genetics in Candida albicans predicts ARF cycling is essential for drug resistance and virulence. PLoS Pathog. 6:e1000753. 10.1371/journal.ppat.1000753. [DOI] [PMC free article] [PubMed] [Google Scholar]
- 23.Onyewu C, Blankenship JR, Del Poeta M, Heitman J. 2003. Ergosterol biosynthesis inhibitors become fungicidal when combined with calcineurin inhibitors against Candida albicans, Candida glabrata, and Candida krusei. Antimicrob. Agents Chemother. 47:956–964. 10.1128/AAC.47.3.956-964.2003. [DOI] [PMC free article] [PubMed] [Google Scholar]
- 24.Espinel-Ingroff A. 1998. Comparison of in vitro activities of the new triazole SCH56592 and the echinocandins MK-0991 (L-743,872) and LY303366 against opportunistic filamentous and dimorphic fungi and yeasts. J. Clin. Microbiol. 36:2950–2956. [DOI] [PMC free article] [PubMed] [Google Scholar]
- 25.Klepser ME, Wolfe EJ, Jones RN, Nightingale CH, Pfaller MA. 1997. Antifungal pharmacodynamic characteristics of fluconazole and amphotericin B tested against Candida albicans. Antimicrob. Agents Chemother. 41:1392–1395. [DOI] [PMC free article] [PubMed] [Google Scholar]
- 26.Reuss O, Vik A, Kolter R, Morschhauser J. 2004. The SAT1 flipper, an optimized tool for gene disruption in Candida albicans. Gene 341:119–127. 10.1016/j.gene.2004.06.021. [DOI] [PubMed] [Google Scholar]
- 27.Amberg DC, Burke DJ, Strathern JN. 2006. Isolation of yeast genomic DNA for Southern blot analysis. CSH Protoc. 2006:pdb.prot4149. 10.1101/pdb.prot4149. [DOI] [PubMed] [Google Scholar]
- 28.Schmitt ME, Brown TA, Trumpower BL. 1990. A rapid and simple method for preparation of RNA from Saccharomyces cerevisiae. Nucleic Acids Res. 18:3091–3092. 10.1093/nar/18.10.3091. [DOI] [PMC free article] [PubMed] [Google Scholar]
- 29.Flowers SA, Barker KS, Berkow EL, Toner G, Chadwick SG, Gygax SE, Morschhauser J, Rogers PD. 2012. Gain-of-function mutations in UPC2 are a frequent cause of ERG11 upregulation in azole-resistant clinical isolates of Candida albicans. Eukaryot. Cell 11:1289–1299. 10.1128/EC.00215-12. [DOI] [PMC free article] [PubMed] [Google Scholar]
- 30.Dunkel N, Liu TT, Barker KS, Homayouni R, Morschhauser J, Rogers PD. 2008. A gain-of-function mutation in the transcription factor Upc2p causes upregulation of ergosterol biosynthesis genes and increased fluconazole resistance in a clinical Candida albicans isolate. Eukaryot. Cell 7:1180–1190. 10.1128/EC.00103-08. [DOI] [PMC free article] [PubMed] [Google Scholar]
- 31.Znaidi S, Weber S, Al-Abdin OZ, Bomme P, Saidane S, Drouin S, Lemieux S, De Deken X, Robert F, Raymond M. 2008. Genomewide location analysis of Candida albicans Upc2p, a regulator of sterol metabolism and azole drug resistance. Eukaryot. Cell 7:836–847. 10.1128/EC.00070-08. [DOI] [PMC free article] [PubMed] [Google Scholar]
- 32.Silver PM, Oliver BG, White TC. 2004. Role of Candida albicans transcription factor Upc2p in drug resistance and sterol metabolism. Eukaryot. Cell 3:1391–1397. 10.1128/EC.3.6.1391-1397.2004. [DOI] [PMC free article] [PubMed] [Google Scholar]
- 33.MacPherson S, Akache B, Weber S, De Deken X, Raymond M, Turcotte B. 2005. Candida albicans zinc cluster protein Upc2p confers resistance to antifungal drugs and is an activator of ergosterol biosynthetic genes. Antimicrob. Agents Chemother. 49:1745–1752. 10.1128/AAC.49.5.1745-1752.2005. [DOI] [PMC free article] [PubMed] [Google Scholar]
- 34.Bruno VM, Kalachikov S, Subaran R, Nobile CJ, Kyratsous C, Mitchell AP. 2006. Control of the C. albicans cell wall damage response by transcriptional regulator Cas5. PLoS Pathog. 2:e21. 10.1371/journal.ppat.0020021. [DOI] [PMC free article] [PubMed] [Google Scholar]
- 35.White TC, Holleman S, Dy F, Mirels LF, Stevens DA. 2002. Resistance mechanisms in clinical isolates of Candida albicans. Antimicrob. Agents Chemother. 46:1704–1713. 10.1128/AAC.46.6.1704-1713.2002. [DOI] [PMC free article] [PubMed] [Google Scholar]
- 36.White TC. 1997. Increased mRNA levels of ERG16, CDR, and MDR1 correlate with increases in azole resistance in Candida albicans isolates from a patient infected with human immunodeficiency virus. Antimicrob. Agents Chemother. 41:1482–1487. [DOI] [PMC free article] [PubMed] [Google Scholar]
- 37.Lopez-Ribot JL, McAtee RK, Lee LN, Kirkpatrick WR, White TC, Sanglard D, Patterson TF. 1998. Distinct patterns of gene expression associated with development of fluconazole resistance in serial Candida albicans isolates from human immunodeficiency virus-infected patients with oropharyngeal candidiasis. Antimicrob. Agents Chemother. 42:2932–2937. [DOI] [PMC free article] [PubMed] [Google Scholar]
- 38.Perea S, Lopez-Ribot JL, Kirkpatrick WR, McAtee RK, Santillan RA, Martinez M, Calabrese D, Sanglard D, Patterson TF. 2001. Prevalence of molecular mechanisms of resistance to azole antifungal agents in Candida albicans strains displaying high-level fluconazole resistance isolated from human immunodeficiency virus-infected patients. Antimicrob. Agents Chemother. 45:2676–2684. 10.1128/AAC.45.10.2676-2684.2001. [DOI] [PMC free article] [PubMed] [Google Scholar]
- 39.Sanglard D, Ischer F, Parkinson T, Falconer D, Bille J. 2003. Candida albicans mutations in the ergosterol biosynthetic pathway and resistance to several antifungal agents. Antimicrob. Agents Chemother. 47:2404–2412. 10.1128/AAC.47.8.2404-2412.2003. [DOI] [PMC free article] [PubMed] [Google Scholar]
- 40.Morschhauser J, Barker KS, Liu TT, Blaß-Warmuth J, Homayouni R, Rogers PD. 2007. The transcription factor Mrr1p controls expression of the MDR1 efflux pump and mediates multidrug resistance in Candida albicans. PLoS Pathog. 3:e164. 10.1371/journal.ppat.0030164. [DOI] [PMC free article] [PubMed] [Google Scholar]
- 41.Franz R, Kelly SL, Lamb DC, Kelly DE, Ruhnke M, Morschhauser J. 1998. Multiple molecular mechanisms contribute to a stepwise development of fluconazole resistance in clinical Candida albicans strains. Antimicrob. Agents Chemother. 42:3065–3072. [DOI] [PMC free article] [PubMed] [Google Scholar]
- 42.Franz R, Ruhnke M, Morschhauser J. 1999. Molecular aspects of fluconazole resistance development in Candida albicans. Mycoses 42:453–458. 10.1046/j.1439-0507.1999.00498.x. [DOI] [PubMed] [Google Scholar]
- 43.Coste AT, Karababa M, Ischer F, Bille J, Sanglard D. 2004. TAC1, transcriptional activator of CDR genes, is a new transcription factor involved in the regulation of Candida albicans ABC transporters CDR1 and CDR2. Eukaryot. Cell 3:1639–1652. 10.1128/EC.3.6.1639-1652.2004. [DOI] [PMC free article] [PubMed] [Google Scholar]
- 44.Sasse C, Schillig R, Dierolf F, Weyler M, Schneider S, Mogavero S, Rogers PD, Morschhauser J. 2011. The transcription factor Ndt80 does not contribute to Mrr1-, Tac1-, and Upc2-mediated fluconazole resistance in Candida albicans. PLoS One 6:e25623. 10.1371/journal.pone.0025623. [DOI] [PMC free article] [PubMed] [Google Scholar]
- 45.Schubert S, Popp C, Rogers PD, Morschhauser J. 2011. Functional dissection of a Candida albicans zinc cluster transcription factor, the multidrug resistance regulator Mrr1. Eukaryot. Cell 10:1110–1121. 10.1128/EC.05100-11. [DOI] [PMC free article] [PubMed] [Google Scholar]
- 46.Marichal P, Koymans L, Willemsens S, Bellens D, Verhasselt P, Luyten W, Borgers M, Ramaekers FC, Odds FC, Bossche HV. 1999. Contribution of mutations in the cytochrome P450 14alpha-demethylase (Erg11p, Cyp51p) to azole resistance in Candida albicans. Microbiology 145(Part 10):2701–2713. [DOI] [PubMed] [Google Scholar]
- 47.Heilmann CJ, Sorgo AG, Mohammadi S, Sosinska GJ, de Koster CG, Brul S, de Koning LJ, Klis FM. 2013. Surface stress induces a conserved cell wall stress response in the pathogenic fungus Candida albicans. Eukaryot. Cell 12:254–264. 10.1128/EC.00278-12. [DOI] [PMC free article] [PubMed] [Google Scholar]
- 48.Sasse C, Dunkel N, Schafer T, Schneider S, Dierolf F, Ohlsen K, Morschhauser J. 2012. The stepwise acquisition of fluconazole resistance mutations causes a gradual loss of fitness in Candida albicans. Mol. Microbiol. 86:539–556. 10.1111/j.1365-2958.2012.08210.x. [DOI] [PubMed] [Google Scholar]
- 49.Edlind TD. 2001. The protein kinase C (PKC) signaling pathway contributes to antifungal tolerance in Candida albicans and Saccharomyces cerevisiae, abstr J-1844 Abstr. 41st Intersci. Conf. Antimicrob. Agents Chemother. American Society for Microbiology, Washington, DC. [Google Scholar]
- 50.Klis FM, Sosinska GJ, de Groot PW, Brul S. 2009. Covalently linked cell wall proteins of Candida albicans and their role in fitness and virulence. FEMS Yeast Res. 9:1013–1028. 10.1111/j.1567-1364.2009.00541.x. [DOI] [PubMed] [Google Scholar]
- 51.Aaron KE, Pierson CA, Lees ND, Bard M. 2001. The Candida albicans ERG26 gene encoding the C-3 sterol dehydrogenase (C-4 decarboxylase) is essential for growth. FEMS Yeast Res. 1:93–101. 10.1111/j.1567-1364.2001.tb00020.x. [DOI] [PubMed] [Google Scholar]
Associated Data
This section collects any data citations, data availability statements, or supplementary materials included in this article.