

Abstract
Colistin is an old antibiotic that has recently gained a considerable renewal of interest for the treatment of pulmonary infections due to multidrug-resistant Gram-negative bacteria. Nebulization seems to be a promising form of administration, but colistin is administered as an inactive prodrug, colistin methanesulfonate (CMS); however, differences between the intrapulmonary concentrations of the active moiety as a function of the route of administration in critically ill patients have not been precisely documented. In this study, CMS and colistin concentrations were measured on two separate occasions within the plasma and epithelial lining fluid (ELF) of critically ill patients (n = 12) who had received 2 million international units (MIU) of CMS by aerosol delivery and then intravenous administration. The pharmacokinetic analysis was conducted using a population approach and completed by pharmacokinetic-pharmacodynamic (PK-PD) modeling and simulations. The ELF colistin concentrations varied considerably (9.53 to 1,137 mg/liter), but they were much higher than those in plasma (0.15 to 0.73 mg/liter) after aerosol delivery but not after intravenous administration of CMS. Following CMS aerosol delivery, typically, 9% of the CMS dose reached the ELF, and only 1.4% was presystemically converted into colistin. PK-PD analysis concluded that there was much higher antimicrobial efficacy after CMS aerosol delivery than after intravenous administration. These new data seem to support the use of aerosol delivery of CMS for the treatment of pulmonary infections in critical care patients.
INTRODUCTION
Aerosol delivery of antibiotics for the treatment of pulmonary infections has recently gained considerable attention, and approval has been obtained for this administration route worldwide for several compounds, including tobramycin (1, 2), aztreonam (3), and colistin (4, 5). Dry-powder formulas have been optimized, and at the same time, a new generation of pocket nebulizers was developed to favor aerosol delivery of antibiotics in ambulatory patients, such as a cystic fibrosis patient, in order to improve their quality of life. However, aerosol delivery of antibiotics for the treatment of nosocomial pulmonary infections is also quite popular. And yet, there is no general consensus regarding the administration method, and in practice, it is quite difficult to provide clinical evidence demonstrating the superiority of the aerosol delivery of antibiotics over that of other routes of administration in critically ill patients. Therefore, a comparison of antibiotic concentrations at the site of infection after intravenous administration and aerosol delivery, followed by predictions of the resulting antimicrobial activity using modern pharmacokinetic-pharmacodynamic (PK-PD) modeling approaches, may provide valuable information. Numerous physicochemical parameters, including particle size, aerodynamic diameter, density, and charge, which are in part determined by the type of aerosol generator, determine how much of the drug may reach the alveolar space after aerosol delivery. However, patient physiopathology, such as impaired expiratory airflow or atelectasis, may also have a major impact on antibiotic distribution within the lung after aerosol delivery. Overall, only a limited fraction of the inhaled dose is likely to reach the target, and antibiotic characteristics, such as solubility, permeability, and affinity for efflux transport system present at the blood alveolar barrier, will also determine the intrapulmonary concentration-versus-time profile. Eventually, PK-PD characteristics that vary by antibiotic must also be considered for the optimization of aerosol treatment. Even with this relative complexity, promising results have been obtained with colistin after nebulization in rats by several groups, including Marchand et al. (6) and Yapa et al. (7), and the objective of this study was to describe the pharmacokinetics of colistin after CMS aerosol delivery for treating pulmonary infections in critically ill patients.
MATERIALS AND METHODS
Study population.
The study was performed in 12 adult patients hospitalized in the intensive care unit (ICU) of the University Hospital of Poitiers, France, who developed ventilator-associated pneumonia during their stay between October 2011 and August 2012. Patients were eligible if they were between 18 and 85 years of age, were intubated, and had a pneumonia caused by Gram-negative bacteria sensitive to colistin. Patients were not eligible if they had received colistin within 7 days prior to the study, had creatinine clearance of <30 ml/min, or had a personal or family history of myasthenia. At the study onset, the following data were collected: age, sex, weight, diagnosis on admission, serum urea, serum creatinine, simplified acute physiology score (SAPS II), and sequential organ failure assessment (SOFA) score. Creatinine clearance was calculated according to the Cockroft-Gault formula (8). The study protocol was approved by the local ethics committee (CPP Ouest III, approval no. 2009009578-28). In all patients, informed consent was obtained from their nearest relatives prior to the initiation of the study. A total of 6 women and 6 men were enrolled. Their demographic, clinical, and biological data are shown in Table 1.
TABLE 1.
Patient demographic and clinical characteristics
| Patient | Age (yr) | Gendera | Wt (kg) | Diagnosis at admission | SOFA scoreb | SAPS II scoreb | Creatinine clearance (ml/min)c |
|---|---|---|---|---|---|---|---|
| 1 | 44 | F | 53 | Respiratory decompensation | 2 | 19 | 156 |
| 2 | 66 | F | 88 | Tracheoesophageal fistula | 3 | 47 | 125 |
| 3 | 18 | M | 59 | Craniocerebral trauma | 10 | 40 | 170 |
| 4 | 59 | M | 65 | Cardiopulmonary arrest | 4 | 33 | 120 |
| 5 | 72 | F | 65 | Pneumonia | 9 | 43 | 85 |
| 6 | 68 | F | 77 | Peritonitis | 11 | 42 | 66 |
| 7 | 64 | M | 115 | Peritonitis | 1 | 38 | 104 |
| 8 | 36 | M | 90 | Multiple trauma | 2 | 17 | 250 |
| 9 | 43 | F | 70 | Multiple trauma | 11 | 47 | 133 |
| 10 | 74 | M | 88 | Cardiopulmonary arrest | 9 | 67 | 88 |
| 11 | 74 | F | 86 | Tracheoesophageal fistula | 3 | 36 | 111 |
| 12 | 33 | M | 92 | Thoracic injury | 3 | 22 | 205 |
| Overall (mean ± SD) | 54 ± 19 | 79 ± 17 | 6 ± 4 | 38 ± 14 | 134 ± 53 |
F, female; M, male.
At study onset.
According to Cockroft and Gault formula.
CMS administration.
The patients were treated with CMS (Colimycine; Sanofi-Aventis, Paris, France). Treatment was initiated with a 2-million international unit (MIU) dose of CMS, corresponding to 160 mg of CMS sulfate or 60 mg of colistin-based activity (CBA) (9), dissolved in 10 ml of saline and nebulized over 30 min via a vibrating mesh nebulizer (Aeroneb Pro; Aerogen, Galway, France). Thus, 8 h later, the same dose of CMS was dissolved in 50 ml of saline and infused intravenously (i.v.) over 60 min. Intravenous administrations were then repeated every 8 h until the end of treatment or therapeutic deescalation. The CMS solutions were prepared extemporaneously.
Sampling procedures. (i) Blood samples.
Blood samples were collected immediately before and at 0.33, 0.66, 1, 1.5, 2, 2.5, 3, 4, 5, 6, 7, and 8 h after the beginning of aerosol delivery and after starting the first intravenous infusion via a distinct line. Two extra blood samples were collected at steady state at the same time as the bronchoalveolar lavage (BAL) fluid. The blood samples were immediately centrifuged (3,000 × g for 10 min) at 4°C, and the plasma was stored at −80°C until analysis.
(ii) BAL fluid samples.
Mini-bronchoalveolar lavage (mini-BAL) was performed as previously described (10). Mini-BAL was performed with a 16-French (Fr) double sterile catheter (BAL, KimVent; Kimberly-Clark, Roswell, GA) inserted through the endotracheal tube. Two 20-ml aliquots of saline solution were instilled and then immediately aspirated with a syringe; these two BAL fluid samples were pooled and rapidly centrifuged (at 3,000 × g for 10 min), and the supernatants were stored at −80°C until analysis. For patients 1 to 6, mini-BAL was performed at 1 h and 3 h after initiating the aerosol delivery and then at steady state, 2 to 3 days later, and 1 h and 3 h after starting the nth intravenous infusion (7 < n < 12). For patients 7 to 12, mini-BAL was performed at 5 h and 8 h after initiating aerosol delivery and then at steady state, 2 to 3 days later, and 5 h and 8 h after starting the nth intravenous infusion (7 < n < 12). Urine samples were collected in 6 patients over 8 h at various times.
Colistin and CMS assay in plasma, urine, and BAL fluid.
The samples were rapidly centrifuged, as previously described. Plasma was separated and kept frozen before analysis, as previously described (11–13). A previously described liquid chromatography-tandem mass spectrometry (LC-MS/MS) assay was used for CMS and colistin concentration measurements in plasma and urine (12) and BAL fluid (6) samples. The limit of quantification of the assay was 0.04 μg/ml.
Urea analysis in plasma and BAL fluid.
The urea concentrations were determined in BAL fluid by LC-MS/MS, and the analysis was adapted from a previously described method (14). Eight-point calibration standards were made in 0.9% NaCl between 100 and 1.25 μg · ml−1. The limit of quantification (LOQ) for urea determination in BAL fluid was estimated at 1.25 μg · ml−1. The intra- and interday variabilities were characterized at these four concentrations, with precision and accuracy of <15% for 75, 25, and 2.5 μg · ml−1 concentrations and <20% for the LOQ. The urea concentrations in plasma were measured by photometric detection using an automatic analyzer (Modular automatic analyzer; Roche, France).
Determination of CMS and colistin concentrations in epithelial lining fluid.
The actual ELF concentrations of CMS or colistin (CELF) were obtained from measured BAL fluid concentrations after correction for dilution (6), according to the equation CELF = CBAL (Ureaplasma/UreaBAL), where CBAL corresponds to the CMS or colistin concentration measured in BAL fluid, and UreaBAL and Ureaplasma correspond to the concentrations of urea determined in BAL fluid and plasma, respectively.
Population PK modeling.
The pharmacokinetic (PK) analysis was performed using the CMS and colistin ELF, urine, and plasma total concentrations (Fig. 1). Differences in the molecular masses between CMS (1,632 g/mol) and colistin (1,167 g/mol) were considered for calculation of the biotransformation rate, and it was assumed that only CMS was excreted in urine (11, 15). All data were analyzed simultaneously using a nonlinear mixed-effects model, with S-ADAPT (version 1.52), using the Monte Carlo parametric expectation maximization (MC-PEM) estimation algorithm with the S-ADAPT-TRAN translator (version 1.01) (16). The structural PK model is presented in Fig. 2. The ELF compartments were added to the plasma compartments to characterize CMS and colistin intrapulmonary distributions. The ELF volumes of distribution (VELF) were supposed to be the same for CMS and colistin. The fraction of the CMS dose delivered by aerosol delivery that reached ELF either directly or after being converted into colistin was defined as Faero, and the presystemic clearance for CMS conversion into colistin was referred to as CLps_CMS. The first-order intercompartmental transfer clearances between ELF and plasma compartments were considered for CMS (clearance of CMS from lung to plasma and plasma to lung [CLIN_CMS and CLOUT_CMS], respectively) and colistin (clearance of colistin from lung to plasma and plasma to lung [CLIN_COL and CLOUT_COL], respectively). The typical PK parameters of the population were estimated, as well as the interindividual variability (IIV) (assuming a log-normal distribution), the interoccasion variability (IOV), and the residual variability. The residual variability was modeled as proportional for both CMS and colistin in ELF and plasma and combined (additive plus proportional) for the CMS urine concentration (Table 2). The effects of various covariates on the model parameters were not tested in this ancillary study, since this was done in an accompanying study (N. Grégoire, O. Mimoz, B. Mégarbane, E. Comets, D. Chatelier, S. Lasocki, R. Gauzit, D. Balayn, P. Gobin, S. Marchand, W. Couet [17]) with 73 critical care patients, but they were taken into account accordingly. The final model was assessed by an inspection of the observed versus predicted concentrations, residual variability, precision of parameter estimates, visual predictive check (VPC), and normalized prediction distribution errors (NPDE) (data not shown).
FIG 1.

CMS (top panels) and colistin (bottom panels) concentrations in ELF (open squares) and plasma (filled triangles) following a single dose via aerosol or i.v. administration at steady state.
FIG 2.
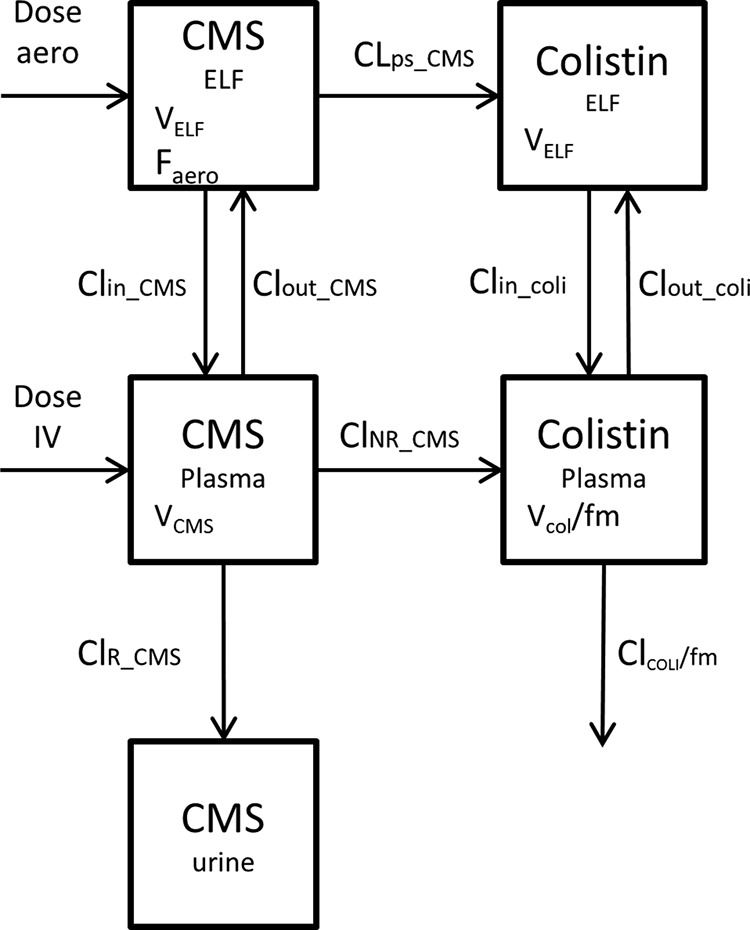
Structural pharmacokinetic model. VELF, volume of distribution in lung compartment; Faero, fraction of the aerosol dose that reaches systemic circulation; CLOUT_CMS, clearance of CMS from central to lung compartments; CLIN_CMS, clearance of CMS from lung to central compartments; CLps_CMS, clearance of CMS presystemic conversion in colistin; CLOUT_COLI, clearance of colistin from central to lung compartments; CLIN_COLI, clearance of colistin from lung to central compartments; VCMS, volume of distribution of CMS; CLR_CMS, renal clearance of CMS; CLNR_CMS, nonrenal clearance of CMS; VCOL, volume of distribution of colistin; CLCOL, total clearance of colistin; fm, fraction of the CMS dose not excreted unchanged that is converted into colistin.
TABLE 2.
Residual error for CMS and colistin
| Residual error | Proportional %CV (RSE%)a | Additive (μg/ml) |
|---|---|---|
| CMS plasma | 34 (20) | |
| Colistin plasma | 30 (9) | |
| CMS ELF | 77 (60) | |
| Colistin ELF | 59 (26) | |
| CMS urine | 59 (83) | 170 (40) |
CV, coefficient of variation; RSE, relative standard error.
Time-kill curve experiments.
An inoculum of 5 × 10⁶ CFU/ml of Pseudomonas aeruginosa strain PAO1 (CIP 104116; Institut Pasteur, Paris, France), a wild-type strain, was prepared by a suspension of the bacteria from an 18-h logarithmic-growth-phase culture in Mueller-Hinton broth (Fluka BioChemika; Sigma-Aldrich, France). The experiments were performed in 10-ml glass tubes. Colistin was added to obtain concentrations of 0.25, 0.5, 1, 2, and 4 μg/ml (corresponding to 0.5 to 8× the MIC). The tubes were incubated at 37°C for 30 h. The bacteria were counted at 0, 2, 6, 8, 24, and 30 h. The number of CFU was counted after incubation at 37°C for 18 to 24 h. The limit of quantification (LOQ) was 100 CFU/ml. Four replicates were performed for each concentration. At least one growth control, without added colistin, was included in each experiment. Four replicates were performed for each concentration.
Pharmacodynamic modeling.
Time-kill curves were analyzed using nonlinear mixed-effects modeling in the S-ADAPT software via the importance sampling algorithm (p method = 4 in S-ADAPT) (18). Modeling was facilitated by the S-ADAPT-TRAN tool and utilized estimation settings that were previously qualified for a robust estimation of mechanism-based models (16, 19). Viable counts were fitted on a log10 scale, and viable counts below the limit of quantification were handled by using the Beal M3 method as implemented in S-ADAPT (20). The PD model was derived from Jumbe et al. (21), Gumbo et al. (22), and Campion et al. (23). This model included a preexisting susceptible (S) and a preexisting resistant (R) population. Both populations did not interconvert and were assumed to have the same maximal killing rate constant (kmax) and the same growth rate constant (kg). These populations differed, however, in their drug concentration yielding 50% of the kmax (KC50), and the KC50 of the resistant population (KC50R) was greater than that of the susceptible population (KC50S).The typical PD parameters of the population were estimated, as well as the interindividual variability (IIV) (assuming a log-normal distribution) and the residual variability. The residual variability was modeled as additive on a log scale. The final model was assessed by an inspection of the observed versus predicted bacterial counts, residual variability, precision of the parameter estimates, and visual predictive check (VPC) (data not shown).
Prediction of bacterial killing.
Predictions of colistin effect versus time were performed with Berkeley Madonna (version 8.3.18; University of California) over a 24-h time period by comparing two dosing regimens: 2 MIU of CMS administered by aerosol delivery over 30 min at time zero, followed by two consecutive 2-MIU doses administered i.v. over 30 min starting at times 8 h and 16 h; and 2-MIU doses of CMS administered i.v. over 60 min starting at times zero, 8 h, and 16 h.
For each dosage regimen, 1,000 Monte Carlo predictions were performed: 1,000 PK and PD parameter values were generated randomly according to their distributions and used to generate 1,000 profiles of colistin concentrations in the ELF (data not shown) and 1,000 profiles of bacterial counts in the ELF. The pharmacodynamics of colistin was considered the same in ELF and in vitro. Each prediction began with a starting inoculum of 106 CFU/ml.
RESULTS
The CMS and colistin concentrations were much higher (approximately 100- to 1,000-fold) in the ELF than those in plasma following the initial CMS aerosol delivery (Fig. 1). The CMS and colistin concentrations were similar in the ELF and plasma after multiple i.v. administrations at steady state (Fig. 1). Overall, the range of colistin concentrations was higher within the ELF (9.53 to 1,137 mg/liter) and lower in plasma (0.15 to 0.73 mg/liter) after aerosol delivery than with intravenous administration of CMS (1.48 to 28.9 mg/liter in ELF and 0.15 to 4.7 in plasma).
PK modeling allowed proper characterization of the effect of route of administration on intrapulmonary CMS and colistin disposition. The interindividual variability (IIV) included for intrapulmonary parameters (CLIN AND OUT for CMS and colistin and CLps_CMS) were large (57 to 128%) (Table 3).The visual predictive check (VPC) showed that the model fitted the data without major bias (Fig. 3). The observed concentrations were evenly scattered around the typical profile, and about 10% of the observed data were outside the 90% predicted confidence intervals. The CMS concentrations in ELF were slightly overpredicted at 1 h, and the colistin concentrations in plasma were slightly underpredicted at 1 h.
TABLE 3.
Estimated population pharmacokinetic parameters of CMS and colistin for the final model based on the data from the 12 patients of the current study
| Drug by sample type | Description | Parameter | Units | Typical value (RSE%) | IIV %CVa (RSE%) | IOV %CVb (RSE%) |
|---|---|---|---|---|---|---|
| Lung | ||||||
| CMS | Fraction of the dose that reaches the ELF | Faero | 0.09 (26) | 91 (43) | ||
| Clearance of CMS from lung to plasma | CLIN_CMS | μl/min | 15.1 (31) | 57 (52) | ||
| Clearance of CMS from plasma to lung | CLOUT_CMS | μl/min | 6.0 (90) | 128 (67) | ||
| Presystemic clearance of CMS to colistin | CLps_CMS | μl/min | 2.6 (37) | 108 (50) | ||
| CMS and colistin | Epithelial lining fluid vol | VELF | ml | 1.2 (0.24) | ||
| Colistin | Clearance of colistin from lung to plasma | CLIN_COL | μl/min | 9.8 (31) | 75 (73) | |
| Clearance of colistin from plasma to lung | CLOUT_COL | μl/min | 12.7 (58) | 107 (81) | ||
| Plasma | ||||||
| CMS | Vol of distribution of CMS | VCMS | Liters | 15.3 (12) | 38 (47) | |
| Renal clearance of CMS | CLR_CMS | ml/min | 64.6 (6.8) | 93 (55) | 61 (40) | |
| Nonrenal clearance of CMS | CLNR_CMS | ml/min | 46.3 (0.06) | |||
| Colistin | Apparent vol of distribution of colistin | VCOL/fm | Liters | 13.7 (15) | 44 (58) | |
| Apparent total clearance of colistin | CLCOL/fm | ml/min | 53.1 (8.4) | 38 (74) | 42 (46) |
IIV %CV, interindividual variability (expressed as a coefficient of variation).
IOV %CV, interoccasion variability (expressed as a coefficient of variation).
FIG 3.

Observed colistin and CMS concentrations in ELF and plasma with model predictions (as medians [solid lines] and 90% prediction intervals [gray shaded areas]) using parameter estimates.
The parameter estimates are presented in Table 3. Following CMS aerosol delivery, 9% of the dose typically reached the ELF, with only 1.4% absorbed as colistin due to presystemic biotransformation. The distributional clearances in and out for CMS and colistin were within the same order of magnitude and 2- to 5-fold higher than those of CMS-to-colistin presystemic conversion.
Kill curve experiments showed an initial decay of CFU with time, followed by regrowth at all concentrations tested (0.25 to 4 μg/ml) (Fig. 4), which was also depicted by the CFU-versus-time curves simulated by the PD model with two subpopulations of bacteria (susceptible and resistant), suggesting also that the faster initial decay at higher colistin concentrations was accompanied by earlier regrowth (Fig. 4), as previously observed (17). Noticeably, the 50% effective concentration (EC50) for the so-called resistant bacteria (EC50R, 25.3 mg/liter) was much (37-fold) greater than that of the susceptible one (EC50S, 0.69 mg/liter). The full parameter estimates are presented in Table 4.
FIG 4.

Time-kill curves for P. aeruginosa exposed to colistin at concentrations (Conc.) ranging from 0 to 4 mg/liter for a starting inoculum of 5 × 10⁶ CFU/ml. The results (dots and error bars) are the means and standard deviations of the results from four replicates. Included are the model predicted curves (lines) with mean parameter estimates.
TABLE 4.
Pharmacodynamic parameter estimates with typical values, interindividual variability, and relative standard error of the PK-PD model, as estimated using data from static experiments
| Parameter | Abbreviation | Units | Typical value (RSE%)a | IIV %CVb (RSE%) |
|---|---|---|---|---|
| Maximum killing rate constant | Emaxc | h−1 | 3.3 (13.22) | 26.7 (54) |
| Apparent growth rate constant | kg | h−1 | 0.76 (5.5) | 18 (57) |
| Antibiotic concn yielding 50% of Emax in susceptible population | EC50S | mg/liter | 0.69 (35) | 44 (62) |
| Antibiotic concn yielding 50% of Emax in resistant population | EC50R | mg/liter | 25.3 (25) | 48 (51) |
| Maximum concn of bacteria reached in in vitro system | Popmax | Log10 CFU/ml | 9.17 (0.93) | 24 (58) |
| Initial inoculum | Inoc | Log10 CFU/ml | 6.38 (0.71) | |
| Mutation frequency | Log10Mutf | −5.5 (4.57) | ||
| Additive residual error | 0.34 (7) | |||
RSE%, relative standard error (expressed as a percentage).
IIV %CV, interindividual variability (expressed as a coefficient of variation).
Emax, maximum possible effect of the drug.
Selected PK and PD models with parameter estimates were used and integrated for PK-PD simulations. Accordingly, it would take approximately 12 h from 95% predictions to achieve a total kill of wild-type P. aeruginosa following an aerosol delivery, whereas the i.v. doses did not achieve this objective. Moreover, the percentage of bacterial counts below the lower LOQ (LLOQ) (100 CFU/ml) at 24 h was much higher after aerosol delivery, at 98.5%, than that after i.v. administration, at 11%. Aerosol delivery was more effective than i.v. administration on lung bacteria, according to the bacterial count predictions. Noticeably, the predicted effect following an initial 9-MIU i.v. CMS loading dose was not much different from that obtained after an initial 2- or 3-MIU i.v. dose (data not shown).
DISCUSSION
Only a few studies have been conducted to investigate colistin concentrations within ELF using chromatographic assays, and in these, patients were treated by CMS either i.v. or by aerosol delivery but not by both routes, which limits comparisons. Following i.v. administration of 2 MIU of CMS, Imberti et al. (24) could not measure colistin in BAL fluid. In contrast, Athanassa et al. (25) measured relatively higher (on the order of 10 times) colistin concentrations in the ELF than those in serum after aerosol delivery with 1 MIU of CMS, but the ELF colistin concentrations were 20 μg/ml at the most and therefore much lower than the concentrations that we report here, even considering the 2-fold difference in the dose of nebulized CMS (25). However, those authors also reported serum colistin concentrations with a peak ranging between 1 and 2 μg/ml in most patients after aerosol delivery of 1 MIU of CMS, which is by far higher than what could be anticipated from any other study using the same type of nebulizer.
In the present study, the intrapulmonary distribution of colistin was assessed after CMS aerosol delivery and then after i.v. administration. For ethical reasons and according to the proper use of colistin, the treatment order could not be randomized, since it would not have been possible to interrupt CMS i.v. administration in order to switch to aerosol delivery in the middle of treatment. However, because preclinical data showed much higher ELF colistin concentrations after CMS aerosol delivery than after i.v. administration in rats (14), it was decided that the 1st CMS dose should be nebulized, and subsequent doses would be administered intravenously. Plasma samples were collected after these two initial doses for PK analysis in order to limit a potential effect of intraindividual variability on colistin disposition with time, which would not be unlikely in critically ill patients. However, colistin ELF concentrations after CMS aerosol delivery were expected to be much higher than those after i.v. administration. Consequently, the ELF concentrations of colistin measured after the 1st i.v. administration of CMS might have been artificially overestimated due to the presence of compound remaining from the previous CMS aerosol delivery. The simultaneous data analysis with a population approach used in this study would have been able to manage this issue. However, the analytical uncertainty on ELF concentration assessment due in part to the correction by a dilution factor estimated from urea measurements would have been a complicating factor. It was therefore decided to administer CMS i.v. for several days before measuring the colistin ELF concentrations and concomitant plasma levels at steady state.
It is often considered that colistin pharmacokinetics with i.v. administration of CMS in critically ill patients may vary significantly with the brand of CMS used, which has also been documented in a controlled experiment in rats (26). Accordingly, the plasma data obtained in the present study after giving CMS i.v. are in full agreement with those obtained by our group using the same brand of CMS in the same types of patients (17) but only partially consistent with those of other previously published articles (28, 29).
The major finding of this study was that both CMS and colistin ELF concentrations are much higher (in the order of 100- to 1,000-fold on average) after CMS aerosol delivery than after i.v. administration, which is fully consistent with observations in rats (7, 14). The only major difference with the rat experiments was that after aerosol delivery in patients, most of the CMS was lost with expired airflow, since on average, only 9% of the CMS dose eventually reached the systemic circulation, compared with approximately 69% in rats (7, 14), using the Penn-Century system for deep intrapulmonary delivery. This limited systemic absorption in patients suggests limited systemic toxicity after CMS aerosol delivery. The fraction of the CMS dose converted presystemically into colistin in patients (1.4%) was lower than that in rats (6, 7). However, the kinetics of formation and the absorption of colistin after CMS aerosol delivery are difficult to characterize. Furthermore, it should be remembered that reported CMS concentrations correspond only to apparent values, since unchanged CMS and partially converted derivatives cannot be differentiated using even the most modern analytical assays (12, 26), which precludes a precise interpretation of CMS experimental data. Recently, Yapa et al. (7) used a relatively complex multicompartmental model to characterize colistin absorption after aerosol delivery in rats. Gontijo et al (14) previously used a relatively simpler model but with a nonlinear component. In comparison, a simple model was used in the present study, in particular due to the lack of early data points in the ELF. Also, for this reason, hypotheses were required to reduce the model parameter number, and it was decided to keep the same ELF volume for CMS and colistin. Using a traditional compartmental approach, ELF volume has no physiological meaning, and values up to 30 liters have been estimated (30). Yet, it may be noticed that the 1.2-ml value obtained in the present study and that is common to both CMS and colistin is close to the actual physiological ELF volume in humans (31, 32).
This low ELF volume is mostly responsible for the relatively high CMS and colistin concentrations measured within the ELF, although most of the CMS aerosolized dose (about 90%) was lost with expired airflow. By comparing the ELF concentrations of colistin in patients, obtained after aerosol delivery of 2 MIU of CMS, with the MICs of most susceptible bacteria, one may also consider that 2 MIU of CMS may be a higher dose than is necessary. In fact, CMS concentrations are several orders of magnitude greater (approximately 4- to 20-fold on average) than colistin concentrations within the ELF, and although it is negatively charged and therefore less toxic, allowing its administration as a prodrug of colistin, CMS is also a tension-active compound, with a potential local toxicity at such extremely high concentrations. A better efficacy-to-toxicity ratio might therefore be obtained with lower doses.
Since these data clearly demonstrate a major effect of the CMS route of administration on colistin concentrations, with much higher ELF concentrations obtained after CMS aerosol delivery using a vibrating mesh nebulizer in critically ill patients than those after intravenous administration, a PK-PD modeling approach was used to assess the effect of route of administration on the antimicrobial effect of colistin within the lung. Antibiotic PK-PD relies most often on the PK-PD index differentiating between concentration and time-dependent antibiotics, with targets determined from the plasma concentrations. It is usually admitted that for colistin, the relevant index is the area under the concentration-time curve for plasma (AUCplasma)/MIC ratio, with a breakpoint determined at 27/35 from unbound plasma concentrations (33, 34). Whether antibiotic plasma concentrations reflect tissue concentrations at the infectious site is an important question that has frequently been addressed (35–37). Based on these new pharmacokinetic data, colistin plasma concentrations do not reflect intrapulmonary concentrations and therefore cannot be used to compare antimicrobial activity in the lungs after aerosol and intravenous administrations of CMS. An alternative would be to use ELF instead of plasma concentrations to compare the effect of the route of administration on antimicrobial efficacy in the lungs. However, it would then be necessary to define a new AUCELF/MIC target. Furthermore, this PK-PD index may predict colistin antimicrobial efficacy at steady state, but it is of limited value for assessing the initial CFU decay after CMS treatment initiation, especially since bacterial susceptibility and therefore MIC might rapidly change with time during the initial hours following exposure to the antibiotic, as demonstrated by the regrowth phenomenon observed in the time-kill curves (Fig. 4). It was therefore decided to use a PK-PD modeling approach to predict colistin antimicrobial activity, as was previously done by Mohamed et al. (38). We used a simple model with two subpopulations, S and R, to describe the regrowth. Although this model has no mechanistic meaning, it is the most robust and should be selected in the absence of precise information on the regrowth mechanism (27). This PK-PD model was capable of predicting a clear superiority of CMS aerosol delivery over intravenous administration in terms of antimicrobial activity, consistent with the EC50R value estimated at 25.3 μg/ml when ELF concentrations vary between 40 and 1,136 μg/ml after aerosol delivery and 0.5 and 26 μg/ml after intravenous administration of CMS. Because of the relatively high EC50R value, the so-called resistant bacteria would be almost totally resistant in a range of ELF concentrations (<10 μg/ml) obtained in clinical practice after CMS i.v. administrations. Noticeably, the estimated EC50R value was about 6-fold higher than the highest colistin concentrations used for the kill curve experiments, which may not be ideal. However, the relative standard error (RSE%) values were relatively low, attesting to correct estimations. Furthermore, we have recently observed relatively large differences between EC50S and EC50R using a similar experimental setting (17). According to these data, only aerosol delivery provided sufficiently high and microbiologically efficient colistin concentrations. Therefore, a major effect of the route of administration on the antimicrobial effect was predicted using this P. aeruginosa PAO1 strain. However, this effect would have been less spectacular using another strain with a lower EC50R value. Yet, in clinical practice, a single aerosol delivery with 2 MIU of CMS is unlikely to clear all bacteria in an irreversible manner, as suggested by these simulations (Fig. 5). An explanation might be that colistin does not distribute evenly within the lung and has difficulties reaching some specific areas, such as hypo-oxygenated tissue, where bacteria could develop. The measured ELF concentrations might then dramatically overestimate actual colistin concentrations at the infection site. In vivo experiments should now be conducted to complete these findings. However, these new data seem to support the use of CMS aerosol delivery on top of i.v. administration for the treatment of pulmonary infections in critical care patients.
FIG 5.

Predicted bacterial count over time after CMS aerosol delivery (2 MIU followed by 2 MIU i.v. at 8 h and 16 h) or i.v. administration (2 MIU every 8 h). The median (solid line), 25th to 75th percentile (dark grey area), and 5th to 95th percentile (light grey area) of the predicted counts are illustrated.
ACKNOWLEDGMENTS
M. Jacobs is supported by a doctoral fellowship from the University of Poitiers and the “Conseil Régional de Poitou-Charentes.”
Footnotes
Published ahead of print 29 September 2014
REFERENCES
- 1.Drobnic ME, Suñé P, Montoro JB, Ferrer A, Orriols R. 2005. Inhaled tobramycin in non-cystic fibrosis patients with bronchiectasis and chronic bronchial infection with Pseudomonas aeruginosa. Ann. Pharmacother. 39:39–44. 10.1345/aph.1E099. [DOI] [PubMed] [Google Scholar]
- 2.Ramsey BW, Pepe MS, Quan JM, Otto KL, Montgomery AB, Williams-Warren J, Vasiljev-K M, Borowitz D, Bowman CM, Marshall BC, Marshall S, Smith AL. 1999. Intermittent administration of inhaled tobramycin in patients with cystic fibrosis. Cystic Fibrosis Inhaled Tobramycin Study Group. N. Engl. J. Med. 340:23–30. [DOI] [PubMed] [Google Scholar]
- 3.McCoy KS, Quittner AL, Oermann CM, Gibson RL, Retsch-Bogart GZ, Montgomery AB. 2008. Inhaled aztreonam lysine for chronic airway Pseudomonas aeruginosa in cystic fibrosis. Am. J. Respir. Crit. Care Med. 178:921–928. 10.1164/rccm.200712-1804OC. [DOI] [PMC free article] [PubMed] [Google Scholar]
- 4.Conole D, Keating GM. 2014. Colistimethate sodium dry powder for inhalation: a review of its use in the treatment of chronic Pseudomonas aeruginosa infection in patients with cystic fibrosis. Drugs 74:377–387. 10.1007/s40265-014-0181-0. [DOI] [PubMed] [Google Scholar]
- 5.Lu Q, Girardi C, Zhang M, Bouhemad B, Louchahi K, Petitjean O, Wallet F, Becquemin MH, Le Naour G, Marquette CH, Rouby JJ. 2010. Nebulized and intravenous colistin in experimental pneumonia caused by Pseudomonas aeruginosa. Intensive Care Med. 36:1147–1155. 10.1007/s00134-010-1879-4. [DOI] [PubMed] [Google Scholar]
- 6.Marchand S, Gobin P, Brillault J, Baptista S, Adier C, Olivier JC, Mimoz O, Couet W. 2010. Aerosol therapy with colistin methanesulfonate: a biopharmaceutical issue illustrated in rats. Antimicrob. Agents Chemother. 54:3702–3707. 10.1128/AAC.00411-10. [DOI] [PMC free article] [PubMed] [Google Scholar]
- 7.Yapa SWS, Li J, Porter CJ, Nation RL, Patel K, McIntosh MP. 2013. Population pharmacokinetics of colistin methanesulfonate in rats: achieving sustained lung concentrations of colistin for targeting respiratory infections. Antimicrob. Agents Chemother. 57:5087–5095. 10.1128/AAC.01127-13. [DOI] [PMC free article] [PubMed] [Google Scholar]
- 8.Cockcroft DW, Gault MH. 1976. Prediction of creatinine clearance from serum creatinine. Nephron 16:31–41. 10.1159/000180580. [DOI] [PubMed] [Google Scholar]
- 9.Nation RL, Li J, Cars O, Couet W, Dudley MN, Kaye KS, Mouton JW, Paterson DL, Tam VH, Theuretzbacher U, Tsuji BT, Turnidge JD. 2013. Consistent global approach on reporting of colistin doses to promote safe and effective use. Clin. Infect. Dis. 58:139–141. 10.1093/cid/cit680. [DOI] [PubMed] [Google Scholar]
- 10.Boselli E, Breilh D, Duflo F, Saux MC, Debon R, Chassard D, Allaouchiche B. 2003. Steady-state plasma and intrapulmonary concentrations of cefepime administered in continuous infusion in critically ill patients with severe nosocomial pneumonia. Crit. Care Med. 31:2102–2106. 10.1097/01.CCM.0000069734.38738.C8. [DOI] [PubMed] [Google Scholar]
- 11.Couet W, Grégoire N, Gobin P, Saulnier PJ, Frasca D, Marchand S, Mimoz O. 2011. Pharmacokinetics of colistin and colistimethate sodium after a single 80-mg intravenous dose of CMS in young healthy volunteers. Clin. Pharmacol. Ther. 89:875–879. 10.1038/clpt.2011.48. [DOI] [PubMed] [Google Scholar]
- 12.Gobin P, Lemaître F, Marchand S, Couet W, Olivier JC. 2010. Assay of colistin and colistin methanesulfonate in plasma and urine by liquid chromatography-tandem mass spectrometry (LC-MS/MS). Antimicrob. Agents Chemother. 54:1941–1948. 10.1128/AAC.01367-09. [DOI] [PMC free article] [PubMed] [Google Scholar]
- 13.Marchand S, Frat JP, Petitpas F, Lemaître F, Gobin P, Robert R, Mimoz O, Couet W. 2010. Removal of colistin during intermittent haemodialysis in two critically ill patients. J. Antimicrob. Chemother. 65:1836–1837. 10.1093/jac/dkq185. [DOI] [PubMed] [Google Scholar]
- 14.Gontijo AV, Grégoire N, Lamarche I, Gobin P, Couet W, Marchand S. 2014. Biopharmaceutical characterization of nebulized antimicrobial agents in rats: 2. Colistin. Antimicrob. Agents Chemother. 58:3950–3956. 10.1128/AAC.02819-14. [DOI] [PMC free article] [PubMed] [Google Scholar]
- 15.Li J, Milne RW, Nation RL, Turnidge JD, Smeaton TC, Coulthard K. 2003. Use of high-performance liquid chromatography to study the pharmacokinetics of colistin sulfate in rats following intravenous administration. Antimicrob. Agents Chemother. 47:1766–1770. 10.1128/AAC.47.5.1766-1770.2003. [DOI] [PMC free article] [PubMed] [Google Scholar]
- 16.Bulitta JB, Bingölbali A, Shin BS, Landersdorfer CB. 2011. Development of a new pre- and post-processing tool (SADAPT-TRAN) for nonlinear mixed-effects modeling in S-ADAPT. AAPS J. 13:201–211. 10.1208/s12248-011-9257-x. [DOI] [PMC free article] [PubMed] [Google Scholar]
- 17.Grégoire N, Mimoz O, Mégarbane B, Comets E, Chatelier D, Lasocki S, Gauzit R, Balayn D, Gobin P, Marchand S, Couet W. 2014. New colistin population pharmacokinetic data in critically ill patients suggesting an alternative loading dose rationale. Antimicrob. Agents Chemother. 58:7324–7330. 10.1128/AAC.03508-14. [DOI] [PMC free article] [PubMed] [Google Scholar]
- 18.Bauer RJ, Guzy S, Ng C. 2007. A survey of population analysis methods and software for complex pharmacokinetic and pharmacodynamic models with examples. AAPS J. 9:E60–E83. 10.1208/aapsj0901007. [DOI] [PMC free article] [PubMed] [Google Scholar]
- 19.Bulitta JB, Landersdorfer CB. 2011. Performance and robustness of the Monte Carlo importance sampling algorithm using parallelized S-ADAPT for basic and complex mechanistic models. AAPS J. 13:212–226. 10.1208/s12248-011-9258-9. [DOI] [PMC free article] [PubMed] [Google Scholar]
- 20.Beal SL. 2001. Ways to fit a PK model with some data below the quantification limit. J. Pharmacokinet. Pharmacodyn. 28:481–504. 10.1023/A:1012299115260. [DOI] [PubMed] [Google Scholar]
- 21.Jumbe N, Louie A, Leary R, Liu W, Deziel MR, Tam VH, Bachhawat R, Freeman C, Kahn JB, Bush K, Dudley MN, Miller MH, Drusano GL. 2003. Application of a mathematical model to prevent in vivo amplification of antibiotic-resistant bacterial populations during therapy. J. Clin. Invest. 112:275–285. 10.1172/JCI200316814. [DOI] [PMC free article] [PubMed] [Google Scholar]
- 22.Gumbo T, Louie A, Deziel MR, Parsons LM, Salfinger M, Drusano GL. 2004. Selection of a moxifloxacin dose that suppresses drug resistance in Mycobacterium tuberculosis, by use of an in vitro pharmacodynamic infection model and mathematical modeling. J. Infect. Dis. 190:1642–1651. 10.1086/424849. [DOI] [PubMed] [Google Scholar]
- 23.Campion JJ, McNamara PJ, Evans ME. 2005. Pharmacodynamic modeling of ciprofloxacin resistance in Staphylococcus aureus. Antimicrob. Agents Chemother. 49:209–219. 10.1128/AAC.49.1.209-219.2005. [DOI] [PMC free article] [PubMed] [Google Scholar]
- 24.Imberti R, Cusato M, Villani P, Carnevale L, Iotti GA, Langer M, Regazzi M. 2010. Steady-state pharmacokinetics and BAL concentration of colistin in critically Ill patients after IV colistin methanesulfonate administration. Chest 138:1333–1339. 10.1378/chest.10-0463. [DOI] [PubMed] [Google Scholar]
- 25.Athanassa ZE, Markantonis SL, Fousteri MZ, Myrianthefs PM, Boutzouka EG, Tsakris A, Baltopoulos GJ. 2012. Pharmacokinetics of inhaled colistimethate sodium (CMS) in mechanically ventilated critically ill patients. Intensive Care Med. 38:1779–1786. 10.1007/s00134-012-2628-7. [DOI] [PubMed] [Google Scholar]
- 26.He H, Li JC, Nation RL, Jacob J, Chen G, Lee HJ, Tsuji BT, Thompson PE, Roberts K, Velkov T, Li J. 2013. Pharmacokinetics of four different brands of colistimethate and formed colistin in rats. J. Antimicrob. Chemother. 68:2311–2317. 10.1093/jac/dkt207. [DOI] [PMC free article] [PubMed] [Google Scholar]
- 27.Jacobs M, Grégoire N, Couet W, Bulitta JB. 2013. Characterization of semi-mechanistic pharmacokinetic-pharmacodynamic models of antibacterial activity via Monte Carlo simulations, poster 933. 23rd Eur. Congr. Clin. Microbiol. Infect. Dis., 27 to 30 April 2013, Berlin, Germany. [Google Scholar]
- 28.Garonzik SM, Li J, Thamlikitkul V, Paterson DL, Shoham S, Jacob J, Silveira FP, Forrest A, Nation RL. 2011. Population pharmacokinetics of colistin methanesulfonate and formed colistin in critically ill patients from a multicenter study provide dosing suggestions for various categories of patients. Antimicrob. Agents Chemother. 55:3284–3294. 10.1128/AAC.01733-10. [DOI] [PMC free article] [PubMed] [Google Scholar]
- 29.Plachouras D, Karvanen M, Friberg LE, Papadomichelakis E, Antoniadou A, Tsangaris I, Karaiskos I, Poulakou G, Kontopidou F, Armaganidis A, Cars O, Giamarellou H. 2009. Population pharmacokinetic analysis of colistin methanesulfonate and colistin after intravenous administration in critically ill patients with infections caused by Gram-negative bacteria. Antimicrob. Agents Chemother. 53:3430–3436. 10.1128/AAC.01361-08. [DOI] [PMC free article] [PubMed] [Google Scholar]
- 30.Lodise TP, Sorgel F, Melnick D, Mason B, Kinzig M, Drusano GL. 2011. Penetration of meropenem into epithelial lining fluid of patients with ventilator-associated pneumonia. Antimicrob. Agents Chemother. 55:1606–1610. 10.1128/AAC.01330-10. [DOI] [PMC free article] [PubMed] [Google Scholar]
- 31.Fernandes CA, Vanbever R. 2009. Preclinical models for pulmonary drug delivery. Expert Opin. Drug Deliv. 6:1231–1245. 10.1517/17425240903241788. [DOI] [PubMed] [Google Scholar]
- 32.Rennard SI, Basset G, Lecossier D, O'Donnell KM, Pinkston P, Martin PG, Crystal RG. 1986. Estimation of volume of epithelial lining fluid recovered by lavage using urea as marker of dilution. J. Appl. Physiol. (1985) 60:532–538. [DOI] [PubMed] [Google Scholar]
- 33.Bergen PJ, Bulitta JB, Forrest A, Tsuji BT, Li J, Nation RL. 2010. Pharmacokinetic/pharmacodynamic investigation of colistin against Pseudomonas aeruginosa using an in vitro model. Antimicrob. Agents Chemother. 54:3783–3789. 10.1128/AAC.00903-09. [DOI] [PMC free article] [PubMed] [Google Scholar]
- 34.Dudhani RV, Turnidge JD, Coulthard K, Milne RW, Rayner CR, Li J, Nation RL. 2010. Elucidation of pharmacokinetic/pharmacodynamic determinant of colistin activity against Pseudomonas aeruginosa in murine thigh and lung infection models. Antimicrob. Agents Chemother. 54:1117–1124. 10.1128/AAC.01114-09. [DOI] [PMC free article] [PubMed] [Google Scholar]
- 35.Dahyot C, Marchand S, Bodin M, Debeane B, Mimoz O, Couet W. 2008. Application of basic pharmacokinetic concepts to analysis of microdialysis data: illustration with imipenem muscle distribution. Clin. Pharmacokinet. 47:181–189. 10.2165/00003088-200847030-00004. [DOI] [PubMed] [Google Scholar]
- 36.Liu P, Rand KH, Obermann B, Derendorf H. 2005. Pharmacokinetic-pharmacodynamic modelling of antibacterial activity of cefpodoxime and cefixime in in vitro kinetic models. Int. J. Antimicrob. Agents 25:120–129. 10.1016/j.ijantimicag.2004.09.012. [DOI] [PubMed] [Google Scholar]
- 37.Marchand S, Dahyot C, Lamarche I, Mimoz O, Couet W. 2005. Microdialysis study of imipenem distribution in skeletal muscle and lung extracellular fluids of noninfected rats. Antimicrob. Agents Chemother. 49:2356–2361. 10.1128/AAC.49.6.2356-2361.2005. [DOI] [PMC free article] [PubMed] [Google Scholar]
- 38.Mohamed AF, Karaiskos I, Plachouras D, Karvanen M, Pontikis K, Jansson B, Papadomichelakis E, Antoniadou A, Giamarellou H, Armaganidis A, Cars O, Friberg LE. 2012. Application of a loading dose of colistin methanesulfonate in critically ill patients: population pharmacokinetics, protein binding, and prediction of bacterial kill. Antimicrob. Agents Chemother. 56:4241–4249. 10.1128/AAC.06426-11. [DOI] [PMC free article] [PubMed] [Google Scholar]