Abstract
Staphylococcus epidermidis biofilm formation is responsible for the persistence of orthopedic implant infections. Previous studies have shown that exposure of S. epidermidis biofilms to sub-MICs of antibiotics induced an increased level of biofilm persistence. BODIPY FL-vancomycin (a fluorescent vancomycin conjugate) and confocal microscopy were used to show that the penetration of vancomycin through sub-MIC-vancomycin-treated S. epidermidis biofilms was impeded compared to that of control, untreated biofilms. Further experiments showed an increase in the extracellular DNA (eDNA) concentration in biofilms preexposed to sub-MIC vancomycin, suggesting a potential role for eDNA in the hindrance of vancomycin activity. Exogenously added, S. epidermidis DNA increased the planktonic vancomycin MIC and protected biofilm cells from lethal vancomycin concentrations. Finally, isothermal titration calorimetry (ITC) revealed that the binding constant of DNA and vancomycin was 100-fold higher than the previously reported binding constant of vancomycin and its intended cellular d-Ala-d-Ala peptide target. This study provides an explanation of the eDNA-based mechanism of antibiotic tolerance in sub-MIC-vancomycin-treated S. epidermidis biofilms, which might be an important factor for the persistence of biofilm infections.
INTRODUCTION
Medical device infections are often associated with the formation of Staphylococcus epidermidis biofilms and are difficult to eradicate, because compared to planktonic cells, biofilm cells are more resistant to antibiotics and host immune attack (1). Recent evidence has shown that subinhibitory concentrations of various antibiotics induced biofilm formation of S. epidermidis (2–4), which in part may explain some of the resistance to antibiotic therapy. In addition, although various antibiotics were able to reduce the biomass of S. epidermidis biofilms at sub-MICs, these biofilms exhibited an increased level of resistance to dicloxacillin, tetracycline, and rifampin (5). Collectively, these findings suggest that exposure to antibiotics at sub-MICs induces an increased level of biofilm persistence in S. epidermidis.
Sub-MIC antibiotic exposure is a clinically relevant issue, since some antibiotics undergo interactions with blood serum proteins, as in the case of vancomycin and immunoglobulin A (6), possibly resulting in a diluted concentration of the antibiotic reaching the infection site. Furthermore, despite high concentration levels in the surrounding environment, antibiotics at sub-MICs may exist in the internal parts of the biofilm, because of the physical and chemical barriers to the penetration of antibiotics provided by the biofilm matrix (3).
The biofilm matrix contributes to antibiotic tolerance by either acting as a physiochemical barrier to penetration or by inactivating the antibiotic during its transport through the biofilm (7). To date, complete diffusion through biofilms has been observed for ciprofloxacin in Klebsiella pneumoniae (8) and Pseudomonas aeruginosa biofilms (9) and for rifampin and vancomycin in S. epidermidis biofilms (10, 11), suggesting that the physical presence of the matrix is not necessarily a barrier to the penetration of antimicrobials into the biofilm. However, while there can be convective flow through channels in the biofilm, flow through the cell clusters is by diffusion (12), so it is possible that antibiotics can penetrate rapidly through the biofilm via channels but may be hindered locally in reaching cells within the extracellular polymeric substance (EPS) matrix. The length of time taken to reach MICs in the interior of the biofilm is dependent on the effective diffusion coefficient in the biofilm (De) and the square of the biofilm thickness (L) (13). Mass transport studies generally show that, depending on the solute, De is reduced by 20 to 80%. However, it is possible that transport could be limited further if sub-MIC antibiotics stimulate biofilm bacteria to produce more EPS material. The extra EPS might bind or react with the target threat or increase the thickness of the biofilm clusters and thus the length of the diffusive path. The role of the EPS in the interference of antimicrobial affectivity is demonstrated by alginate and Psl, two EPS polysaccharides of P. aeruginosa biofilms which can bind tobramycin (alginate) (14) and sequester a range of positively and negatively charged antibiotics (Psl) (15).
One of the major matrix components of S. epidermidis biofilms is known as polysaccharide intercellular adhesin (PIA) and is produced by the enzymes encoded by the ica operon (16). The expression of ica is environmentally regulated (17) and has been associated with a number of functions within the biofilm, including abiotic surface attachment, intercellular adhesion, virulence, biofilm formation, and antibiotic tolerance (18). However, staphylococci can employ PIA-independent mechanisms of biofilm formation through the use of extracellular matrix binding protein (Embp) and extracellular DNA (eDNA) release (19).
In S. epidermidis biofilms, the production of eDNA is controlled largely by the AtlE autolysin, which causes lysis of a subpopulation of biofilm cells, resulting in the release of DNA into the matrix (20). In the matrix, eDNA acts as a structural component (21–23), a facilitator of cell-to-cell aggregation (24), a surface-based structural adhesin, a nutrient source, and a trader of genetic information among the microbial community (25). Moreover, S. epidermidis mutants lacking the atlE gene formed biofilms with a lower abundance of eDNA than the wild type and exhibited a significant decrease in the ability to cause in vivo infections (26), suggesting that eDNA may contribute to the pathogenesis of S. epidermidis biofilms. Furthermore, the chelation of divalent cations by eDNA can lead to increased antibiotic tolerance, whereas chelation of cationic antimicrobial peptides protects the biofilm from host defenses (27).
Previous studies have shown that preexposure to methicillin and vancomycin at sub-MICs induced an eDNA-dependent mechanism of biofilm formation in Staphylococcus aureus and S. epidermidis, respectively (23, 28). In the absence of antibiotics, while eDNA acts as a major structural adhesin in S. aureus biofilms, it is only a minor matrix component of S. epidermidis biofilms (29). Given the sensitivity of sub-MIC-vancomycin-treated S. epidermidis RP62A (or ATCC 35984) biofilms to DNase (23), we hypothesized that eDNA could impact the transport of vancomycin through sub-MIC-vancomycin-treated biofilms. Although the role of biofilm eDNA in shielding against aminoglycosides has been demonstrated previously (30), little is known about the effects of eDNA against glycopeptide antibiotics such as vancomycin.
Thus, this study examined whether a change in the abundance of eDNA and PIA in S. epidermidis ATCC 35984 biofilms preexposed to sub-MIC vancomycin could affect the transport of vancomycin through biofilms. Furthermore, we looked for a correlation between preexposure to vancomycin and eDNA production, as well as the ability of DNA to inhibit the activity of vancomycin.
MATERIALS AND METHODS
Strain and biofilm growth conditions.
S. epidermidis ATCC 35984, a common laboratory strain that is ica positive and a good biofilm former (31), was used for all biofilm experiments. Biofilms were grown in 100% tryptic soy broth (TSB) (Sigma-Aldrich, United Kingdom) at the bottom of 96-well, 12-well, or 24-well microplates from an overnight culture of S. epidermidis diluted to a final concentration of 106 CFU/ml. Biofilms were incubated at 37°C and 5% CO2 for a total period of 72 h. Every 24 h of the total growth period, biofilms were rinsed with phosphate-buffered saline (PBS) and medium was replenished. For the sub-MIC-vancomycin-treated biofilms at 48 h of the total growth period, fresh medium was supplemented with 2 μg/ml vancomycin and grown for a further 24 h. The described protocol applies to all the experiments presented in this work, unless stated otherwise.
MIC determination.
To study the transport of vancomycin in biofilms, we used a fluorescently conjugated form of the antibiotic (BODIPY FL-vancomycin). To determine the MIC of both BODIPY FL-vancomycin and vancomycin, a 2-fold dilution series of vancomycin (Sigma-Aldrich, United Kingdom) and BODIPY FL-vancomycin (Invitrogen, United Kingdom) was prepared in 100% TSB, resulting in the following test concentrations (μg/ml): 2, 4, 8, and 16. The tubes were inoculated with a diluted overnight culture of S. epidermidis to achieve a final concentration of 105 CFU/ml. The cultures were grown at 37°C for 24 h. The MIC was determined as the minimum concentration of the antibiotic at which no visible growth occurred. The MICs for vancomycin and BODIPY FL-vancomycin were 4 μg/ml and 8 μg/ml, respectively (data not shown), suggesting that the attachment of the BODIPY FL fluorophore slightly decreased the potency of vancomycin to S. epidermidis cells.
Based on these results, we chose 2 μg/ml of vancomycin as a sub-MIC for all subsequent experiments. In addition, we chose 2 μg/ml of BODIPY FL-vancomycin as the secondary vancomycin treatment for the transport experiments, because this concentration provided images with good, quantifiable fluorescence using our imaging protocol.
Imaging of vancomycin and PIA in biofilms.
The transport of vancomycin through biofilms was measured using BODIPY FL-vancomycin by confocal laser scanning microscopy (CLSM). Control and sub-MIC-vancomycin-treated biofilms were grown in 12-well microplates and stained with propidium iodide (PI) (Invitrogen, United Kingdom) at a final concentration of 30 μM for the visualization of the biofilm biomass. Following 20 min of staining with PI, biofilms were washed twice with sterile H2O and subsequently stained with BODIPY FL-vancomycin. BODIPY FL-vancomycin was prepared according to the manufacturer's instructions and added to the biofilms directly at a final concentration of 2 μg/ml. The plates were then incubated in the dark at room temperature (RT) for 30 min. Following a rinse with PBS, the samples were imaged on an upright confocal microscope (Axioplan 2 LSM 510 Meta system; Zeiss) using a 40× immersion objective. Both stains were excited using the 488-nm laser. The fluorescent signals from PI and BODIPY FL-vancomycin were collected at >560 nm and 505 to 530 nm, respectively. Images were acquired in 10 different locations, and each experiment was repeated 3 times.
PIA in the biofilm was visualized using Alexa Fluor wheat germ agglutinin (WGA) (Invitrogen, United Kingdom), which stains N-acetylglucosamine residues. The WGA was prepared according to the manufacturer's instructions and applied to control and sub-MIC-vancomycin-treated biofilms at a final concentration of 500 μg/ml for 30 min. In this set of experiments, biofilm biomass was visualized using the autofluorescent properties of the biofilm. Biofilms were excited with 543-nm, 488-nm, and 633-nm lasers simultaneously. WGA fluorescence was collected at >650 nm, and biofilm autofluorescence was collected in the orange region of the spectrum (560 to 650 nm).
Image analysis was performed with ImageJ (32). Line fluorescence profiles were obtained from 8 locations (25 μm apart) within an XZ confocal image. Each fluorescence profile was used to calculate the depth of the fluorescent layer in the image, as shown in Fig. S1 in the supplemental material.
Detection of eDNA in control and sub-MIC-vancomycin-treated biofilms.
To quantify the relative eDNA concentration in control and sub-MIC-vancomycin-treated S. epidermidis biofilms, we measured the rate of DNase activity in control and sub-MIC-vancomycin-treated biofilms. The rate of DNase activity, measured as a decrease in optical density at 600 nm (OD600) with time, corresponds to the rate of biofilm removal. Classic enzyme kinetics relates the rate of an enzyme's activity to the concentration of the enzyme's substrate (33); thus, the rate of DNase activity can provide semiquantitative information about the concentration of its substrate. We assume that within the biofilm, DNase will be acting only on eDNA, and thus the rate of dissolution of the biofilm will be directly related to eDNA concentration.
To determine the rate of DNase activity in control and sub-MIC-vancomycin-treated biofilms, we performed the following experiment. DNase I from bovine pancreas (Sigma-Aldrich, United Kingdom) was prepared and stored according to the manufacturer's instructions. Two sets of control and sub-MIC-vancomycin-treated S. epidermidis biofilms were grown in 96-well microplates for 72 h. One set of control and sub-MIC-vancomycin-treated biofilms was then exposed to DNase I at a final concentration of 100 μg/ml, while the other set of biofilm samples was treated with PBS, which was used as a control for the enzyme. OD600 measurements of both sample sets were recorded simultaneously at 37°C and 15-min intervals for a total of 180 min using a FLUOstar Omega Plus plate reader (BMG Labtech, United Kingdom). To calculate the rate of DNase I activity, the largest change in OD600 was divided by the time taken for that change to occur for each biofilm sample.
To quantify extracted eDNA, duplicate 72-h control and sub-MIC-vancomycin-treated biofilms were grown in petri plates, and eDNA was extracted as described previously (34). DNA concentration was quantified using a NanoDrop spectrophotometer (Thermo Scientific, United Kingdom) OD260/OD280 function, and the average DNA concentration was determined from three independent experiments.
Fluorescence-based detection of eDNA.
Previous studies have shown that the diffuse fluorescence exhibited in biofilms stained with 4′,6-diamidino-2-phenylindole (DAPI) is eDNA specific (35, 36); thus, we chose DAPI for our studies of eDNA in biofilms. We considered PI as an inefficient stain for eDNA, because it was previously shown to not detect all the eDNA in a biofilm (37).
A ready-to-use kit of cell-impermeable DAPI stain (NucBlue fixed-cell ReadyProbes reagent; Invitrogen, United Kingdom) was prepared as per the manufacturer's instruction. To confirm the cell impermeability of the DAPI kit, an overnight culture was pelleted, washed with PBS, and either left untreated or permeabilized via a 10-min 70% ethanol treatment. Cells were incubated with DAPI for 30 min and imaged using a 20× air objective and a cooled monochrome charge-coupled-device (CCD) camera (Olympus XM10) operated through Olympus Soft Imaging Systems (OSIS)'s xCellence software and analyzed using ImageJ. Dead, permeabilized cells stained with DAPI, while untreated cells did not (see Fig. S2A in the supplemental material), demonstrating that DAPI did not enter intact cells.
To determine the specificity of DAPI staining for eDNA (as opposed to cytoplasmic DNA), 48-h control biofilms and biofilms treated for 30 min with 100 μg/ml DNase I were stained with DAPI for 30 min and then imaged as described above. The application of DNase I to S. epidermidis control biofilms resulted in a substantial loss of biofilm structure (see Fig. S2B in the supplemental material), demonstrating that our biofilms contained eDNA. Furthermore, control biofilms treated with DNase exhibited a large decrease in the abundance of the diffuse staining (see region y in Fig. S2C) and exhibited only fluorescence of high intensity (see region x in Fig. S2C), suggesting that in our experiments diffuse fluorescence of DAPI-stained biofilms was due to eDNA.
Since the diffuse staining of eDNA appeared to be of lower fluorescence intensity, we hypothesized that there may be a binary distribution of fluorescence. This was not the case with regard to the overall fluorescence (see Fig. S3A in the supplemental material), but regions of interest containing possible fluorescence from eDNA and cytoplasmic DNA did exhibit binary distribution of fluorescence (see Fig. S3B). This analysis suggested that a value of 124 gray scale units (GSU) (see Fig. S3B) could be used as a threshold to quantitatively separate the fluorescence of eDNA and cytoplasmic DNA in dead cells.
However, in order to validate this method, we quantified the range of eDNA and cytoplasmic DNA fluorescence intensity based on morphological characteristics of the two regions of interest. Regions of interest with suspected fluorescence of cytoplasmic DNA were selected on the basis of the following criteria: circle-shaped aggregates that contain distinctive points of fluorescence (Fig. 1A). Regions of interest with suspected fluorescence of eDNA were selected on the basis of the following criteria: fluorescence of diffuse appearance without an undefined structure (Fig. 1B) or point of origin which at low magnification exhibits the appearance of strand-like appendages. ImageJ was used to select and obtain the modal fluorescence intensity value of 70 sample areas across 30 different images.
FIG 1.
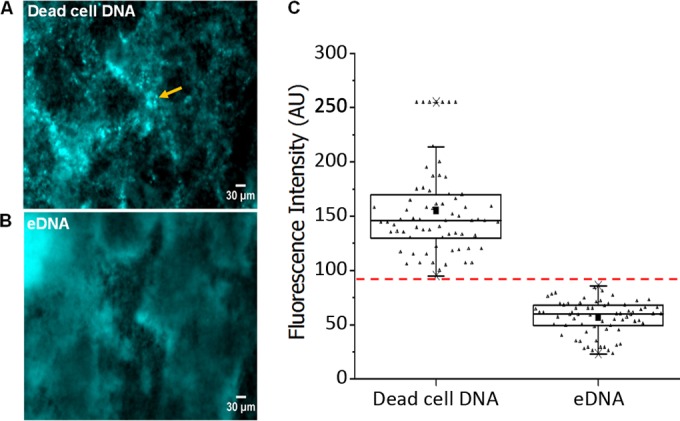
Regions of low DAPI fluorescence in S. epidermidis biofilms correspond to eDNA. Representative micrographs of 48-h control S. epidermidis biofilms depicting regions of high fluorescence intensity in the cocci (yellow arrow), attributed to cytoplasmic DNA in dead cells (A), and regions of low fluorescence intensity and undefined structure, attributed to eDNA (B). Scale bar = 30 μm. (C) The bimodal fluorescence intensity of DAPI obtained from regions attributed to dead-cell DNA and eDNA as determined from 10 different sample regions per image, per sample (small triangles). Box and whiskers, minimum and maximum recorded modal fluorescence intensity for DAPI-bound dead-cell DNA and eDNA fluorescence. The horizontal line across the box is the median fluorescence intensity of dead-cell cytoplasmic DNA and eDNA. The solid squares are the average of the modal fluorescence intensity recorded for dead-cell DNA and eDNA fluorescence. The dashed red line is the maximum cutoff value for the fluorescence intensity of DAPI bound to eDNA.
This analysis revealed that the maximum fluorescence intensity of regions suspected to contain eDNA fluorescence was 80 GSU. Therefore, we defined the fluorescence of cytoplasmic DNA in dead cells as fluorescence of >95 GSU and the fluorescence of eDNA as that of 80 GSU or less (Fig. 1C). Although the binary distribution of fluorescence suggested a threshold value of 124 GSU, we chose 80 GSU in order to more sufficiently eliminate any interference of fluorescence of cytoplasmic DNA (Fig. 1C) in the quantification of eDNA fluorescence.
After establishing that we could use DAPI to distinguish eDNA, we applied the following protocol to the staining of vancomycin-treated biofilms. Biofilms were grown in 6-well microplates for 24 h and treated with vancomycin (0, 2, 4, and 8 μg/ml) for 24 h (total growth period of 48 h). Biofilms were washed once with PBS and stained with DAPI for 30 min. The stain was washed off with PBS, and the biofilms were imaged as described above. To quantify the eDNA fluorescence as a function of vancomycin concentration, we calculated the fluorescence intensity (FI) of 10 different eDNA regions (taken from 10 images in triplicate treated and nontreated biofilms, for a total of 30 values) for each vancomycin concentration. If the average FI of a chosen eDNA region exceeded the threshold limit of 80 GSU, then this region was discarded and another was selected.
Since images of biofilms at different vancomycin concentrations may have the same average FI (e.g., 80 GSU) but different numbers of pixels exhibiting the said average fluorescence, we normalized the data to account for the number of pixels corresponding to the average fluorescence intensity of eDNA. We calculated fluorescence intensity of eDNA for each pixel and divided the average fluorescence intensity of eDNA by the number of pixels at the average FI.
Assessment of S. epidermidis cell growth in the presence of exogenous DNA.
We extracted extracellular DNA from planktonic cultures of S. epidermidis ATCC 35984 as described previously (24). The DNA concentration was determined using the NanoDrop spectrophotometer. To test the effects of exogenous DNA on the growth of S. epidermidis, TSB medium was supplemented with vancomycin (0, 2, 4, and 8 μg/ml) alone, exogenous DNA (0, 5, and 16 μg/ml) alone, or both vancomycin and DNA. Vancomycin (made up in sterile H2O) and DNA (resuspended in Tris-EDTA [TE] buffer) were preincubated for 30 min before the addition of cells. Finally, S. epidermidis was added to all samples at a final concentration of 105 CFU/ml and incubated at 37°C for 24 h. OD600 at 24 h was recorded on a 96-well microplate using a FLUOstar Omega Plus (BMG Labtech, United Kingdom) plate reader. The protocol outlined above was also repeated with salmon sperm DNA (0, 5, and 16 μg/ml) and vancomycin (0, 2, 4, and 8 μg/ml).
To determine if exogenous DNA could protect bacterial cells in an S. epidermidis biofilm from lethal vancomycin concentrations, S. epidermidis ATCC 35984 biofilms were grown in TSB, in large petri dishes (90-mm diameter) (Fisher Scientific, United Kingdom), for a total period of 72 h. The biofilms were then washed thoroughly with PBS and treated with exogenous DNA (16 μg/ml) and vancomycin (2 mg/ml) separately and in combination. The DNA-vancomycin solution was preincubated at 25°C for 30 min before the addition to biofilm cells. All reagents were added to the biofilms directly, at 1 ml, and pipetted slowly around the entire surface area. All biofilms were incubated at 37°C and 5% CO2 for 2 h.
Measurements of DNA and vancomycin binding.
We used isothermal titration calorimetry (ITC) to measure the thermodynamic parameters of binding interactions between vancomycin and DNA. To ensure that the DNA was pure, we used commercially available salmon sperm DNA (Sigma-Aldrich, United Kingdom). Both the salmon sperm DNA and vancomycin were made up in ultrapure water at the final concentrations of 0.005 mM and 0.075 mM, respectively, and divided into 9 injections with an interval of 200 s after each injection. All measurements were performed using the MicroCal ITC 200 at 25°C, with a stirring speed of 800 rpm and a reference power of 10 mcal/s. Data were analyzed using Origin 7.0 software (MicroCal) and fitted to the “one-site binding model.” The measured thermodynamic parameters, such as binding affinity (Ka) and enthalpy changes (ΔH), are representative of three independent experiments. Gibbs free energy changes were calculated using ΔG = ΔH − TΔS, T is temperature in Kelvin and ΔS represents a change in entropy.
RESULTS
Penetration of BODIPY FL-vancomycin is reduced in biofilms treated with sub-MIC vancomycin.
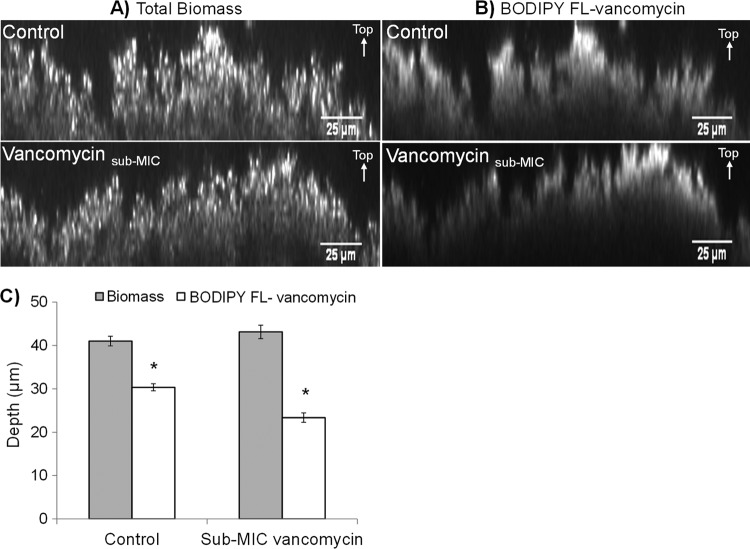
In this experiment, we aimed to determine if there is a difference in the ability of vancomycin to penetrate through sub-MIC-vancomycin-treated and control biofilms. To test this hypothesis, control and sub-MIC-vancomycin-treated biofilms were stained with PI and BODIPY FL-vancomycin, to visualize the biofilm biomass and vancomycin penetration, respectively.
PI fluorescence results revealed no significant differences (P = 0.227, n = 30 from 10 images from each of three replicate biofilms) in the biofilm biomass thickness of control (41 ± 3 μm) and sub-MIC-vancomycin-treated (43 ± 4 μm) biofilms; thus, sub-MIC vancomycin at 2 μg/ml did not induce biofilm formation (Fig. 2A). BODIPY FL-vancomycin fluorescence, however, penetrated 6 μm deeper in control biofilms than in sub-MIC-vancomycin-treated biofilms (Fig. 2B), equating to a 19% (±5% standard error [SE]) (P < 0.05) reduction in the penetration depth of BODIPY FL-vancomycin over a 30-min period (Fig. 2C).
FIG 2.
Vancomycin penetrates through sub-MIC-vancomycin-treated biofilms less than in control biofilms. Representative micrographs of 72-h control and sub-MIC-vancomycin-treated S. epidermidis biofilms. Biofilms treated with sub-MIC vancomycin were grown in 2 μg/ml of vancomycin for the last 24 h of the total 72-h growth period. (A) Biofilm biomass of control and sub-MIC-vancomycin-treated biofilms as visualized by propidium iodide (PI) fluorescence. (B) Penetration of secondary vancomycin treatment in control and sub-MIC-vancomycin-treated biofilms after a 30-min exposure visualized by BODIPY FL-vancomycin fluorescence. Scale bar = 25 μm. (C) Average depth of PI and BODIPY FL-vancomycin fluorescence in control and sub-MIC-vancomycin-treated S. epidermidis biofilms. Error bars, standard errors of the mean (n = 30 from 10 images from each of three replicate biofilms). Asterisk indicates statistically significant results (P < 0.05) as determined by the Student t test.
The relative abundance of PIA does not differ between control and sub-MIC-vancomycin-treated biofilms.
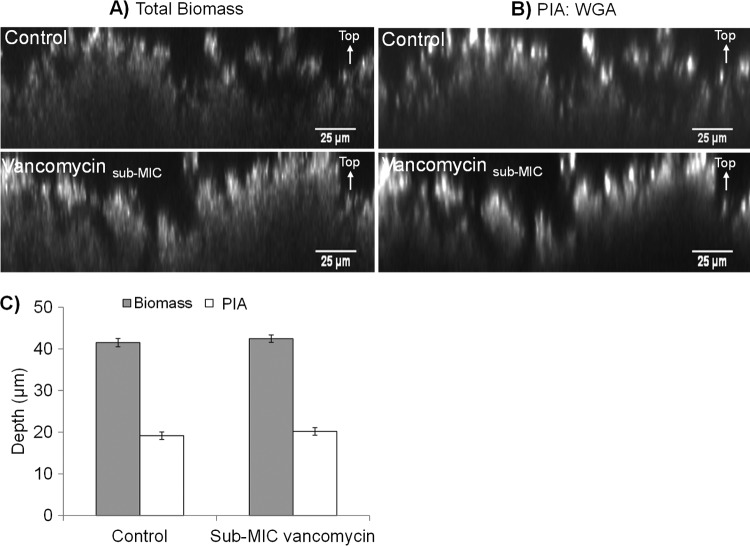
Kaplan and colleagues showed that sub-MIC-vancomycin-treated S. epidermidis ATCC 35984 biofilms were sensitive to dispersin B (23), an enzyme which degrades PIA. This suggests that the matrix of sub-MIC-vancomycin-treated S. epidermidis biofilms contains a high quantity of PIA. Therefore, we performed an experiment to determine any possible differences in the relative abundance of PIA between control and sub-MIC-vancomycin-treated biofilms. In this particular set of experiments, we used confocal microscopy and biofilm autofluorescence to assess biofilm biomass and an Alexa Fluor-conjugated wheat germ agglutinin (WGA) lectin to visualize PIA within the biofilm.
In agreement with our previous findings using PI fluorescence, the biofilm thickness from autofluorescence showed that biofilms treated with sub-MIC vancomycin did not differ in thickness from control biofilms (Fig. 3A). Moreover, WGA fluorescence was concentrated mainly in highly fluorescent aggregates at the biofilm-liquid interface in both control and sub-MIC-vancomycin-treated biofilms (Fig. 3B). There was no significant difference in the depth of WGA fluorescence between control (19 ± 0.9 μm) and sub-MIC-vancomycin-treated (20 ± 0.9 μm) biofilms (P > 0.05) (Fig. 3C), showing that the relative abundance of PIA in S. epidermidis biofilms is the same in control and sub-MIC-vancomycin-treated biofilms.
FIG 3.
Treatment with sub-MIC vancomycin does not affect the amount of PIA in biofilms. Representative micrographs of 72-h control and sub-MIC-vancomycin-treated S. epidermidis biofilms. Biofilms treated with sub-MIC vancomycin were grown in 2 μg/ml of vancomycin for the last 24 h of the total 72-h growth period. (A) Biofilm biomass of control and sub-MIC-vancomycin-treated biofilms as visualized by autofluorescence. (B) Aggregates of PIA in control and sub-MIC-vancomycin-treated biofilms as visualized by WGA fluorescence. Scale bar = 25 μm. (C) Average depth of autofluorescence and WGA fluorescence in control and sub-MIC-vancomycin-treated S. epidermidis biofilms. Error bars, standard errors of the mean (n = 30 from 10 images from each of three replicate biofilms).
Biofilms treated with sub-MIC vancomycin contain a greater abundance of eDNA.
Work from Kaplan and colleagues suggests that S. epidermidis biofilms treated with sub-MIC vancomycin contain more eDNA than untreated controls (23). To determine if biofilms exposed to sub-MIC vancomycin contained a greater amount of eDNA, we used a combination of enzymatic and absorbance methods.
A DNase enzyme assay provided a means of assessing eDNA concentration within biofilms and was based on the rate of DNase I removal of control and sub-MIC-vancomycin-treated biofilms. We confirm that during our experiments, DNase I was active, because OD600 of biofilms exposed to DNase I decreased during the course of the experiment, indicating the removal of biomass from the well. Alternatively, OD600 of biofilms exposed to PBS (used as a control treatment for the enzyme) remained fairly stable (see Fig. S4 in the supplemental material). In addition, using a skimmed milk casein assay, we showed that DNase I was protease free (see Text S1 and Fig. S5 in the supplemental material), suggesting that the biofilm removal observed in our experiments was due to the activity of DNase I alone.
Compared to control biofilms, the rate of DNase I activity in sub-MIC-vancomycin-treated biofilms was 17% higher (Fig. 4A), increasing from 0.0007 AU min−1 (±3.7 × 10⁻⁵ SE) (control) to 0.0009 AU min−1 (±2.7 × 10⁻⁵ SE), a statistically significant increase (P < 0.05). Similarly, quantification of extracted eDNA showed that in comparison to control biofilms, sub-MIC-vancomycin-treated biofilms contained a significantly greater concentration of eDNA than control biofilms (P < 0.05) (Fig. 4B).
FIG 4.
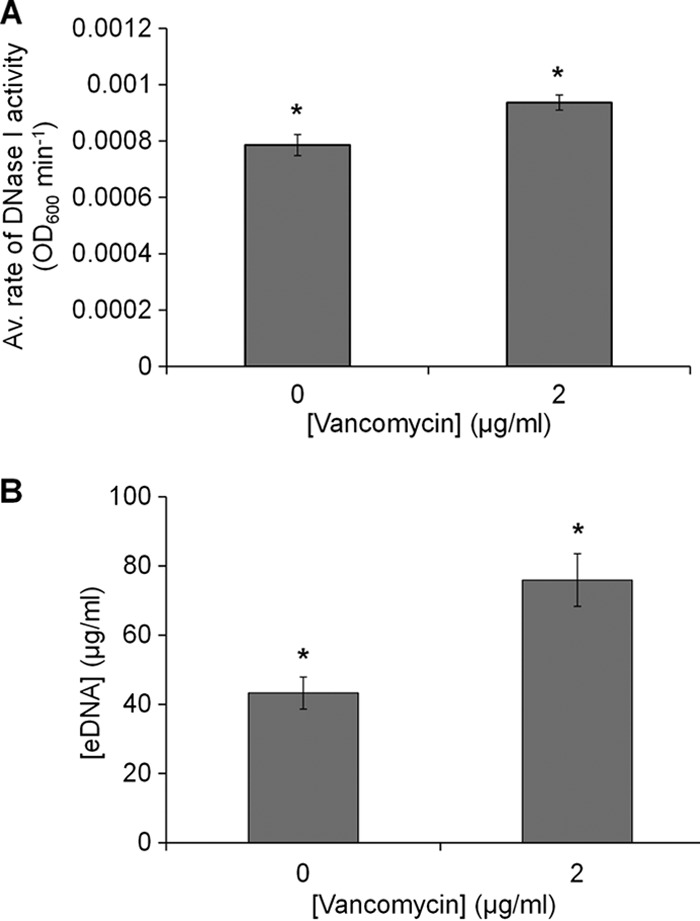
Biofilms treated with sub-MIC vancomycin contain more eDNA than control biofilms. (A) Average rate of activity (OD600 min−1) over 180 min for a 100-μg/ml DNase treatment to control and sub-MIC-vancomycin-treated S. epidermidis biofilms. The rate of DNase I activity was calculated as a change in OD600 over a change in time. (B) Concentration of eDNA extracted from control and sub-MIC-vancomycin-treated biofilms. Error bars, standard errors of the mean, n = 3. Asterisks indicate statistically significant difference (P < 0.05) as determined by the Student t test.
Higher vancomycin concentrations stimulate eDNA production in the biofilm matrix.
To determine if higher concentrations of vancomycin could stimulate a greater production of eDNA within the biofilm matrix, we used DAPI to stain eDNA within control biofilms and biofilms pretreated with a range of vancomycin concentrations. We showed that the low-intensity diffuse DAPI fluorescence was due to eDNA and established a threshold that enabled the quantification of this fluorescence (see Materials and Methods).
DAPI fluorescence of eDNA and cytoplasmic dead-cell DNA in biofilms preexposed to various vancomycin concentrations is shown in Fig. 5A. In general, there is an increasing trend in eDNA fluorescence intensity with increasing vancomycin concentration (Fig. 5B), suggesting that biofilms exposed to 8 μg/ml vancomycin contain a greater amount of eDNA than those not exposed to vancomycin. We normalized these data to account for the number of pixels that exhibited fluorescence at the average intensity for each vancomycin concentration (see Materials and Methods).
FIG 5.
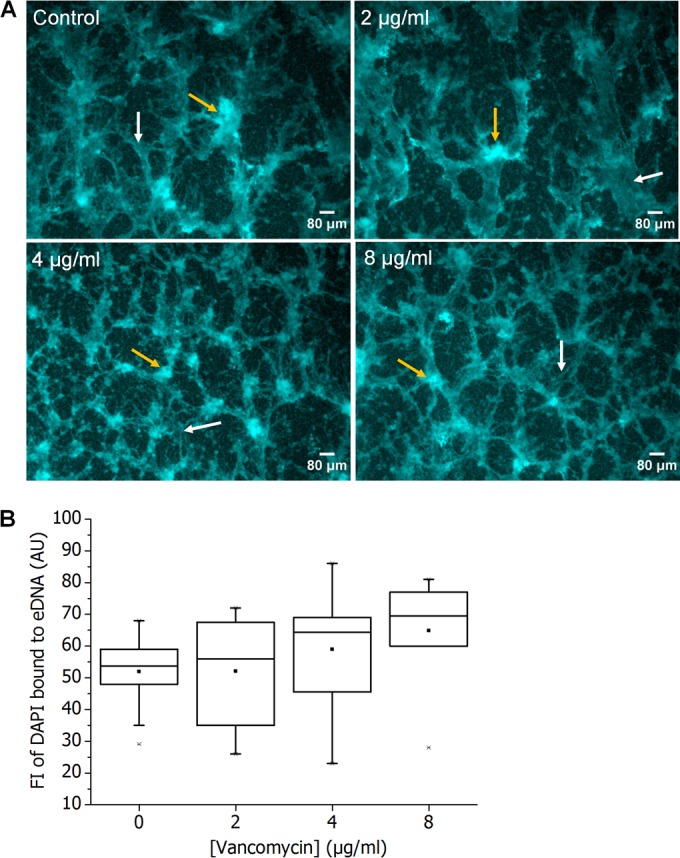
Vancomycin treatment increases the amount of eDNA in biofilms. (A) Representative micrographs of 48-h control and 48-h S. epidermidis biofilms preexposed to various concentrations of vancomycin, showing low fluorescence intensity due to DAPI-bound eDNA (white arrows) and high fluorescence intensity due to DAPI staining of dead-cell cytoplasmic DNA (yellow arrows). Scale bar = 80 μm. (B) Fluorescence intensity of DAPI-bound eDNA shown as a function of vancomycin concentration used to pretreat S. epidermidis biofilms. Box and whiskers, minimum and maximum fluorescence intensity for DAPI-bound eDNA fluorescence. The horizontal line across the box is the median fluorescence intensity of eDNA fluorescence at each vancomycin concentration. The solid squares are average fluorescence intensities recorded for DAPI-bound eDNA fluorescence.
Biofilms treated with vancomycin exhibited a significant increase in the average fluorescence intensity per pixel (analysis of variance [ANOVA] P = 0.001) of eDNA fluorescence, with the highest value of 0.43 ± 0.05 (SE) occurring at 8 μg/ml (Fig. 6). Furthermore, the results showed that fluorescence intensity of eDNA per pixel was directly proportional to vancomycin concentration (R2 = 0.9556) used to pretreat the biofilm.
FIG 6.
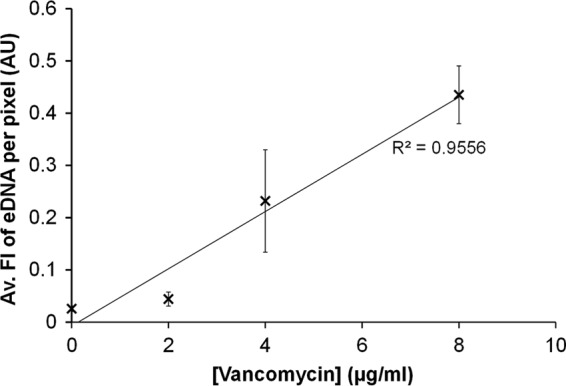
The abundance of eDNA in S. epidermidis biofilms was directly proportional to vancomycin concentration. Average DAPI fluorescence intensity per pixel of eDNA in S. epidermidis biofilms, as a function of the vancomycin pretreatment concentration. Error bars, standard errors of the mean; n = 16.
Exogenous DNA reduces the antimicrobial activity of vancomycin.
Our results show that the penetration of BODIPY FL-vancomycin is retarded in biofilms treated with sub-MIC vancomycin and that vancomycin stimulates the production of eDNA within the S. epidermidis biofilm matrix. So in order to determine whether eDNA can block the penetration of vancomycin through a direct interaction with the antibiotic, we incubated exogenous extracted S. epidermidis DNA with vancomycin for 30 min and compared its effect on planktonic S. epidermidis cell growth to that of vancomycin or DNA alone.
In agreement with previous studies (38), exogenous DNA alone reduced the growth of S. epidermidis at both of the tested concentrations (Fig. 7). However, the addition of 16 μg/ml of exogenous DNA to 2 μg/ml of vancomycin significantly affected the 24-h OD600 of S. epidermidis compared to that for just vancomycin alone (P = 0.005) or 16 μg/ml of DNA alone (P = 0.002) (Fig. 7). Preincubating vancomycin with exogenous DNA reduced the ability of both vancomycin and DNA to inhibit S. epidermidis cell growth. The 24-h OD600 of S. epidermidis treated with the DNA and vancomycin mixture (16 μg/ml DNA and 4 μg/ml vancomycin) was 0.690 (±0.019 SE) but only 0.0421 (±0.0013 SE) when grown in 4 μg/ml of vancomycin alone (previously established MIC). Preincubation of 4 μg/ml vancomycin with DNA caused a significant increase in growth of planktonic S. epidermidis (P < 0.05) and an increase in vancomycin MIC. Similarly, the 24-h OD of planktonic S. epidermidis at 4 μg/ml vancomycin in the presence of salmon sperm DNA was at 60% of that of the control DNA-free culture (see Fig. S6 in the supplemental material); thus, salmon sperm DNA also increased vancomycin MIC. These results suggest that the inhibitory effects on vancomycin did not arise from any contaminants accumulated during the DNA extraction process. Consequently, we hypothesized that DNA and vancomycin undergo a chemical interaction that blocks the antimicrobial activity of each.
FIG 7.
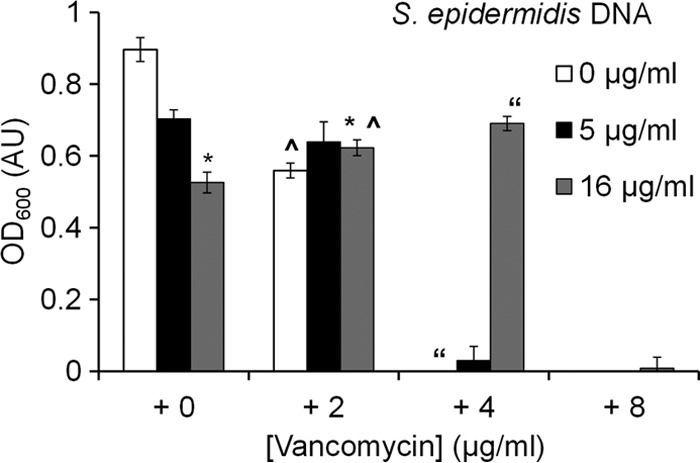
Exogenous S. epidermidis DNA interferes with vancomycin activity. Average 24-h OD600 of S. epidermidis planktonic culture exposed to exogenous S. epidermidis DNA alone, vancomycin alone, and a mixture of exogenous S. epidermidis DNA and vancomycin. Error bars, standard errors of the mean; n = 10. Statistically significant results (P < 0.05) between samples are indicated by identical symbols.
Exogenous DNA protects biofilm cells from vancomycin.
Our results show that DNA can protect planktonic cells from vancomycin. To test whether exogenously added DNA could protect biofilm cells, S. epidermidis biofilms were exposed to an MBC level of vancomycin with and without the presence of exogenous DNA. In agreement with results obtained from planktonic cultures, data from biofilm plate counts showed that exogenous DNA alone reduced the growth of S. epidermidis cells in the biofilm by up to 35%, while vancomycin alone caused a 62% reduction in the number of biofilm cells (Fig. 8). Interestingly, preincubation of the same vancomycin concentration with DNA significantly reduced the antimicrobial effects of vancomycin on biofilm cells (P = 0.0007), causing only a 21% reduction in the number of biofilm cells compared to the 62% observed for vancomycin alone within the same time frame. Furthermore, no statistical differences were observed in the number of cells remaining between control, untreated biofilms and those treated with the DNA-vancomycin solution (P = 0.163).
FIG 8.
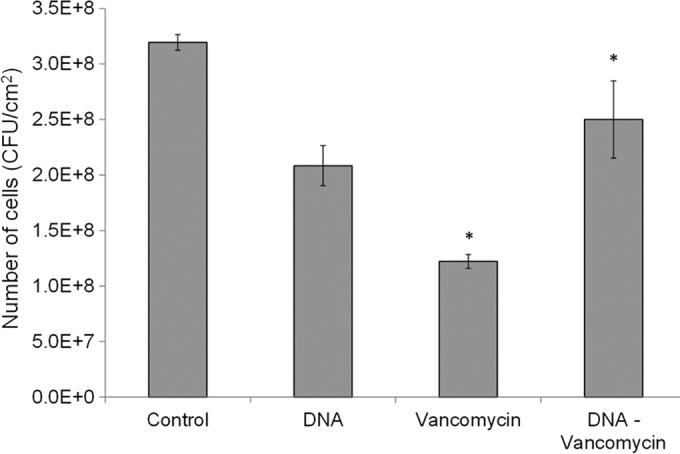
Exogenous S. epidermidis DNA protects biofilm cells from vancomycin. Number of cells obtained from 72-h S. epidermidis biofilms treated with 2 mg/ml vancomycin, 16 μg/ml of exogenous S. epidermidis DNA, and a solution of DNA and vancomycin (at the same concentrations) preincubated prior to addition to the biofilm. All biofilms were exposed to the treatments for 2 h. Control biofilms were exposed to PBS treatment. Error bars, standard errors of the mean; n = 4. Asterisk indicates statistically significant results (P < 0.05) between the two marked samples as determined by the Student t test.
DNA and vancomycin binding.
Our results suggest that vancomycin directly interacts with DNA. To quantify this interaction, we used ITC to obtain thermodynamic binding parameters with pure DNA and vancomycin (Fig. 9). These parameters indicate a relatively high-affinity constant (Ka) of 1.9 × 10⁷ M−1, suggesting strong binding between vancomycin and DNA. In addition, the results showed that the reaction between vancomycin and DNA is spontaneous, as indicated by the Gibbs free-energy value (ΔG); thus, the binding of vancomycin and DNA is a thermodynamically favorable reaction that does not require external energy for initiation.
FIG 9.
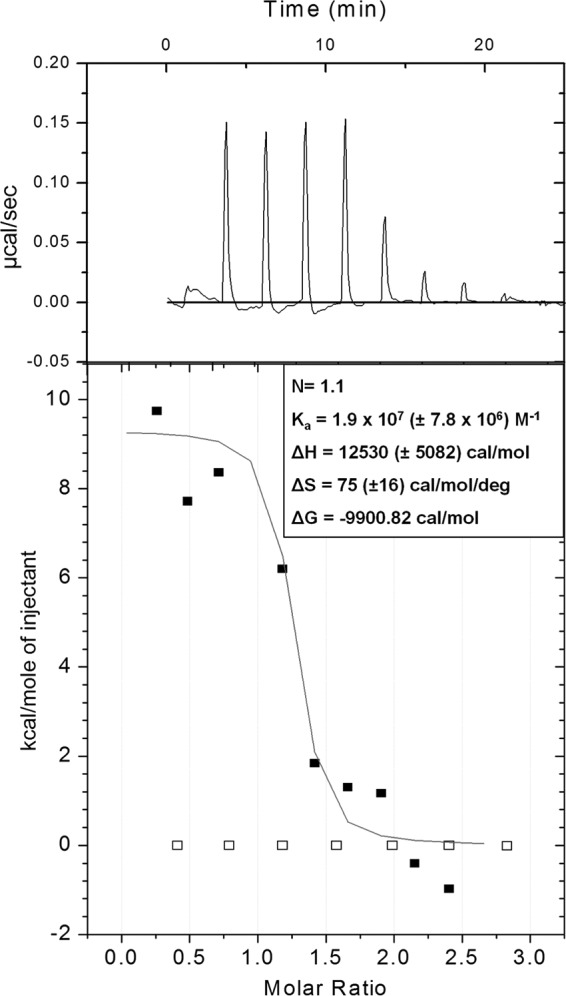
DNA binds vancomycin. Representative summary of the ITC experiments used to determine the thermodynamic binding parameters for salmon sperm DNA and vancomycin. Top, raw ITC data from the titration of 0.075 mM vancomycin into 0.005 mM salmon sperm DNA; bottom, integrated titration data for vancomycin and DNA as fitted to the “one-site binding model” of Origin 7.0 (black squares) and integrated titration data for vancomycin and water control (white squares). The thermodynamic parameters represent an average and standard deviation from three independent experiments.
DISCUSSION
Previous studies have shown that preexposure of staphylococcal biofilms to antibiotics at sub-MICs can induce biofilm formation (2) and enhance antibiotic tolerance (5, 28). In addition, the work of Kaplan and colleagues suggests that the same strain of S. epidermidis as used in the present study produced an eDNA-enriched biofilm matrix upon exposure to sub-MIC vancomycin (23). Therefore, we investigated if the altered matrix composition of sub-MIC-vancomycin-treated S. epidermidis ATCC 35984 biofilms could affect the penetration of vancomycin. We used confocal microscopy and a fluorescent vancomycin derivative (BODIPY FL-vancomycin) for transport studies (39, 40) to show that the transport of BODIPY FL-vancomycin is significantly inhibited in sub-MIC-vancomycin-treated S. epidermidis biofilms. Moreover, a correlation between the inhibition of vancomycin transport and an increase in eDNA concentration within the biofilm matrix of sub-MIC-vancomycin-treated biofilms was observed. Our results also showed that DNA binds vancomycin; therefore, we conclude that the increased eDNA concentration in the matrix of sub-MIC-vancomycin-treated S. epidermidis biofilms impedes the transport of vancomycin through binding.
In agreement with the work of Daddi Oubekka and colleagues (40), our results show that in control, antibiotic-free biofilms, BODIPY FL-vancomycin reached a biofilm depth of approximately 30 μm within 30 min. In biofilms treated with sub-MIC vancomycin, however, BODIPY FL-vancomycin reached a depth of only 20 μm in 30 min (Fig. 2). Since we observed no significant variations in biofilm thickness between control and sub-MIC-vancomycin-treated biofilms (Fig. 2C and 3C) in six sets of independent biofilm samples and two different staining protocols, the difference in vancomycin penetration was not simply due to a difference in physical depth of the biofilm. While our results showed an average biomass thickness of only 6 μm, which was not accessed by BODIPY FL-vancomycin in sub-MIC-vancomycin-treated biofilms, this difference may be clinically significant. Although this is only a small proportion of the entire biofilm, a monolayer S. epidermidis ATCC 35984 biofilm grown on a 96-well plate can contain up to 107 CFU/ml of cells (41). Therefore, it is possible that thin layers or small protected pockets in the biofilm might be enough to allow regrowth once the surrounding antibiotic drops to below therapeutic levels.
Previous studies have shown a negative correlation between the amount of biofilm biomass induced by sub-MIC vancomycin and the natural biofilm-forming ability of the strain (23). Since S. epidermidis is a good biofilm former (31), the amount of biofilm induced by sub-MIC vancomycin can be limited. Thus, we considered possible changes in the composition of the biofilm matrix upon treatment with sub-MIC vancomycin. Our results showed that treatment with sub-MIC vancomycin stimulated a greater production of eDNA but had no effect on the relative abundance of PIA within S. epidermidis biofilms (Fig. 3 and 4). Our results, therefore, suggest that eDNA and not PIA is responsible for the decreased penetration of vancomycin in sub-MIC-vancomycin-treated biofilms. Although similar results have been found regarding the role of PIA on BODIPY FL-vancomycin transport through biofilms in S. aureus ica mutants (39), we needed to account for the role of PIA in our experiments given the variation in bacterial species and antibiotic concentrations.
Furthermore, we showed that DNA reduced the potency of vancomycin (Fig. 7), supporting the idea that DNA directly interferes in the ability of vancomycin to travel through sub-MIC-vancomycin-treated biofilms. Similar conclusions were drawn by Daddi Oubekka and colleagues, who observed interactions of vancomycin with eDNA-rich regions of an S. aureus biofilm (40). Furthermore, since vancomycin is a largely positive molecule and DNA can act as a powerful ion chelator (38), we decided to test whether DNA directly interacts with vancomycin.
ITC results confirm that, in addition to the ability to bind, DNA and vancomycin binding is thermodynamically favorable. Furthermore, the results showed a high-affinity constant (Ka) with a representative value of 1.9 × 10⁷ M−1 (Fig. 9). Previously reported affinity constants for the binding of vancomycin to the d-Ala-d-Ala peptide, the intended substrate of vancomycin within the bacterial cell wall, were in the region of 7.3 × 10⁵ M−1 (42, 43), suggesting that the binding affinity of vancomycin for eDNA is up to 100-fold higher than the intended cellular substrate of vancomycin. Collectively, these findings suggest that within the biofilm environment, vancomycin may compete with eDNA and the cell-based d-Ala-d-Ala peptide, since the affinity of vancomycin for eDNA is stronger so that vancomycin may struggle to reach biofilm cells.
In conclusion, our data show that sub-MIC vancomycin exposure increases the abundance of eDNA in the biofilm and reduces the average depth of vancomycin penetration by 6 μm (19% of the biofilm) in a 30-min time period. In addition, we show that DNA and vancomycin exhibit thermodynamically favorable binding and that exogenous DNA can reduce the potency of vancomycin in a planktonic culture of S. epidermidis, also within a 30-min time period. Taken together, these data suggest that sub-MIC vancomycin increases biofilm tolerance to subsequent vancomycin attack by increasing eDNA production, which in turn reduces the penetration of vancomycin, because negatively charged DNA binds to and interacts with positively charged vancomycin.
Supplementary Material
ACKNOWLEDGMENTS
We thank David Johnston at the Biomedical Imaging Unit, Southampton General Hospital, for the use of the fluorescence microscope and Jeremy S. Webb and Caroline Duignan, Centre for Biological Sciences, University of Southampton, United Kingdom, for the use of the NanoDrop.
This work was supported by funding from the University of Southampton, the University of Washington, the Cystic Fibrosis Foundation, Queen's University, Belfast, and a grant from the World Wide Universities Network (WUN).
Footnotes
Published ahead of print 29 September 2014
Supplemental material for this article may be found at http://dx.doi.org/10.1128/AAC.03132-14.
REFERENCES
- 1.Fey PD. 2010. Modality of bacterial growth presents unique targets: how do we treat biofilm-mediated infections? Curr. Opin. Microbiol. 13:610–615. 10.1016/j.mib.2010.09.007. [DOI] [PMC free article] [PubMed] [Google Scholar]
- 2.Cargill JS, Upton M. 2009. Low concentrations of vancomycin stimulate biofilm formation in some clinical isolates of Staphylococcus epidermidis. J. Clin. Pathol. 62:1112–1116. 10.1136/jcp.2009.069021. [DOI] [PubMed] [Google Scholar]
- 3.Haddadin RNS, Saleh S, Al-Adham ISI, Buultjens TEJ, Collier PJ. 2010. The effect of subminimal inhibitory concentrations of antibiotics on virulence factors expressed by Staphylococcus aureus biofilms. J. Appl. Microbiol. 108:1281–1291. 10.1111/j.1365-2672.2009.04529.x. [DOI] [PubMed] [Google Scholar]
- 4.Wang Q, Sun F-J, Liu Y, Xiong L-R, Xie L-L, Xia P-Y. 2010. Enhancement of biofilm formation by subinhibitory concentrations of macrolides in icaADBC-positive and -negative clinical isolates of Staphylococcus epidermidis. Antimicrob. Agents Chemother. 54:2707–2711. 10.1128/AAC.01565-09. [DOI] [PMC free article] [PubMed] [Google Scholar]
- 5.Cerca N, Martins S, Sillankorva S, Jefferson KK, Pier GB, Oliveira R, Azeredo J. 2005. Effects of growth in the presence of subinhibitory concentrations of dicloxacillin on Staphylococcus epidermidis and Staphylococcus haemolyticus biofilms. Appl. Environ. Microbiol. 71:8677–8682. 10.1128/AEM.71.12.8677-8682.2005. [DOI] [PMC free article] [PubMed] [Google Scholar]
- 6.Sun H, Maderazo EG, Krusell AR. 1993. Serum protein-binding characteristics of vancomycin. Antimicrob. Agents Chemother. 37:1132–1136. 10.1128/AAC.37.5.1132. [DOI] [PMC free article] [PubMed] [Google Scholar]
- 7.Stewart PS, Costerton JW. 2001. Antibiotic resistance of bacteria in biofilms. Lancet 358:135–138. 10.1016/S0140-6736(01)05321-1. [DOI] [PubMed] [Google Scholar]
- 8.Anderl JN, Zahller J, Roe F, Stewart PS. 2003. Role of nutrient limitation and stationary-phase existence in Klebsiella pneumoniae biofilm resistance to ampicillin and ciprofloxacin. Antimicrob. Agents Chemother. 47:1251–1256. 10.1128/AAC.47.4.1251-1256.2003. [DOI] [PMC free article] [PubMed] [Google Scholar]
- 9.Tseng BS, Zhang W, Harrison JJ, Quach TP, Song JL, Penterman J, Singh PK, Chopp DL, Packman AI, Parsek MR. 2013. The extracellular matrix protects Pseudomonas aeruginosa biofilms by limiting the penetration of tobramycin. Environ. Microbiol. 10:2865–2878. 10.1111/1462-2920.12155. [DOI] [PMC free article] [PubMed] [Google Scholar]
- 10.Dunne WM, Mason EO, Kaplan SL. 1993. Diffusion of rifampin and vancomycin through a Staphylococcus epidermidis biofilm. Antimicrob. Agents Chemother. 37:2522–2526. 10.1128/AAC.37.12.2522. [DOI] [PMC free article] [PubMed] [Google Scholar]
- 11.Zheng Z, Stewart PS. 2002. Penetration of rifampin through Staphylococcus epidermidis biofilms. Antimicrob. Agents Chemother. 46:900–903. 10.1128/AAC.46.3.900-903.2002. [DOI] [PMC free article] [PubMed] [Google Scholar]
- 12.Beer D De, Stoodley P, Lewandowski Z. 1996. Liquid flow and mass transport in heterogeneous biofilms. Water Res. 30:2761–2765. 10.1016/S0043-1354(96)00141-8. [DOI] [Google Scholar]
- 13.Stewart PS. 2003. Guest commentaries: diffusion in biofilms. J. Bacteriol. 185:1485–1491. 10.1128/JB.185.5.1485-1491.2003. [DOI] [PMC free article] [PubMed] [Google Scholar]
- 14.Nichols W, WDorrington SM, Slack MPE, Walmsley HL. 1988. Inhibition of tobramycin diffusion by binding to alginate. Antimicrob. Agents Chemother. 32:518–523. 10.1128/AAC.32.4.518. [DOI] [PMC free article] [PubMed] [Google Scholar]
- 15.Billings N, Ramirez Millan M, Caldara M, Rusconi R, Tarasova Y, Stocker R, Ribbeck K. 2013. The extracellular matrix component Psl provides fast-acting antibiotic defense in Pseudomonas aeruginosa biofilms. PLoS Pathog. 9:e1003526. 10.1371/journal.ppat.1003526. [DOI] [PMC free article] [PubMed] [Google Scholar]
- 16.Rohde H, Frankenberger S, Zähringer U, Mack D. 2010. Structure, function and contribution of polysaccharide intercellular adhesin (PIA) to Staphylococcus epidermidis biofilm formation and pathogenesis of biomaterial-associated infections. Eur. J. Cell Biol. 89:103–111. 10.1016/j.ejcb.2009.10.005. [DOI] [PubMed] [Google Scholar]
- 17.Conlon KM, Humphreys H, O'Gara JP. 2002. icaR encodes a transcriptional repressor involved in environmental regulation of ica operon expression and biofilm formation in Staphylococcus epidermidis. J. Bacteriol. 184:4400–4408. 10.1128/JB.184.16.4400-4408.2002. [DOI] [PMC free article] [PubMed] [Google Scholar]
- 18.Izano EA, Amarante MA, Kher WB, Kaplan JB. 2008. Differential roles of poly-N-acetylglucosamine surface polysaccharide and extracellular DNA in Staphylococcus aureus and Staphylococcus epidermidis biofilms. Appl. Environ. Microbiol. 74:470–476. 10.1128/AEM.02073-07. [DOI] [PMC free article] [PubMed] [Google Scholar]
- 19.Christner M, Heinze C, Busch M, Franke G, Hentschke M, Bayard Dühring S, Büttner H, Kotasinska M, Wischnewski V, Kroll G, Buck F, Molin S, Otto M, Rohde H. 2012. sarA negatively regulates Staphylococcus epidermidis biofilm formation by modulating expression of 1 MDa extracellular matrix binding protein and autolysis-dependent release of eDNA. Mol. Microbiol. 86:394–410. 10.1111/j.1365-2958.2012.08203.x. [DOI] [PubMed] [Google Scholar]
- 20.Qin Z, Ou Y, Yang L, Zhu Y, Tolker-Nielsen T, Molin S, Qu D. 2007. Role of autolysin-mediated DNA release in biofilm formation of Staphylococcus epidermidis. Microbiology 153:2083–2092. 10.1099/mic.0.2007/006031-0. [DOI] [PubMed] [Google Scholar]
- 21.Böckelmann U, Janke A, Kuhn R, Neu TR, Wecke J, Lawrence JR, Szewzyk U. 2006. Bacterial extracellular DNA forming a defined network-like structure. FEMS Microbiol. Lett. 262:31–38. 10.1111/j.1574-6968.2006.00361.x. [DOI] [PubMed] [Google Scholar]
- 22.Goodman SD, Obergfell KP, Jurcisek JA, Novotny LA, Downey JS, Ayala EA, Tjokro N, Li B, Justice SS, Bakaletz LO. 2011. Biofilms can be dispersed by focusing the immune system on a common family of bacterial nucleoid-associated proteins. Mucosal Immunol. 4:625–637. 10.1038/mi.2011.27. [DOI] [PubMed] [Google Scholar]
- 23.Kaplan JB, Jabbouri S, Sadovskaya I. 2011. Extracellular DNA-dependent biofilm formation by Staphylococcus epidermidis RP62A in response to subminimal inhibitory concentrations of antibiotics. Res. Microbiol. 162:535–541. 10.1016/j.resmic.2011.03.008. [DOI] [PMC free article] [PubMed] [Google Scholar]
- 24.Allesen-Holm M, Barken KB, Yang L, Klausen M, Webb JS, Kjelleberg S, Molin S, Givskov M, Tolker-Nielsen T. 2006. A characterization of DNA release in Pseudomonas aeruginosa cultures and biofilms. Mol. Microbiol. 59:1114–1128. 10.1111/j.1365-2958.2005.05008.x. [DOI] [PubMed] [Google Scholar]
- 25.Jakubovics NS, Shields RC, Rajarajan N, Burgess JG. 2013. Life after death: the critical role of extracellular DNA in microbial biofilms. Lett. Appl. Microbiol. 57:467–475. 10.1111/lam.12134. [DOI] [PubMed] [Google Scholar]
- 26.Arciola CR, Campoccia D, Speziale P, Montanaro L, Costerton JW. 2012. Biofilm formation in Staphylococcus implant infections. A review of molecular mechanisms and implications for biofilm-resistant materials. Biomaterials 33:5967–5982. 10.1016/j.biomaterials.2012.05.031. [DOI] [PubMed] [Google Scholar]
- 27.Okshevsky M, Meyer RL. 2013. The role of extracellular DNA in the establishment, maintenance and perpetuation of bacterial biofilms. Crit. Rev. Microbiol. 7828:1–11. 10.3109/1040841X.2013.841639. [DOI] [PubMed] [Google Scholar]
- 28.Kaplan JB, Izano EA, Gopal P, Karwacki MT, Kim S, Bose JL, Bayles KW, Horswill AR. 2012. Low levels of β-lactam antibiotics induce extracellular DNA release and biofilm formation in Staphylococcus aureus. mBio 3(4):e00198–12. 10.1128/mBio.00198-12. [DOI] [PMC free article] [PubMed] [Google Scholar]
- 29.Flemming H-C, Wingender J. 2010. The biofilm matrix. Nat. Rev. Microbiol. 8:623–633. 10.1038/nrmicro2415. [DOI] [PubMed] [Google Scholar]
- 30.Chiang W-C, Nilsson M, Jensen PØ Høiby N, Nielsen TE, Givskov M, Tolker-Nielsen T. 2013. Extracellular DNA shields against aminoglycosides in Pseudomonas aeruginosa biofilms. Antimicrob. Agents Chemother. 57:2352–2361. 10.1128/AAC.00001-13. [DOI] [PMC free article] [PubMed] [Google Scholar]
- 31.Dice B, Stoodley P, Buchinsky F, Metha N, Ehrlich GD, Hu FZ. 2009. Biofilm formation by ica-positive and ica-negative strains of Staphylococcus epidermidis in vitro. Biofouling 25:367–375. 10.1080/08927010902803297. [DOI] [PubMed] [Google Scholar]
- 32.Schneider CA, Rasband WS, Eliceiri KW. 2012. NIH Image to ImageJ: 25 years of image analysis. Nat. Meth. 9:671–675. 10.1038/nmeth.2089. [DOI] [PMC free article] [PubMed] [Google Scholar]
- 33.Price NC, Stevens L. 1999. Fundamentals of enzymology: the cell and molecular biology of catalytic proteins. Oxford University Press, Oxford, United Kingdom. [Google Scholar]
- 34.Rice KC, Mann EE, Endres JL, Weiss EC, Cassat JE, Smeltzer MS, Bayles KW. 2007. The cidA murein hydrolase regulator contributes to DNA release and biofilm development in Staphylococcus aureus. Proc. Natl. Acad. Sci. U. S. A. 104:8113–8118. 10.1073/pnas.0610226104. [DOI] [PMC free article] [PubMed] [Google Scholar]
- 35.Conover MS, Mishra M, Deora R. 2011. Extracellular DNA is essential for maintaining Bordetella biofilm integrity on abiotic surfaces and in the upper respiratory tract of mice. PLoS One 6:e16861. 10.1371/journal.pone.0016861. [DOI] [PMC free article] [PubMed] [Google Scholar]
- 36.Steichen CT, Cho C, Shao JQ, Apicella MA. 2011. The Neisseria gonorrhoeae biofilm matrix contains DNA, and an endogenous nuclease controls its incorporation. Infect. Immun. 79:1504–1511. 10.1128/IAI.01162-10. [DOI] [PMC free article] [PubMed] [Google Scholar]
- 37.Dominiak DM, Nielsen JL, Nielsen PH. 2011. Extracellular DNA is abundant and important for microcolony strength in mixed microbial biofilms. Environ. Microbiol. 13:710–721. 10.1111/j.1462-2920.2010.02375.x. [DOI] [PubMed] [Google Scholar]
- 38.Mulcahy H, Charron-Mazenod L, Lewenza S. 2008. Extracellular DNA chelates cations and induces antibiotic resistance in Pseudomonas aeruginosa biofilms. PLoS Pathog. 4:e1000213. 10.1371/journal.ppat.1000213. [DOI] [PMC free article] [PubMed] [Google Scholar]
- 39.Jefferson KK, Goldmann DA, Pier GB. 2005. Use of confocal microscopy to analyze the rate of vancomycin penetration through Staphylococcus aureus biofilms. Antimicrob. Agents Chemother. 49:2467–2473. 10.1128/AAC.49.6.2467-2473.2005. [DOI] [PMC free article] [PubMed] [Google Scholar]
- 40.Daddi Oubekka S, Briandet R, Fontaine-Aupart M-P, Steenkeste K. 2012. Correlative time-resolved fluorescence microscopy to assess antibiotic diffusion-reaction in biofilms. Antimicrob. Agents Chemother. 56:3349–3358. 10.1128/AAC.00216-12. [DOI] [PMC free article] [PubMed] [Google Scholar]
- 41.Qu Y, Daley AJ, Istivan TS, Rouch DA, Deighton MA. 2010. Densely adherent growth mode, rather than extracellular polymer substance matrix build-up ability, contributes to high resistance of Staphylococcus epidermidis biofilms to antibiotics. J. Antimicrob. Chemother. 65:1405–1411. 10.1093/jac/dkq119. [DOI] [PubMed] [Google Scholar]
- 42.Van de Kerk-van Hoof A, Heck AJ. 1999. Interactions of alpha- and beta-avoparcin with bacterial cell-wall receptor-mimicking peptides studied by electrospray ionization mass spectrometry. J. Antimicrob. Chemother. 44:593–599. 10.1093/jac/44.5.593. [DOI] [PubMed] [Google Scholar]
- 43.Lim H-K, Hsieh YL, Ganem B, Henion J. 1995. Recognition of cell-wall peptide ligands by vancomycin group antibiotics: studies using ion spray mass spectrometry. J. Mass Spectrom. 30:708–714. 10.1002/jms.1190300509. [DOI] [Google Scholar]
Associated Data
This section collects any data citations, data availability statements, or supplementary materials included in this article.


