

Abstract
Bacterial biosensor strains can be useful tools for the discovery and characterization of antibacterial compounds. A plasmid-based reporter vector containing a transcriptional fusion between the recA promoter and green fluorescence protein gene was introduced into an Escherichia coli ΔtolC strain to create a biosensor strain that selectively senses inhibitors of DNA metabolism via the SOS response. The strain was used to develop a high-throughput assay to identify new inhibitors of DNA metabolism. Screening of the AstraZeneca compound library with this strain identified known inhibitors of DNA metabolism, as well as novel chemotypes. The cellular target of one novel series was elucidated as DNA gyrase through genetic characterization of laboratory-generated resistant mutants followed by 50% inhibitory concentration measurements in a DNA gyrase activity assay. These studies validated the use of this antibiotic biosensor strain to identify novel selective inhibitors of DNA metabolism by high-throughput screening.
INTRODUCTION
Infections caused by multidrug-resistant bacteria pose a growing threat to human health (1, 2), and antibacterial agents that can overcome this growing medical problem are urgently needed (3, 4). Even though much energy has been devoted to identifying new antibacterial targets as a strategy to overcome resistance (5–7), DNA replication targets such as type II topoisomerases continue to be a fruitful strategy to discover novel antibiotics with selective antibacterial activity in a desired spectrum of organisms (8). Several distinct chemotypes with different modes of inhibition that suppress bacterial growth through inhibition of DNA replication have been described (9–16).
To further exploit DNA metabolism as a target to identify novel antibacterials, cell-based reporter assays or bacterial biosensors can be utilized. Bacterial biosensors have been employed to detect genotoxins, environmental pollutants, and antibacterials (17–21). Using this approach, multiple targets can be screened simultaneously in the context of an intact cell, as opposed to focusing on a single target under optimized conditions, which is often the case with a target-based approach. In addition, compounds identified using a bacterial biosensor would also have properties that enable cell penetration, one of the major limitations that need to be overcome in target-based drug discovery (5, 6). Finally, targets for which a biochemical assay may not be feasible due to technical reasons can be interrogated using a bacterial biosensor assay.
The SOS response is a global response of bacteria to DNA damage, in which the normal cell cycle is halted and DNA repair mechanisms are induced (22). There are at least 40 genes involved in the SOS response pathway in Escherichia coli, and all are repressed by the LexA protein (23). RecA also plays a central role in the SOS response (24), where early in the cascade it senses the accumulation of single-stranded DNA and becomes activated. Once activated, RecA interacts with LexA to cause its autocleavage, thereby allowing expression of the SOS response genes to cope with DNA damage (25). By using the gene encoding green fluorescent protein (GFP) (26) as a reporter under the transcriptional control of an SOS-inducible promoter, compounds that interfere with DNA metabolism can be identified through the detection of increased fluorescence in a dose-dependent manner. Such an SOS reporter assay is predicted to identify inhibitors of DNA metabolism at sub-MICs by probing approximately 100 targets that are predicted to be essential for DNA metabolism in E. coli (27) (see Table S1 in the supplemental material).
The aim of this study was to develop a biosensor assay in E. coli that could be used for high-throughput screening (HTS) and screen the AstraZeneca compound library to identify novel inhibitors of DNA metabolism. While several instances of the use of this approach have been described, primarily for mode of action determination, none have been reduced to the practice of high-throughput antibacterial lead generation (17, 19, 28, 29).
MATERIALS AND METHODS
Strains.
Biosensor strains were created by transforming reporter plasmids into an E. coli K-12 MG1655 strain in which the tolC gene, a major component of multidrug efflux systems (30), had been deleted according to published procedures (31). The reporter plasmids contain a fast-folding GFP variant (32) transcriptionally fused to promoters of genes involved in DNA metabolism (Table 1). These reporter plasmids were described by Zaslaver et al. (33) and acquired through Open Biosystems (Thermo Scientific). The constructed strains were grown in M9 medium supplemented with 1.0% glucose, 0.5 μg/ml thiamine, 0.2% Casamino Acids, and 25 μg/ml kanamycin. This was the medium used for all the biosensor assay studies, with the exception that the final high-throughput screening assay used 0.1% Casamino Acids (minimal M9CA broth; Teknova).
TABLE 1.
Biosensor strains were constructed using fast-folding GFP transcriptionally fused to promoters of the genes listed
| Gene | Function |
|---|---|
| lexA | Transcriptional repressor for SOS response |
| recA | DNA strand exchange and recombination protein with protease and nuclease activity; involved in SOS response |
| recN | Protein used in recombination and DNA repair; involved in SOS response |
| sulA | Suppressor of lon; inhibitor of cell division and FtsZ ring formation upon DNA damage/inhibition; involved in SOS response |
| polB | DNA polymerase II and 3′ → 5′ exonuclease; involved in SOS response |
| dinB | DNA polymerase IV, devoid of proofreading, damage-inducible protein; involved in SOS response |
| umuD | DNA polymerase V (error prone); involved in SOS response |
| dinG | LexA-regulated (SOS) repair enzyme (2nd module); involved in SOS response |
| dinJ | Damage-inducible protein J; involved in SOS response |
| recX | Regulator; involved in SOS response |
| ruvA | Holliday junction helicase subunit A (1st module); involved in SOS response and recombination repair |
| uvrD | DNA-dependent ATPase I and helicase II (1st module); involved in excision repair |
| uvrC | UvrC with UvrAB is a DNA excision repair enzyme (1st module); involved in excision repair |
| gyrB | DNA gyrase, subunit B (type II topoisomerase) |
Stocks of biosensor strains were prepared from cells grown overnight in the assay medium, flash frozen with 5% glycerol, and stored at −80°C. On the day of the assay, frozen aliquots of the cell suspensions were thawed at 25°C and then kept on ice until the start of the assay.
E. coli strains W3110 (ATCC 27325) and W3110 ΔtolC::Tn10 and Haemophilus influenzae strains Rd KW20 (ATCC 51907) and Rd KW20 ΔacrB::cat were grown as previously described (15).
Susceptibility testing and killing kinetics.
MICs were determined according to CLSI guidelines (34), using 2-fold serial compound dilutions, in 96-well microtiter plates. Activity against the human lung carcinoma cell line A549 was measured as described previously (35).
Killing kinetics for E. coli MG1655 ΔtolC were performed using compounds at multiples of their MICs and were measured in 96-well plates using 100 μl of cell suspension (106 CFU) per well. The plates were covered with a gas-permeable seal (catalog number AB-0718; Thermo Scientific) and then incubated at 37°C with vigorous shaking. At different time points, a plate was removed, cells were diluted in 10-fold dilutions ranging from 10−1 to 10−5, and 7 μl of each dilution was spotted onto LB agar plates. The plates were incubated for 24 h at 37°C, colonies were counted, and the numbers of CFU/ml were plotted against time.
SOS response induction assay.
Thawed biosensor strains were diluted to an optical density at 600 nm (OD600) of 0.2 into assay medium, and 100 μl was added to the wells of 96-well, black-wall, clear flat-bottom plates (catalog number 655096; Greiner) containing 2 μl of serial 2-fold compound dilutions in dimethyl sulfoxide (DMSO). The plates were incubated at 37°C with shaking at 220 rpm. Fluorescence and optical density were measured sequentially every hour from time zero (baseline) to 7 h and then again at 24 h. Fluorescence was recorded as the number of relative fluorescence units (RFU) using excitation at 485 nm and emission at 535 nm, and growth was measured by determination of the OD492 on a Tecan Infinite M5 instrument (Tecan, Männedorf, Switzerland). Internal controls for background correction (assay medium with 2% DMSO) were included in each plate. Untreated cells in assay medium containing 2% DMSO were also included in each plate. All RFUs were normalized by cell density (OD492) values and expressed as the number of RFUs per OD unit and were then normalized to the value for the untreated sample to generate a fold induction value for each treatment time point. The minimal-effect concentration (MEC) was defined as the lowest compound concentration needed to achieve a greater than 2-fold increase in the number of RFUs relative to the number for the DMSO-treated control samples.
The 384-well assay format used for HTS.
Test compounds from the AstraZeneca compound collection were dissolved in DMSO to form stock solutions (10 mM) and acoustically dispensed using an Echo 555 instrument (Labcyte, Sunnyvale, CA) into 384-well, black high-binding plates (Greiner Bio One, Frickenhausen, Germany). Final compound and DMSO concentrations were 10 μM and 1% (vol/vol), respectively. Frozen stocks of the E. coli MG1655 ΔtolC recA-GFP biosensor strain were thawed and diluted to an OD600 of 0.2 with assay medium, and 30 μl/well was added to compound-containing plates. The plates were incubated at 37°C for 16 h before fluorescence was measured using a Pherastar plate reader (BMG Labtech, Ortenberg, Germany) with excitation at 485 nm and emission at 535 nm. Data analysis was performed using proprietary software, and compound activity was normalized to percent activity. The sample containing 1% DMSO was defined as having 0% activity, and the sample containing 0.25 μM norfloxacin in 1% DMSO was defined as having 100% activity.
Concentration-response (CR) screening.
Various volumes of compound stocks were acoustically dispensed to generate 7-point doubling dilution curves with a final highest concentration of 100 μM. Wells were backfilled with the required volume of DMSO to ensure a final concentration of 1% (vol/vol). The data were analyzed as single concentrations, using proprietary software and compound interference correction (36). As an approximation to fold induction, a baseline was created by applying a normalization to percent activity, where the signal for DMSO only was defined as the background. Compounds showing a >2-fold increase in the signal above the background signal (that with DMSO only) were considered active compounds.
Synthesis of compound A.
5-Bromo-2-methoxypyrimidine (0.264 g, 1.40 mmol), methyl-2-{(1R,4R)-4-[4-(4,4,5,5-tetramethyl-1,3,2-dioxaborolan-2-yl)phenyl]cyclohexyl}acetate (0.5 g, 1.40 mmol; available from Labstock), and sodium carbonate (1.744 ml, 3.49 mmol) as a 2 M aqueous solution were suspended in dimethylformamide (9.89 ml). N2 was bubbled through the solution for 1 min, after which Pd(dppf)Cl2 {[1,1′-bis(diphenylphosphino)ferrocene]dichloropalladium(II); 0.051 g, 0.07 mmol} was added and the tube was capped. The reaction mixture was heated to 80°C and stirred for 40 min. The reaction mixture was cooled to room temperature, diluted with water, and extracted with ethyl acetate (EtOAc). The EtOAc extract was washed with saturated NaCl (aqueous) solution, dried over MgSO4, filtered, and concentrated. Liquid chromatography-mass spectrometry (LC-MS) confirmed the presence of methyl 2-{(1R,4R)-4-[4-(2-methoxypyrimidin-5-yl)phenyl]cyclohexyl}acetate (0.400 g, 84%) in >90% purity [mass found = 341 (M + H+)].
At room temperature, methyl 2-{(1R,4R)-4-[4-(2-methoxypyrimidin-5-yl)phenyl]cyclohexyl}acetate (0.4 g, 1.18 mmol) was dissolved in tetrahydrofuran (11.75 ml). The solution was then treated with a 10% LiOH (aqueous) solution and stirred overnight at room temperature. The reaction mixture was diluted with water, EtOAc, 1 M HCl (aqueous). The layers were separated, and the aqueous layer was extracted with EtOAc. The organic layers were combined, washed with water, NaCl (saturated, aqueous), dried over Na2SO4, and concentrated. A brown solid was obtained. The brown solid was dissolved in dichloromethane (DCM) and purified on an Isco normal-phase column using 0 to 10% methanol in DCM. Relevant fractions were combined and concentrated, leaving an off-white solid. LC-MS/1H nuclear magnetic resonance (NMR) confirmed the presence of pure 2-{(1R,4R)-4-[4-(2-methoxypyrimidin-5-yl)phenyl]cyclohexyl}acetic acid (0.285 g, 74.3%), which was obtained as an off-white solid. 1H NMR (300 MHz, DMSO-d6) d ppm 1.01 to 1.20 (m, 2H) 1.50 (dd, 2H) 1.66 to 1.90 (m, 6H) 2.15 (d, 2H) 3.86 to 4.04 (m, 3H) 7.35 (m, 2H) 7.62 (m, 2H) 8.77 to 9.00 (m, 2H) 12.00 (s, 1H) [mass found = 327.2 (M + H+)]. The structures and characteristics of compound A and its analogs used in this study are shown in Table 2.
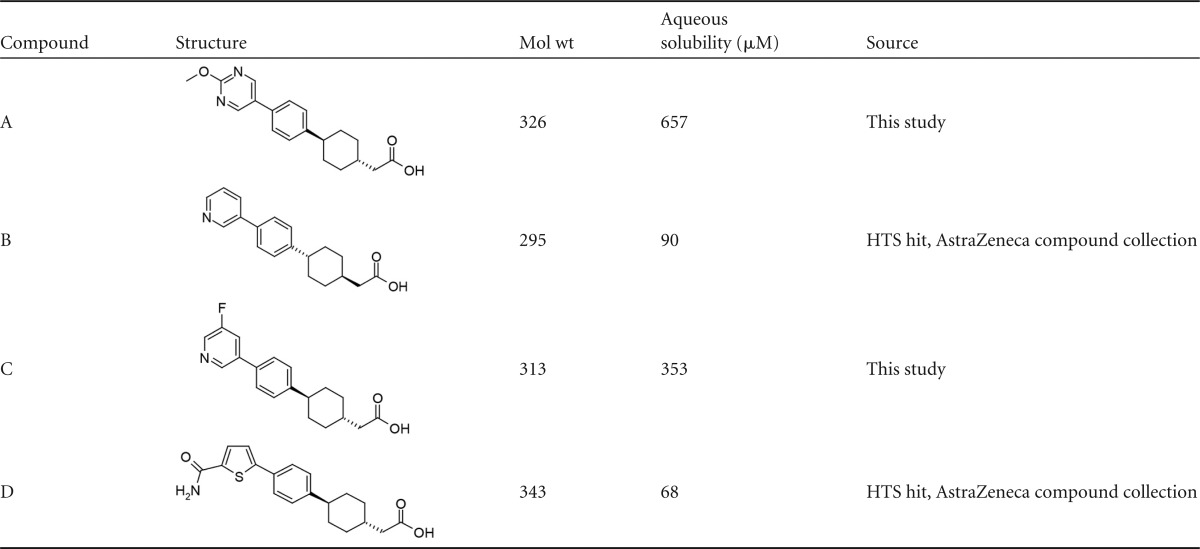
TABLE 2.
Structures of phenylcyclohexylacetic acids (compounds A to D) described in this study
Other compounds were obtained from Sigma-Aldrich (St. Louis, MO) or belong to the AstraZeneca compound collection (Tables 2 and 3).
TABLE 3.
Compounds 1 to 6 are analogs of previously published compounds that inhibit various targets in DNA metabolism
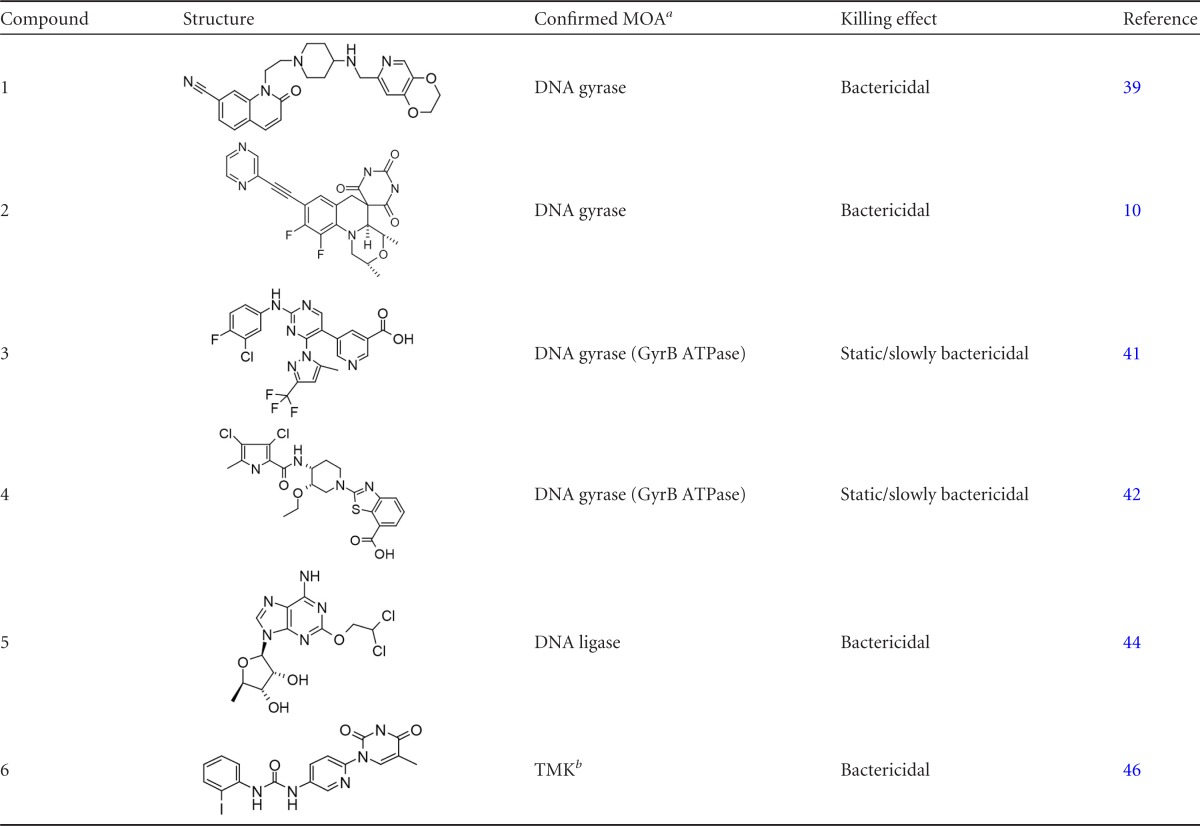
MOA, mode of action.
TMK, thymidylate kinase.
Inhibition of cellular processes.
Inhibition of DNA, RNA, protein, cell wall, and fatty acid biosynthesis was measured as described previously using an E. coli W3110 tolC gene deletion mutant (37).
Isolation of resistant mutants.
Compound A-resistant mutants of H. influenzae strain Rd KW20 ΔarcB (15) or E. coli MG1655 ΔtolC were isolated using compound-gradient LB plates (38). The plates were incubated at 37°C for 48 h or until isolated resistant colonies appeared. Individual colonies were picked and streaked onto non-compound-containing LB agar plates to ensure that resistance was stable before MICs were determined.
Whole-genome sequencing.
Isolates selected for whole-genome sequencing were plated onto blood agar (Remel) and incubated overnight at 37°C. Total DNA was extracted using a Promega Maxwell 16 instrument and a Maxwell 16 cell DNA purification kit following the recommended procedure (Promega, Madison, WI). The yield was quantitated on a Qubit (v2.0) fluorometer using a double-stranded DNA broad-range assay kit (Life Technologies, Grand Island, NY) and diluted to 0.3 ng/μl, and 5 μl was used for library generation using a Nextera XT DNA sample preparation kit and Nextera XT index primers (Illumina, San Diego, CA). The recommended procedure was followed with the following exceptions: a larger amount of DNA was used, and the library normalization step was omitted in favor of quantitative PCR (qPCR) library quantification. qPCR was performed on a Bio-Rad CFX96 cycler using a Kapa BioSystems (Woburn, MA) library quantification kit (catalog number KK4824). Libraries were diluted to a standard concentration of 4 nM, and 2.5 μl of each sample (8 to 12 samples, depending on the organism, targeting 25- to 50-fold coverage) was combined and denatured with 0.1 N NaOH (final concentration) for 5 min. Sufficient sample was diluted to 600 μl to provide a 15- to 20-pmol multiplexed library. Samples were sequenced on an Illumina MiSeq V2 instrument as 2 × 150 bp read lengths.
Assembly and analysis were performed off instrument using the CLCBio Genomics Workbench program (v6.5; Cambridge, MA). Fastq files were processed and analyzed as follows: duplicate sequence reads were removed, and the remaining reads were trimmed for quality and minimum length (50 bp). Reads were de novo assembled at high stringency (fraction length = 0.9, similarity fraction = 0.99) using default mismatch/insertion/deletion costs. Detection of single nucleotide polymorphisms (SNPs)/indels was accomplished through mapping to a parent reference assembly using the same parameters. Quality-based SNPs were detected at a minimum frequency of 80% using default criteria.
RESULTS AND DISCUSSION
Assay development and validation.
To develop a bacterial biosensor assay that identifies inhibitors of DNA metabolism, fast-folding GFP (32) was placed under the transcriptional control of promoters of SOS response and DNA replication genes, and the resulting constructs were transformed into an E. coli strain containing a tolC gene deletion. The tolC gene was deleted to increase compound dissemination into the cell, thereby improving the sensitivity of the assay (30). Several promoters (Table 1) involved in DNA metabolism were evaluated, to identify one that gave the most robust signal, which is needed for a high-throughput assay. Preliminary experiments identified minimal salts medium (M9) with 0.1 to 0.2% Casamino Acids (causing minimal fluorescence interference), a starting OD600 of 0.2, and at least a 3-h induction time when quinolones and ampicillin were used as positive and negative controls, respectively, as optimal parameters for the assay. A comparison of different quinolones yielded similar results, and norfloxacin was used as the quinolone exemplar in subsequent studies.
Induction of fluorescence was measured upon exposure to the DNA replication inhibitor norfloxacin (9) for 14 biosensor strains (Table 1). All of them yielded increased numbers of RFU in response to treatment with norfloxacin for 6 h, but only a few showed significant (>5-fold) induction that would allow an appropriate assay window in an HTS screen (Fig. 1). As assay selectivity, induction time, incubation temperature, and growth medium, including DMSO concentrations, were further explored, the recA-containing biosensor consistently showed the most robust induction signal (data not shown) and was therefore selected for use for final assay validation by assaying the response to a panel of 21 antibacterial compounds whose modes of action are linked to the various metabolic pathways in bacteria (Fig. 2).
FIG 1.
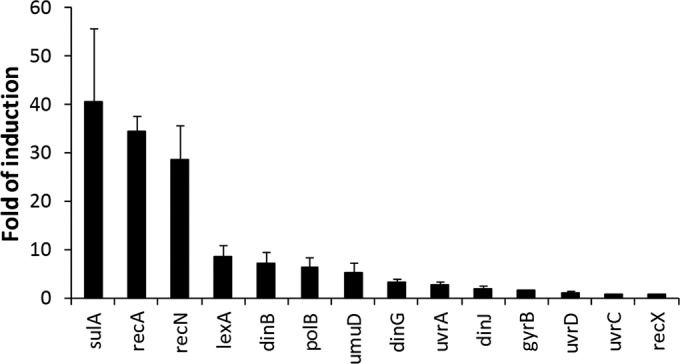
Fourteen promoters fused with GFP (reporter strains) were assayed for RFU induction upon exposure for 6 h to norfloxacin at the MIC. Data represent the average fold induction over that for untreated cells (±SD) from three experiments. The functions of the genes are described in Table 1.
FIG 2.

Fold RFU induction in the E. coli MG1655 ΔtolC recA-GFP biosensor strain upon exposure to a variety of inhibitors for 7 h at 37°C at 1/8× (white bars), 1/4× (light gray bars), 1/2× (dark gray bars), 1× (black bars), and 2× (bars with gradient shading) the growth-inhibitory concentration under these assay conditions. The structures of compounds 1 to 6 are shown in Table 3. TMK, thymidylate kinase; DHFR, dihydrofolate reductase; PBP, penicillin binding protein.
All inhibitors of DNA metabolism consistently elicited a significant response (induced fluorescence) in the assay (Fig. 2). Inhibitors of the GyrA subunit of topoisomerase (norfloxacin, nalidixic acid, and compounds 1 and 2), DNA ligase (compound 5), thymidylate kinase (compound 6), dihydrofolate reductase (trimethoprim), and a DNA-damaging agent (mitomycin C) all showed high induction levels (>25-fold). A more moderate (∼10-fold) induction was observed with inhibitors of the ATPase activity of the GyrB subunit of topoisomerase (novobiocin, compounds 3 and 4). In contrast, inhibitors of RNA transcription (rifampin), protein translation (linezolid, tetracycline, mupirocin), fatty acid synthesis (triclosan), and cell wall synthesis (ampicillin, meropenem), as well as membrane-active agents (polymyxin B) and general cell-damaging agents (chlorhexidine and hydrogen peroxide), did not induce a significant response (Fig. 2). Thus, the assay was specific for inhibitors of DNA metabolism under the conditions used to measure activity. Additionally, induction was already detected at sub-growth-inhibitory concentrations (1/8×), suggesting that the assay is more sensitive than cellular screens that use growth inhibition as the readout to identify inhibitors of DNA metabolism.
The assay was able to discern inhibitors of targets involved in nucleotide biosynthesis (thymidylate kinase, dihydrofolate reductase) or DNA replication (DNA ligase, GyrA and GyrB subunits of DNA gyrase), showing that this assay allows screening of multiple targets of DNA metabolism simultaneously. In addition, the assay is able to detect different chemotypes active against a single target; e.g., compounds 1 and 2, nalidixic acid, and levofloxacin all inhibit GyrA. The level of induction may already indicate the mode of inhibition of compounds, as all the different inhibitors that bind to the ATP-binding site of GyrB produced a 10-fold induction, whereas inhibitors with a different mode of inhibition of DNA gyrase produced a much higher induction signal (exemplified in Fig. 2).
These findings are in general agreement with results obtained by an assay with a Bacillus subtilis reporter construct that used the promoter of ypuA fused to firefly luciferase to identify inhibitors of DNA metabolism (17). However, by using GFP as the reporter, no additional reagents need to be added to detect a signal that can be monitored continuously (32). These factors become important with regard to technical feasibility and saving time and cost when running an HTS campaign involving more than 1 million compounds.
High-throughput screening.
To accommodate screening of large compound libraries, the assay was developed as a simple mix-and-measure assay in a 384-well plate format, making it amenable to automation. Approximately 1.2 million compounds were screened at a 10 μM test concentration. The use of acoustic compound dispensing prior to the assay eliminated the need for a compound addition step, simplifying the protocol. Cell inocula prepared from frozen stocks also provided consistent and reproducible signals with easy daily preparation. Using a 30-μl cell suspension in assay medium, a 2-fold induction over the background resulted in a robust assay, with a mean Z′ value of 0.76 ± 0.07 achieved over the 15 screening runs of the entire campaign. Even though the use of a Z′ value with no theoretical upper limit for an activation assay was an artificial measure, it enabled monitoring of assay performance throughout the screening process. A routine normalization calculating percent activity was used. (The Z′ value is a statistical measure used to describe the quality of an assay used in HTS. It is a screening window coefficient that is reflective of the dynamic range of the assay signal and data variation associated with the signal measurements [53].)
An activity cutoff of an effect of >3.5% resulted in a hit rate of 0.8%, with 10,262 compounds being designated active (Fig. 3). The screen identified known inhibitors of DNA metabolism that were present in the compound library, such as quinolones (9) and other inhibitors of DNA gyrase (GyrA) (39), as well as ATPase inhibitors of GyrB (40–43), DNA ligase (44, 45), and thymidylate kinase (46, 47). Given that the assay identified a wide variety of inhibitors, rather than inhibitors of just a single target, the assay was validated as a useful probe to identify inhibitors of DNA metabolism (Fig. 2).
FIG 3.
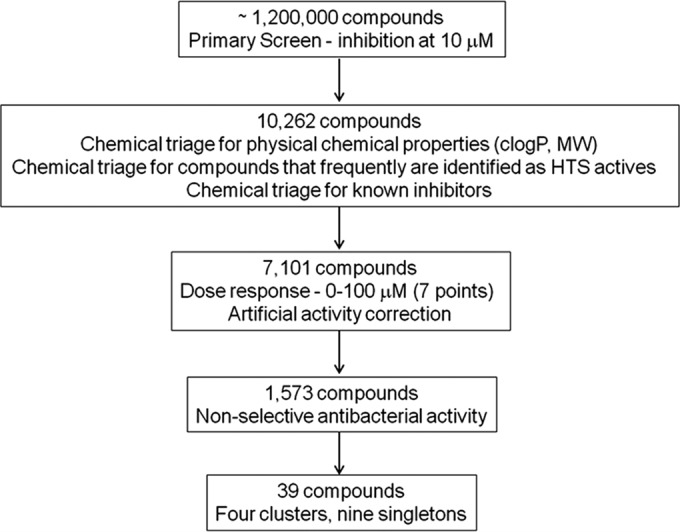
Test cascade of HTS screen with a biosensor strain with a recA-GFP fusion against the AstraZeneca compound library. MW, molecular weight.
Chemical triage removed compounds with undesirable physical-chemical properties (e.g., clogP, >6; molecular weight, >550; active compounds identified in many other unrelated HTS assays), known antibacterial or antifungal compounds, and already known inhibitors of DNA metabolism. The clogP is a calculated measure of a compound's hydrophilicity based on logP [logarithm of its partition coefficient between n-octanol and water log(coctanol/cwater)] measures of known compounds. This left 7,101 compounds that were tested in a 7-point concentration-response (CR) assay, using 100 μM as a maximum concentration. Since the RFU induction in response to these compounds did not display a sigmoidal curve (exemplified using novobiocin and norfloxacin; Fig. 4), CR data were analyzed as single concentrations. Compounds showing a ≥2-fold increase in signal above the background were considered active. As fluorescence assays can be subject to interference from autofluorescent compounds, an artifact assay was used in which compounds were assayed with an E. coli MG1655 strain in which the tolC gene was inactivated through insertion of a kanamycin resistance cassette and which contained no reporter vector (31). To correct for artifactual fluorescence activity, an in-house algorithm was used which compared CR assay data with artifact assay data on a well-by-well basis and normalized the CR data by subtraction if an increase in the signal was detected in the artifact assay (36). Using the artifact correction assay and the outcome of the CR assay data, 1,573 compounds remained as active compounds (Fig. 3).
FIG 4.
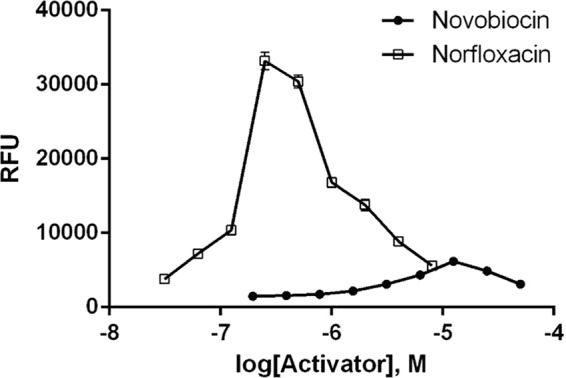
Concentration-response of two known activators in the E. coli MG1655 ΔtolC recA-GFP biosensor strain after a 16-h exposure plotted as the signal (in RFU; means for n = 4 data are shown). The induction in response to these compounds does not display a sigmoidal curve.
The remaining novel hits were screened against the yeast Candida albicans, a mammalian cell line, and red blood cells, to remove nonspecific cytotoxic compounds. Using this stringent cascade, 39 compounds (four clusters and nine singletons; Fig. 3) remained. By discarding compounds showing activity against yeast and/or a mammalian cell line approximately equal to that against E. coli, bona fide DNA metabolism inhibitors may have been eliminated. Pursuing those would have meant additional requirements to improve bacterial selectivity. One novel series, phenylcyclohexylacetic acids (Table 2), was further profiled to confirm their mode of action as DNA metabolism inhibitors.
DNA gyrase inhibitors of novel chemotypes.
All analogs of the phenylcyclohexylacetic acids showed similar activity, with growth inhibition observed only with efflux mutants (Table 4). The mode of action in an E. coli ΔtolC mutant was assessed. Measurement of inhibition of incorporation of cellular pathway-specific radioactive precursors identified DNA biosynthesis (inhibition of [3H]thymidine incorporation) to be the main pathway affected by this series (Table 5). Compounds B and D showed very high specificity, with no inhibition of other pathways being detected at the highest concentration tested (>100-fold selectivity), whereas compound C showed some inhibition of other cellular pathways but only at higher concentrations (∼50-fold selectivity). The bactericidality of the series was assessed with compound A, and rapid killing kinetics with >3-log-unit cell killing within 4 h (Fig. 5) was observed, as is seen for some other DNA metabolism inhibitors (9, 14).
TABLE 4.
Activity of phenylcyclohexylacetic acids
| Compound | MECa (μM) | Maximum fold induction/conc (μM) for maximum fold inductiona | MICb (μM) |
|||
|---|---|---|---|---|---|---|
| E. coli W3110 ΔtolC | E. coli W3110 | H. influenzae ΔarcB | H. influenzae | |||
| A | 4.7 | 21/25 | 3.13 | >200 | 12.5 | 200 |
| B | 6.25 | 10/25 | 6.25 | >200 | 50 | 200 |
| C | 6.25 | 12/25 | 6.25 | >200 | 50 | 200 |
| D | 2.3 | 25/12.5 | 1.56 | >200 | 50 | 200 |
For E. coli MG1655 ΔtolC recA-GFP.
Strains described by Mills et al. (15).
TABLE 5.
Inhibition of incorporation of radioactive precursors specific for certain pathways in E. coli W3110 with inactivated tolCa
| Biosynthetic pathway | Radioactive precursor | IC50b (μg/ml) |
||
|---|---|---|---|---|
| Compound B | Compound C | Compound D | ||
| DNA | [3H]thymidine | 0.8 | 3 | 2 |
| RNA | [3H]uridine | >256 | 160 | >256 |
| Protein | [14C]leucine | >256 | >256 | >256 |
| Cell wall | [14C]N-acetylglucosamine | >256 | 130 | >256 |
| Fatty Acid | [14C]acetate | >256 | 120 | >256 |
The radioactive precursors used have been described previously (37).
IC50, the concentration at which incorporation of the precursor is inhibited by 50%.
FIG 5.
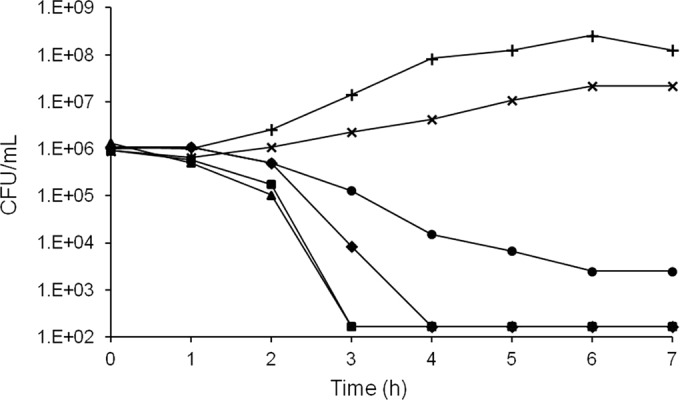
Killing kinetics of compound A against E. coli MG1655 ΔtolC at multiples of the MIC. Plus signs, no compound; multiplication signs, 1/2× MIC; circles, 1× MIC; diamonds, 2× MIC; squares, 4× MIC; triangles, 8× MIC. The limit of detection was 100 CFU/ml.
To further characterize the mode of action of the phenylcyclohexylacetic acid series, E. coli MG1655 ΔtolC and H. influenzae ΔacrB mutants resistant to compound A were isolated on compound gradient agar plates. Five E. coli and four H. influenzae mutants were isolated, and the MICs for phenylcyclohexylacetic acids (compound A) and comparator antibiotics were determined. All E. coli mutants showed highly elevated MICs for compound A (Table 6) and its analogs (data not shown), but the MICs for comparator antibiotics that target cellular pathways other than DNA replication remained the same (Table 6). The E. coli mutants were not cross-resistant to the GyrB inhibitor novobiocin (48), but two of the five mutants showed elevated MICs for the GyrA inhibitor ciprofloxacin (9). Likewise, all H. influenzae mutants showed higher MICs for compound A (64 μg/ml) than their isogenic parent (8 μg/ml), but the MICs for comparator antibiotics that target cellular pathways other than DNA replication remained the same (data not shown).
TABLE 6.
Characterization of isolated E. coli MG1655 ΔtolC mutant strains resistant to compound A
| Strain | MIC (μM) |
Mutation (protein) | ||||||
|---|---|---|---|---|---|---|---|---|
| Compound A | Ciprofloxacin | Meropenem | Tetracycline | Rifampin | Novobiocin | Triclosan | ||
| Parent | 6.25 | 0.024 | 0.195 | 0.781 | 6.25 | 3.13 | 0.024 | |
| Mutant 1 | 200 | 0.391 | 0.195 | 0.781 | 6.25 | 3.13 | 0.024 | G81C (GyrA) |
| Mutant 2 | 200 | 0.098 | 0.195 | 0.781 | 6.25 | 3.13 | 0.024 | S83P (GyrA) |
| Mutant 3 | 200 | 0.024 | 0.195 | 1.56 | 6.25 | 3.13 | 0.024 | G81A (GyrA) |
| Mutant 4 | 200 | 0.024 | 0.195 | 0.391 | 6.25 | 3.13 | 0.024 | K447E (GyrB) |
| Mutant 5 | 200 | 0.024 | 0.195 | 0.391 | 6.25 | 3.13 | 0.024 | K447N (GyrB) |
The genome of each of the five selected E. coli mutants was sequenced. Several nucleotide changes were noted in all of these mutants, but for each mutant only one unique nucleotide change that resulted in an amino acid change was found. The mutations were located in DNA gyrase, either in GyrA (Gly81Cys, Gly81Ala, and Ser83Pro) or in GyrB (Lys447Gln and Lys447Asn) (Table 6). While all the mutations in gyrA were in the quinolone resistance-determining region (QRDR) (49), only some conferred quinolone resistance (Table 6). The mutation at position 83 (Ser83Pro), a classic mutational hot spot in clinical quinolone-resistant isolates, resulted in only a slightly elevated MIC for ciprofloxacin. This particular mutation has not been reported before in Gram-negative species, and the reason for this may be difficulty in selection, as only a low level of resistance (4-fold) was observed in the mutant with this mutation. Alternatively, it could be attributed to the genetic background used in this study. The Gly81Cys mutation has been reported in E. coli upon laboratory selection with moxifloxacin (50), but this mutation has not been reported in clinical isolates, despite the elevated MICs for ciprofloxacin (Table 6). The reason for this may be the slower growth observed with this mutant (for which the doubling time is 100 min, compared to a doubling time of 30 min for the wild-type strain), compromising survival (and, therefore, isolation) in the host. Finally, although the Gly81Ala mutation is within the QRDR, it did not confer quinolone resistance (Table 6). No mutation was observed at Asp87, another mutational hot spot in clinical quinolone resistance, and this series retained activity against quinolone-resistant isolates with Asp87 mutations (data not shown).
Similar to the results obtained for E. coli, sequencing revealed that all the H. influenzae mutants had mutations that mapped to gyrA Gly82Ser (the analogous mutation observed for E. coli gyrA was Gly81Cys). Transformation of PCR-amplified gyrA from genomic DNA isolated from the compound A-resistant strain to the isogenic parent strain, ARC158, conferred resistance to all phenylcyclohexylacetic acid analogs, confirming that the mutation in gyrA is responsible for phenylcyclohexylacetic acid resistance.
The 50% inhibitory concentrations (IC50s) for the phenylcyclohexylacetic acids (compounds A to D) were determined in an E. coli DNA gyrase supercoiling assay (51), and the IC50s for selected fluoroquinolones were compared (Table 7). The compounds inhibited DNA gyrase, though the overall IC50s were more modest (8 to 40 μM) than those observed for the fluoroquinolones (0.25 to 1.1 μM). This was not surprising, given the modest MIC values for these compounds, and it is expected that improvements in target potency will lead to improved MIC values, including activity against wild-type strains.
TABLE 7.
IC50s for E. coli DNA gyrase supercoiling
| Compound | Supercoiling IC50 (μM) |
|---|---|
| Norfloxacin | 0.64 |
| Ofloxacin | 1.14 |
| Ciprofloxacin | 0.25 |
| Compound A | 35.5 |
| Compound B | 41.4 |
| Compound C | 30.1 |
| Compound D | 8.57 |
Phenylcyclohexylacetic acids were identified through HTS, and genomic analysis established that growth suppression by this series was mediated through inhibition of DNA gyrase. While further compound optimization is required to develop this series into useful antibiotics, the identification of these antibacterial compounds validates this assay as a useful tool to discover novel inhibitors of DNA metabolism using HTS.
Conclusion.
An assay using an E. coli construct in which fast-folding GFP was transcriptionally regulated by the recA promoter was validated to screen multiple targets of DNA metabolism simultaneously and was successfully used in HTS to identify novel inhibitors of this cellular process. The assay delivered a good signal over the background and was highly specific for DNA metabolism inhibitors. It provides the potential to identify in a single HTS campaign inhibitors of any one of more than 100 essential DNA metabolism targets, many of which are not amenable to cell-free enzyme HTS assays. The assay is able to identify inhibitors at sub-MICs, and identified hits are likely to penetrate intact cells. By focusing on the identification of selective inhibitors of DNA metabolism, target identification is accelerated compared to the rate of identification of hits in whole-cell growth assays, allowing rapid progress early on in the drug discovery process. Beyond its use in HTS, this assay could also be used for mode of action studies to confirm that compounds suppress cell growth through inhibition of DNA metabolism.
Supplementary Material
ACKNOWLEDGMENTS
We thank Sarah McLeod for constructing the E. coli tolC gene deletion mutant and Tiffany Palmer for measuring activity in the E. coli DNA gyrase supercoiling assay.
Footnotes
Published ahead of print 22 September 2014
Supplemental material for this article may be found at http://dx.doi.org/10.1128/AAC.03475-14.
REFERENCES
- 1.Rice LB. 2008. Federal funding for the study of antimicrobial resistance in nosocomial pathogens: no ESKAPE. J. Infect. Dis. 197:1079–1081. 10.1086/533452. [DOI] [PubMed] [Google Scholar]
- 2.Spellberg BR, Gilbert GD, Bradley J, Boucher HW, Scheld WM, Bartlett JG, Edwards J. 2008. The epidemic of antibiotic-resistant infections: a call to action for the medical community from the Infectious Diseases Society of America. Clin. Infect. Dis. 46:155–164. 10.1086/524891. [DOI] [PubMed] [Google Scholar]
- 3.Boucher HW, Talbot GH, Bradley JS, Edwards JE, Gilbert GD, Rice LB, Scheld WM, Spellberg B, Bartlett JG. 2009. Bad bugs, no drugs: no ESKAPE! An update from the Infectious Diseases Society of America. Clin. Infect. Dis. 48:1–12. 10.1086/595011. [DOI] [PubMed] [Google Scholar]
- 4.Rex JH, Eisenstein BI, Alder J, Goldberger M, Meyer R, Dane A, Friedland I, Knirsch C, Sanhai WR, Tomayko J, Lancaster C, Jackson J. 2013. A comprehensive regulatory framework to address the unmet need for new antibacterial treatments. Lancet Infect. Dis. 3:269–275. 10.1016/S1473-3099(12)70293-1. [DOI] [PubMed] [Google Scholar]
- 5.Silver LL. 2011. Challenges of antibacterial discovery. Clin. Microbiol. Rev. 24:71–109. 10.1128/CMR.00030-10. [DOI] [PMC free article] [PubMed] [Google Scholar]
- 6.Payne DJ, Gwynn MN, Holmes DJ, Pompliano D. 2007. Drugs for bad bugs: confronting the challenges of antibacterial discovery. Nat. Rev. Drug Discov. 6:29–40. 10.1038/nrd2201. [DOI] [PubMed] [Google Scholar]
- 7.Monaghan RL, Barrett JF. 2006. Antibacterial drug discovery–then, now and the genomics future. Biochem. Pharmacol. 71:901–909. 10.1016/j.bcp.2005.11.023. [DOI] [PubMed] [Google Scholar]
- 8.Sanyal G, Doig P. 2012. Bacterial DNA replication enzymes as targets for antibacterial drug discovery. Expert Opin. Drug Discov. 7:327–339. 10.1517/17460441.2012.660478. [DOI] [PubMed] [Google Scholar]
- 9.Wolfson JS, Hooper DC. 1985. The fluoroquinolones: structures, mechanisms of action and resistance, and spectra of activity in vitro. Antimicrob. Agents Chemother. 28:581–586. 10.1128/AAC.28.4.581. [DOI] [PMC free article] [PubMed] [Google Scholar]
- 10.Miller AA, Bundy GL, Mott JE, Skepner JE, Boyle TP, Harris DW, Hromockyj AE, Marotti KR, Zurenko GE, Munzner JB, Sweeney MT, Bammert GF, Hamel JC, Ford CW, Zhong WZ, Graber DR, Martin GE, Han F, Dolak LA, Seest EP, Ruble JC, Kamilar GM, Palmer JR, Banitt LS, Hurd AR, Barbachyn MR. 2008. Discovery and characterization of QPT-1, the progenitor of a new class of bacterial topoisomerase inhibitors. Antimicrob. Agents Chemother. 52:2806–2812. 10.1128/AAC.00247-08. [DOI] [PMC free article] [PubMed] [Google Scholar]
- 11.Black MT, Stachyra T, Platel D, Girard AM, Claudon M, Bruneau JM, Miossec C. 2008. Mechanism of action of the antibiotic NXL101, a novel nonfluoroquinolone inhibitor of bacterial type II topoisomerases. Antimicrob. Agents Chemother. 52:3339–3349. 10.1128/AAC.00496-08. [DOI] [PMC free article] [PubMed] [Google Scholar]
- 12.Grossman TH, Bartels DJ, Mullin S, Gross CH, Parsons JD, Liao Y, Grillot AL, Stamos D, Olson ER, Charifson PS, Mani N. 2007. Dual targeting of GyrB and ParE by a novel aminobenzimidazole class of antibacterial compounds. Antimicrob. Agents Chemother. 51:657–666. 10.1128/AAC.00596-06. [DOI] [PMC free article] [PubMed] [Google Scholar]
- 13.Eakin AE, Green O, Hales N, Walkup GK, Bist S, Singh A, Mullen G, Bryant J, Embrey K, Gao N, Breeze A, Timms D, Andrews B, Uria-Nickelsen M, Demeritt J, Loch JT, Hull K, Blodgett A, Illingworth RN, Prince B, Boriack-Sjodin PA, Hauck S, MacPherson LJ, Ni H, Sherer B. 2012. Pyrrolamide DNA gyrase inhibitors: fragment-based nuclear magnetic resonance screening to identify antibacterial agents. Antimicrob. Agents Chemother. 56:1240–1246. 10.1128/AAC.05485-11. [DOI] [PMC free article] [PubMed] [Google Scholar]
- 14.Keating TA, Newman JV, Olivier NB, Otterson LG, Andrews B, Boriack-Sjodin PA, Breen JN, Doig P, Dumas J, Gangl E, Green OM, Guler SY, Hentemann MF, Joseph-McCarthy D, Kawatkar S, Kutschke A, Loch JT, McKenzie AR, Pradeepan S, Prasad S, Martínez-Botella G. 2012. In vivo validation of thymidylate kinase (TMK) with a rationally-designed, selective antibacterial compound. Am. Chem. Soc. Chem. Biol. 7:1866–1872. 10.1021/cb300316n. [DOI] [PubMed] [Google Scholar]
- 15.Mills SD, Eakin AE, Buurman ET, Newman JV, Gao N, Huynh H, Johnson KD, Lahiri S, Shapiro AB, Walkup GK, Yang W, Stokes SS. 2011. Novel bacterial NAD+-dependent DNA ligase inhibitors with broad-spectrum activity and antibacterial efficacy in vivo. Antimicrob. Agents Chemother. 55:1088–1096. 10.1128/AAC.01181-10. [DOI] [PMC free article] [PubMed] [Google Scholar]
- 16.Alt S, Mitchenall LA, Maxwell A, Heide L. 2011. Inhibition of DNA gyrase and DNA topoisomerase IV of Staphylococcus aureus and Escherichia coli by aminocoumarin antibiotics. J. Antimicrob. Chemother. 66:2061–2069. 10.1093/jac/dkr247. [DOI] [PubMed] [Google Scholar]
- 17.Urban A, Eckermann S, Fast B, Metzger S, Gehling M, Ziegelbauer K, Rubsamen-Waigmann H, Freiberg C. 2007. Novel whole-cell antibiotic biosensors for compound discovery. Appl. Environ. Microbiol. 73:6436–6443. 10.1128/AEM.00586-07. [DOI] [PMC free article] [PubMed] [Google Scholar]
- 18.Norman A, Hestbjerg Hansen L, Sørensen SJ. 2005. Construction of a ColD cda promoter-based SOS-green fluorescent protein whole-cell biosensor with higher sensitivity toward genotoxic compounds than constructs based on recA, umuDC, or sulA promoters. Appl. Environ. Microbiol. 71:2338–2346. 10.1128/AEM.71.5.2338-2346.2005. [DOI] [PMC free article] [PubMed] [Google Scholar]
- 19.Shapiro E, Baneyx F. 2007. Stress-activated bioluminescent Escherichia coli sensors for antimicrobial agents detection. J. Biotechnol. 132:487–493. 10.1016/j.jbiotec.2007.08.021. [DOI] [PubMed] [Google Scholar]
- 20.Yagi K. 2007. Applications of whole-cell bacterial sensors in biotechnology and environmental science. Appl. Microbiol. Biotechnol. 73:1251–1258. 10.1007/s00253-006-0718-6. [DOI] [PubMed] [Google Scholar]
- 21.Mills SD, Dougherty TJ. 2011. Cell-based screening in antibacterial discovery, p 901–930 In Dougherty T, Pucci MJ. (ed), Handbook of antibiotic discovery and development, 1st ed, vol 2 Springer, New York, NY. [Google Scholar]
- 22.Sutton MD, Smith BT, Godoy VG, Walker GC. 2000. The SOS response: recent insights into umuDC-dependent mutagenesis and DNA damage tolerance. Annu. Rev. Genet. 34:479–497. 10.1146/annurev.genet.34.1.479. [DOI] [PubMed] [Google Scholar]
- 23.Brent R, Ptashne M. 1981. Mechanism of action of the lexA gene product. Proc. Natl. Acad. Sci. U. S. A. 78:4204–4208. 10.1073/pnas.78.7.4204. [DOI] [PMC free article] [PubMed] [Google Scholar]
- 24.Craig NL, Roberts JW. 1981. Function of nucleoside triphosphate and polynucleotide in Escherichia coli recA protein directed cleavage of phage lambda repressor. J. Biol. Chem. 256:8039–8044. [PubMed] [Google Scholar]
- 25.Little JW. 1991. Mechanism of specific LexA cleavage: autodigestion and the role of RecA coprotease. Biochimie 73:411–421. 10.1016/0300-9084(91)90108-D. [DOI] [PubMed] [Google Scholar]
- 26.Tsien RY. 1998. The green fluorescent protein. Annu. Rev. Biochem. 67:509–544. [DOI] [PubMed] [Google Scholar]
- 27.Zhang R, Lin Y. 2009. DEG 5.0, a database of essential genes in both prokaryotes and eukaryotes. Nucleic Acids Res. 37:D455–D458. 10.1093/nar/gkn858. [DOI] [PMC free article] [PubMed] [Google Scholar]
- 28.Hutter B, Fischer C, Jacobi A, Schaab C, Loferer H. 2004. Panel of Bacillus subtilis reporter strains indicative of various modes of action. Antimicrob. Agents Chemother. 48:2588–2594. 10.1128/AAC.48.7.2588-2594.2004. [DOI] [PMC free article] [PubMed] [Google Scholar]
- 29.Shapiro E, Baneyx F. 2002. Stress-based identification and classification of antibacterial agents: second-generation Escherichia coli reporter strains and optimization of detection. Antimicrob. Agents Chemother. 46:2490–2497. 10.1128/AAC.46.8.2490-2497.2002. [DOI] [PMC free article] [PubMed] [Google Scholar]
- 30.Koronakis V, Eswaran J, Hughes C. 2004. Structure and function of TolC: the bacterial exit duct for proteins and drugs. Annu. Rev. Biochem. 73:467–489. 10.1146/annurev.biochem.73.011303.074104. [DOI] [PubMed] [Google Scholar]
- 31.Baba T, Ara T, Hasegawa M, Takai Y, Okumura Y, Baba M, Datsenko KA, Tomita M, Wanner BL, Mori H. 2006. Construction of Escherichia coli K-12 in-frame, single-gene knockout mutants: the Keio Collection. Mol. Syst. Biol. 2:1–11. 10.1038/msb4100050. [DOI] [PMC free article] [PubMed] [Google Scholar]
- 32.Cormack BP, Valdivia RH, Falkow S. 1996. FACS-optimized mutants of the green fluorescent protein (GFP). Gene 173:33–38. 10.1016/0378-1119(95)00685-0. [DOI] [PubMed] [Google Scholar]
- 33.Zaslaver A, Bren A, Ronen M, Itzkovitz S, Kikoin I, Shavit S, Liebermeister W, Surette MG, Alon U. 2006. A comprehensive library of fluorescent transcriptional reporters for Escherichia coli. Nat. Methods 3:623–628. 10.1038/nmeth895. [DOI] [PubMed] [Google Scholar]
- 34.Clinical and Laboratory Standards Institute. 2009. Methods for dilution antimicrobial susceptibility tests for bacteria that grow aerobically; approved standard, 9th ed. M07-A8, vol 29, no. 2 Clinical and Laboratory Standards Institute, Wayne, PA. [Google Scholar]
- 35.de Jonge BLM, Walkup GK, Lahiri SD, Huynh H, Neckermann G, Utley L, Nash TJ, Brock J, San Martin M, Kutschke A, Johnstone M, Laganas V, Hajec L, Gu R, Ni H, Chen B, Hutchings K, Holt E, McKinney D, Gao N, Livchak S, Thresher J. 2013. Discovery of inhibitors of 4′-phosphopantetheine adenylyltransferase (PPAT) to validate PPAT as a target for antibacterial therapy. Antimicrob. Agents Chemother. 57:6005–6015. 10.1128/AAC.01661-13. [DOI] [PMC free article] [PubMed] [Google Scholar]
- 36.Shapiro AB, Walkup GK, Keating TA. 2009. Correction for interference by test samples in high-throughput assays. J. Biomol. Screen. 14:1008–1016. 10.1177/1087057109341768. [DOI] [PubMed] [Google Scholar]
- 37.Buurman ET, Johnson KD, Kelly RK, MacCormack K. 2006. Different modes of action of naphthyridones in gram-positive and gram-negative bacteria. Antimicrob. Agents Chemother. 50:385–387. 10.1128/AAC.50.1.385-387.2006. [DOI] [PMC free article] [PubMed] [Google Scholar]
- 38.Hunt DE, Sandham HJ. 1969. Improved agar gradient-plate technique. Appl. Microbiol. 17:329–330. [DOI] [PMC free article] [PubMed] [Google Scholar]
- 39.Reck F, Alm RA, Brassil P, Newman JV, Ciaccio P, McNulty J, Barthlow H, Goteti K, Breen J, Comita-Prevoir J, Cronin M, Ehmann DE, Geng B, Godfrey AA, Fisher SL. 2012. Novel N-linked aminopiperidine inhibitors of bacterial topoisomerase type II with reduced pKa: antibacterial agents with an improved safety profile. J. Med. Chem. 55:6916–6933. 10.1021/jm300690s. [DOI] [PubMed] [Google Scholar]
- 40.Manchester JI, Dussault DD, Rose JA, Boriack-Sjodin PA, Uria-Nickelsen M, Ioannidis G, Bist S, Fleming P, Hull KG. 2012. Discovery of a novel azaindole class of antibacterial agents targeting the ATPase domains of DNA gyrase and topoisomerase IV. Bioorg. Med. Chem. Lett. 22:5150–5156. 10.1016/j.bmcl.2012.05.128. [DOI] [PubMed] [Google Scholar]
- 41.Uria-Nickelsen M, Neckermann G, Sriram S, Andrews B, Manchester JI, Carcanague D, Stokes S, Hull KG. 2013. Novel topoisomerase inhibitors: microbiological characterization and in vivo efficacy of pyrimidines. Int. J. Antimicrob. Agents 41:363–371. 10.1016/j.ijantimicag.2012.12.001. [DOI] [PubMed] [Google Scholar]
- 42.Sherer BA, Hull K, Green O, Basarab G, Hauck S, Hill P, Loch JT, III, Mullen G, Bist S, Bryant J, Boriack-Sjodin A, Read J, DeGrace N, Uria-Nickelsen M, Illingworth RN, Eakin AE. 2011. Pyrrolamide DNA gyrase inhibitors: optimization of antibacterial activity and efficacy. Bioorg. Med. Chem. Lett. 21:7416–7420. 10.1016/j.bmcl.2011.10.010. [DOI] [PubMed] [Google Scholar]
- 43.Basarab GS, Manchester JI, Bist S, Boriack-Sjodin PA, Dangel B, Illingworth R, Sherer BA, Sriram S, Uria-Nickelsen M, Eakin AE. 2013. Fragment-to-hit-to-lead discovery of a novel pyridylurea scaffold of ATP competitive dual targeting type II topoisomerase inhibiting antibacterial agents. J. Med. Chem. 56:8712–8735. 10.1021/jm401208b. [DOI] [PubMed] [Google Scholar]
- 44.Stokes SS, Gowravaram M, Huynh H, Lu M, Mullen GB, Chen B, Albert R, O'Shea TJ, Rooney MT, Hu H, Newman JV, Mills SD. 2011. Discovery of bacterial NAD+-dependent DNA ligase inhibitors: optimization of antibacterial activity. Bioorg. Med. Chem. Lett. 21:4556–4560. 10.1016/j.bmcl.2011.05.128. [DOI] [PubMed] [Google Scholar]
- 45.Stokes SS, Gowravaram M, Huynh H, Lu M, Mullen GB, Chen B, Albert R, O'Shea TJ, Rooney MT, Hu H, Newman JV, Mills SD. 2012. Discovery of bacterial NAD+-dependent DNA ligase inhibitors: improvements in clearance of adenosine series. Bioorg. Med. Chem. Lett. 22:85–89. 10.1016/j.bmcl.2011.11.071. [DOI] [PubMed] [Google Scholar]
- 46.Martínez-Botella G, Loch JT, Green OM, Kawatkar SP, Olivier NB, Boriack-Sjodin PA, Keating TA. 2013. Sulfonylpiperidines as novel, antibacterial inhibitors of Gram-positive thymidylate kinase (TMK). Bioorg. Med. Chem. Lett. 23:169–173. 10.1016/j.bmcl.2012.10.128. [DOI] [PubMed] [Google Scholar]
- 47.Martínez-Botella G, Breen JN, Duffy JES, Dumas J, Geng B, Gowers IK, Green OM, Guler S, Hentemann MF, Hernandez-Juan FA, Joseph-McCarthy D, Kawatkar S, Larsen NA, Lazari O, Loch JT, Macritchie JA, McKenzie AR, Newman JV, Olivier NB, Otterson LG, Owens AP, Read J, Sheppard DW, Keating TA. 2012. Discovery of selective and potent inhibitors of Gram-positive bacterial thymidylate kinase (TMK). J. Med. Chem. 55:10010–10021. 10.1021/jm3011806. [DOI] [PubMed] [Google Scholar]
- 48.Sugino A, Higgins NP, Brown PO, Peebles CL, Cozzarelli NR. 1978. Energy coupling in DNA gyrase and the mechanism of action of novobiocin. Proc. Natl. Acad. Sci. U. S. A. 75:4838–4842. 10.1073/pnas.75.10.4838. [DOI] [PMC free article] [PubMed] [Google Scholar]
- 49.Jacoby GA. 2005. Mechanisms of resistance to quinolones. Clin. Infect. Dis. 41:S120–S126. 10.1086/428052. [DOI] [PubMed] [Google Scholar]
- 50.Cesaro A, Bettoni RRD, Lascols C, Merens A, Soussy CJ, Cambau E. 2008. Low selection of topoisomerase mutants from strains of Escherichia coli harbouring plasmid-borne qnr genes. J. Antimicrob. Chemother. 61:1007–1015. 10.1093/jac/dkn077. [DOI] [PubMed] [Google Scholar]
- 51.Shapiro AB, Jahic H, Prasad S, Ehmann D, Thresher J, Gao N, Hajec L. 2010. A homogeneous, high-throughput fluorescence anisotropy-based DNA supercoiling assay. J. Biomol. Screen. 15:1088–1098. 10.1177/1087057110378624. [DOI] [PubMed] [Google Scholar]
- 52.Bryskier A. (ed). 2005. Antimicrobial agents. Antibacterials and antifungals. ASM Press, Washington, DC. [Google Scholar]
- 53.Zhang J-H, Chung TDY, Oldenburg KR. 1999. A simple statistical parameter for use in evaluation and validation of high throughput screening assays. J. Biomol. Screen. 4:67–73. 10.1177/108705719900400206. [DOI] [PubMed] [Google Scholar]
Associated Data
This section collects any data citations, data availability statements, or supplementary materials included in this article.