

Abstract
Background
Heart failure (HF) patients exhibit depressive and executive function impairments that contribute to HF mortality. Using specialized magnetic resonance imaging (MRI) analysis procedures, brain changes appear in areas regulating these functions (mammillary bodies, hippocampi, and frontal cortex). However, specialized MRI procedures are not part of standard clinical assessment for HF (which is usually a visual evaluation), and it is unclear whether visual examination can detect changes in these structures.
Methods and Results
Using brain MRI, we visually examined the mammillary bodies and frontal cortex for global and hippocampi for global and regional tissue changes in 17 HF and 50 control subjects. Significant global changes emerged in the right mammillary body (HF vs. control scores; 1.18±1.13 vs. 0.52±0.74; P=.024), right hippocampus (1.53±0.94 vs. 0.80±0.86; P=0.005), and left frontal cortex (1.76±1.03 vs. 1.24±0.77; P=0.034) between groups. Comparison of the visual method with specialized MRI techniques corroborates right hippocampal and left frontal cortical, but not mammillary body, atrophy.
Conclusions
Visual examination of brain MRI can detect damage in HF in areas regulating depression and executive function, including the right hippocampus and left frontal cortex. Visual MRI assessment may facilitate evaluation of injury to these structures and the assessment of the impact of potential treatments for this damage.
Keywords: Mammillary body, hippocampus, frontal cortex, atrophy
Introduction
Heart failure (HF) patients demonstrate brain injury detected by specialized magnetic resonance imaging (MRI) analysis techniques.1,2 The areas of injury, which regulate depressive symptoms and executive function, include the mammillary bodies, hippocampi, and frontal cortex.1,2 However, these specialized MRI analysis techniques are labor- and time-intensive, and demand special training not often available in a clinical setting. Moreover, most of these specialized MRI analysis procedures depend upon group evaluation, rather than assessment of a single individual. These specialized techniques are not amenable to standard clinical evaluation, thus making it less likely that they would be used routinely to evaluate brain injury and progression in individual HF patients. This is because standard clinical brain MRI examination consists of visual assessment of individual subjects.
It is unknown if the damage detected by the specialized MRI group analysis techniques can be assessed using standard visual examination of individuals. However, standard clinical brain MRI evaluation procedures provide important information on brain tissue status in other patient populations. Visual assessment (common clinical practice) of atrophy of temporal structures approaches comparable reliability as volumetric techniques (a common research technique) at correctly identifying Alzheimer's patients from control subjects.3,4 In addition, ventricular enlargement of the brain demonstrated by both linear and volumetric assessment has been correlated with memory decline in Alzheimer's Disease, and linear assessment can be substituted for the more laborious volume measurements.5 However, the ability of standard visual brain MRI examination to detect tissue damage in regions which control depression and executive function in HF is unclear.
The goal of this study is to evaluate whether standard visual evaluation of the brain using routine images in HF patients compared to age- and gender-comparable control subjects can detect damage in brain regions that control depression and executive function (mammillary bodies, hippocampi, and frontal cortex). Since significant damage to these areas have been reported with specialized MRI analysis techniques,1,2 we hypothesize that brain damage would appear in these sites based on standard visual assessment procedures. In addition, we measured depression using the Beck Depression Inventory-II (BDI-II) and evaluated executive function using the Trail Making Test B (TMT-B) in HF to corroborate symptoms with brain structure assessments. If visual examination can help identify brain injury in HF, both clinicians and researchers may have a simpler method to assess brain damage and progression of injury over time in HF patients.
Methods
Study Design
This study used a two-group comparative design contrasting global and regional injury in brain structures in HF patients and control subjects.
Subjects
Seventeen HF patients (mean age ± SD, 54.4 ± 8.1 years; 12 males; left ventricular ejection fraction 0.28 ± 0.07, New York Heart Association Class II) and 50 control subjects (age 50.6 ± 7.0 years; 29 males) were examined in this study. The same subjects have been examined previously using quantitative research MRI analysis techniques.1,2,6 Heart failure subjects were recruited from the Ahmanson/University of California, Los Angeles (UCLA) Cardiomyopathy Center and the surrounding Los Angeles community. The HF diagnosis was based upon national standards7 and etiologies were classified as ischemic for five HF subjects and idiopathic for the other 12. Four of the HF subjects had type II diabetes. Two of the HF patients had atrial fibrillation and six had a past history of hypertension. All HF subjects were treated with similar drug therapies, which included beta-blockers, diuretics, and angiotensin receptor blockers or angiotensin-converting enzyme inhibitors titrated to specific hemodynamic goals.8 For at least six months prior to the MRI scan, drug doses and body weights were stable. All control subjects were healthy, had no history of cardiovascular, respiratory, stroke, or neurological insults, and were recruited from the greater Los Angeles area. We excluded any subjects with MRI contraindications, including nonremovable metals (such as braces, pacemakers/implantable cardioverter-defibrillators, stents, and embolic coils) and claustrophobia (http://www.mrisafety.com/). All subjects gave written and informed consent for participation and the research study was approved by the Institutional Review Board at UCLA.
Magnetic Resonance Imaging
A 3.0 Tesla MRI scanner (Siemens, Magnetom Tim-Trio, Erlangen, Germany) was used to obtain brain MR images from HF and control subjects. During the scanning process, motion was minimized by the placement of foam pads on either side of the head. High-resolution T1-weighted images were collected using a magnetization prepared rapid acquisition gradient-echo sequence [repetition time (TR) = 2200 ms; echo-time (TE) = 2.2 ms; inversion time = 900 ms; flip angle (FA) = 9°; matrix size = 256 × 256; field of view (FOV) = 230 × 230 mm; slice thickness = 1.0 mm]. Proton density (PD)- and T2-weighted images (TR = 10,000 ms; TE1, 2 = 17, 134 ms; FA = 130°; matrix size = 256 × 256; FOV = 230 × 230 mm; slice thickness = 4.0 mm) were acquired using a dual-echo turbo spin-echo pulse sequence in the axial plane.
Visual Examination of Brain Structures
We used high-resolution T1-weighted, T2-weighted and PD-weighted images for assessment of global atrophy in the mammillary bodies, hippocampi, and frontal cortex, and the same images were used for examination of regional tissue injury within the hippocampi using MRIcroN software.9 Global atrophy was examined in all brain structures; however, since the hippocampus is amenable to visual examination of regional (infarct) changes, we provided additional criteria to assess this region. The investigator who performed the visual assessment of the brain MR images was blinded to subject group assignments, and the grading scores were reviewed and verified by another investigator.
Assessment of mammillary bodies
Axial views of high-resolution T1-weighted images were used for the assessment of global mammillary body atrophy. A grade of 0 corresponded with normal, 1 to a partly reduced body, 2 to a body that was 50% reduced, and 3 to a body that was mostly decreased. Figure 1 shows examples of each of the mammillary body grade classifications.
Figure 1. Examples of mammillary body atrophy grading.
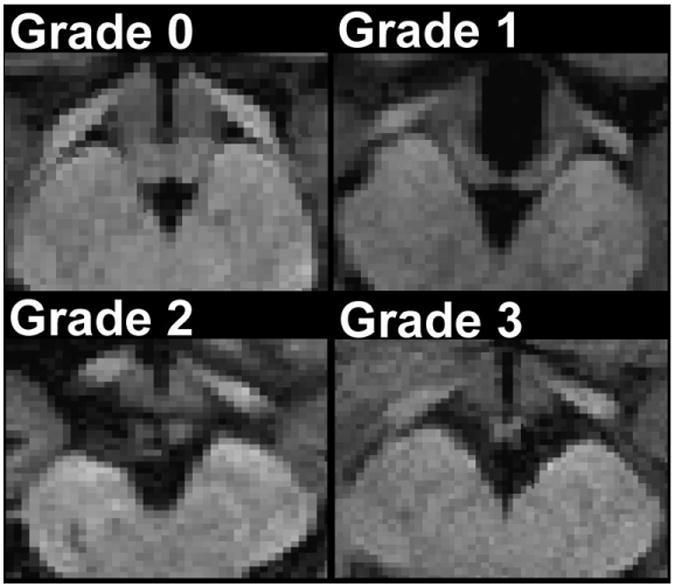
Panels A-D display increasingly smaller bodies.
Assessment of hippocampi
Using sagittal views, we examined global and regional hippocampal atrophy with high-resolution T1-weighted images in all individuals.
Global hippocampal atrophy
Global hippocampal atrophy was scored using the following scheme: 0 for no atrophy, 1 for mild atrophy, 2 for moderate atrophy, and 3 for severe atrophy.3 Examples of grading for global hippocampal atrophy are displayed in Figure 2.
Figure 2. Illustrations of global and regional hippocampal atrophy grading.
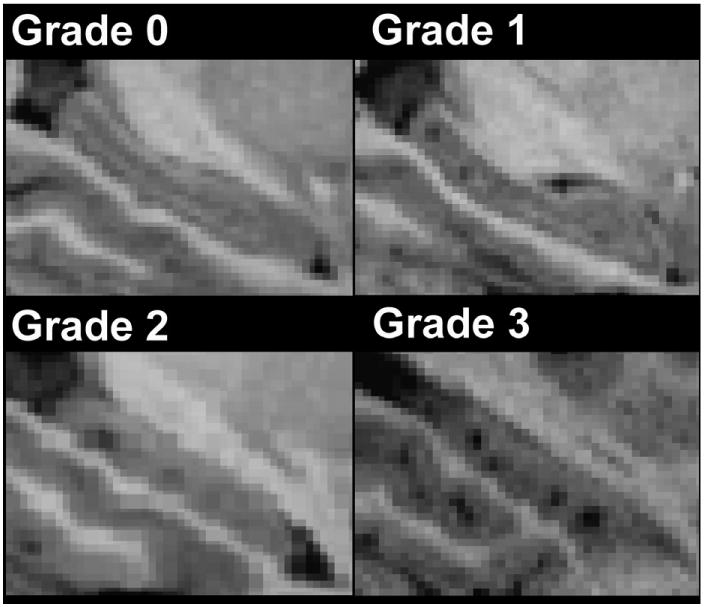
Panels A-D show increasingly severe hippocampal atrophy.
Regional hippocampal atrophy
Regional hippocampal atrophy took into account the number of infarcts 0.8 mm (maximum resolution of images) in diameter and number of infarcts ≥ 1.6 mm in diameter. Regional hippocampal infarcts which were 0.8 mm in diameter within the structure were examined with the following scoring scheme: a score of 0 corresponded with no infarcts observed, a score of 1 with one to two infarcts observed, a score of 2 with three to four infarcts observed, and a score of 3 with five or more infarcts observed. For infarcts ≥ 1.6 mm in diameter, a score of 0 corresponded with no infarcts observed, 1 with one infarct observed, 2 with two infarcts observed, and 3 with three infarcts observed. In cases where both infarcts 0.8 mm and ≥ 1.6 mm where observed, the scores were added. Examples of grading for regional hippocampal atrophy are shown in Figure 2.
Assessment of frontal cortical atrophy
Frontal cortical atrophy was assessed using axial views of T2-weighted images, and was considered present if images showed hyperintensity around the sulci/gyri.10 Cortical atrophy was graded according to the following scheme: 0 for thin white lining, 1 for semi-thick hyperintensity, 2 for consistent thick hyperintensity, and 3 for extensive hyperintensity invading into space normally occupied by white matter.10-12 Examples of grading for frontal cortical atrophy are displayed in Figure 3.
Figure 3. Diagram of frontal cortical atrophy grading.
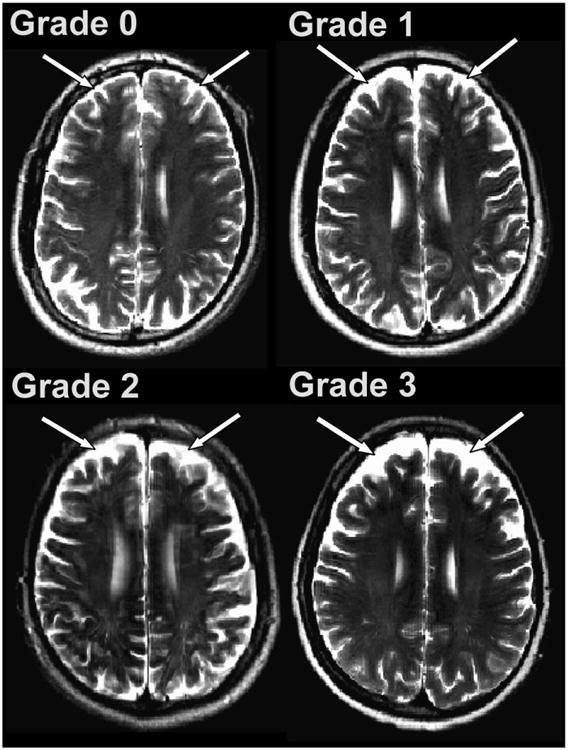
Panels A-D exhibit progressively more hyperintensity in the frontal cortex, corresponding to increased frontal cortical atrophy
Intrarater Reliability
Intrarater reliability for evaluation of brain structures was assessed by blindly re-grading those structures in 20 randomly chosen subjects. Of 20 subjects, 5 were HF and 15 were control subjects. The intraclass correlations (ICC) were high for global mammillary body (ICC = 0.906, P < 0.001), regional hippocampal (ICC = 0.958, P < 0.001), global hippocampal (ICC = 0.959, P < 0.001), and global frontal cortical (ICC = 0.964, P < 0.001) atrophy.
Specialized MRI Analysis Techniques
Two specialized MRI analysis techniques employed in our previous studies1,2 were used to evaluate the comparable findings of the current visual assessment method. We obtained volumetric data of the mammillary bodies using region of interest (ROI) analysis. Tissue changes for the hippocampi and frontal cortex were assessed using T2 relaxometry. The results using these specialized MRI techniques have been previously published.1,2
Measurement of Depression and Executive Function
Depression is correlated with hippocampal function13 and executive function is mediated by the frontal cortex.14 The BDI-II was used to measure depression15 and the TMT-B was employed to assess executive function16 in HF patients and control subjects. The BDI-II is composed of 21 questions assessing elements such as mood, sleep, and appetite, whereas the TMT-B measures executive function by assessing the time required to connect letters and numbers sequentially in alteration. The BDI-II and TMT-B were administered either immediately before or after the MR imaging.
Statistical Analysis
We used the Statistical Package for Social Sciences software (SPSS, V 18.0, Chicago, IL) for data analyses. Demographic data were evaluated by Mann-Whitney U and Chi-square. We used the Mann-Whitney U test to determine statistical significance in the grading scores of different brain sites between HF and control subjects. Significance levels were set at P ≤ 0.05, and all tests were two-tailed. Presence of agreement between the two MRI assessment methods (specialized MRI analysis techniques primarily used in research and the more common clinical visual assessment method) was determined by whether or not each method found statistically significant differences between the HF and control subjects.
Results
Demographic data for control subjects and HF patients are shown in Table 1. No significant differences emerged in age or gender between HF and control subjects. Body mass index showed significant differences between groups (P = 0.010), with HF subjects being heavier than controls. Heart failure patients were significantly depressed (P = 0.005) and demonstrated worse executive function (P = 0.050) compared to control subjects.
Table 1.
Demographic data of HF and control subjects.
| Demographics/Characteristics | HF (n=17) | Controls (n=50) | P Value |
|---|---|---|---|
| Age (Mean ± SD, years) | 54.4 ± 8.1 | 50.6 ± 7.0 | 0.076 |
| Gender (male:female) | 12:5 | 29:21 | 0.361 |
| BMI (Mean ± SD, kg/m2) | 29.4 ± 5.7 | 24.9 ± 4.0 | 0.010 |
| BDI-II (Mean ± SD) | 10.4 ± 7.6 | 4.3 ± 4.3 | 0.005 |
| TMT-B (Mean ± SD, seconds) | 92.38 ± 50.20 | 73.18 ± 26.19 | 0.050 |
SD, standard deviation; BMI, body mass index; BDI-II, Beck Depression Inventory-II; TMT-B, Trail Making Test B.
Mammillary Bodies
Visual Assessment
Mean scores for the mammillary bodies of HF and control subjects are reported in Table 2. Significant differences arose for the right (P = 0.024), but not the left, mammillary bodies between groups.
Table 2.
Different brain sites showing atrophy in HF compared to control subjects.
| Global Atrophy (Mean Grading ± Standard Deviation) | Regional Atrophy (Mean Grading ± Standard Deviation) | P Value | ||||
|---|---|---|---|---|---|---|
| HF A | Control B | HF C | Control D | A:B | C:D | |
| Left Mammillary Body | 0.94 ± 1.20 | 0.44 ± 0.76 | 0.114 | |||
| Right Mammillary Body | 1.18 ± 1.13 | 0.52 ± 0.74 | 0.024 | |||
| Left Hippocampus | 1.47 ± 1.13 | 1.02 ± 0.92 | 1.24 ± 1.20 | 0.94 ± 1.19 | 0.135 | 0.297 |
| Right Hippocampus | 1.53 ± 0.94 | 0.80 ± 0.86 | 1.65 ± 1.17 | 1.16 ± 1.15 | 0.005 | 0.123 |
| Left Frontal Cortex | 1.76 ± 1.03 | 1.24 ± 0.77 | 0.034 | |||
| Right Frontal Cortex | 1.65 ± 0.79 | 1.24 ± 0.82 | 0.060 | |||
Relationship between Specialized MRI Analysis and Visual Assessment
Using a specialized MRI analysis technique (ROI volumetric MRI) techniques, both mammillary bodies in HF were found to be significantly reduced compared to control subjects, with more damage observed in the left than the right.1 These findings do not agree with the reported right mammillary body atrophy in the current study, which finds significant atrophy in the right mammillary body (HF vs. control scores; 1.18 ± 1.13 vs. 0.52 ± 0.74; P = 0.024), but not left body. The amount of tissue injury reported with respect to lateralization is inconsistent between the specialized MRI analysis technique and visual assessment.
Hippocampi
Visual Assessment
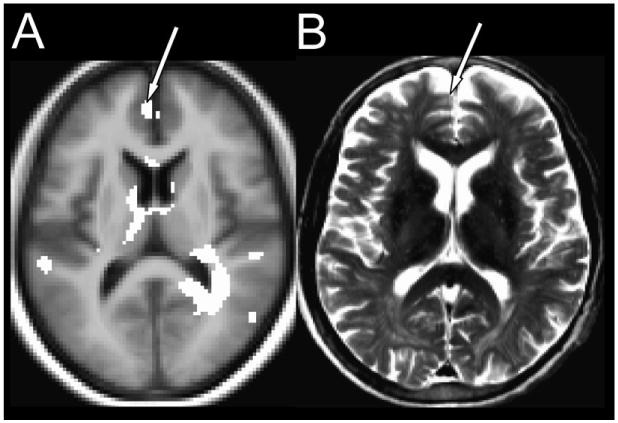
Mean visual assessment scores for the hippocampi are summarized in Table 2. Assessment of global hippocampal atrophy showed significant differences for the right side (P = 0.005), but not for the left side between HF and control subjects. Both the right and left hippocampi showed no significant group differences for regional changes. Figure 4 displays right hippocampal atrophy as detected by visual assessment.
Figure 4. Brain images showing right hippocampal atrophy detected from (A) T2 relaxometry and (B) visual assessment.
(A) The highlighted areas correspond to damage in HF over control subjects. (B) A typical HF patient displays global hippocampal atrophy. The arrows point to the hippocampus.
Relationship between Specialized MRI Analysis and Visual Assessment
We previously used T2 relaxometry (specialized MRI analysis technique) to determine significantly higher relaxation values across the brain, indicative of tissue injury, and found damage in the right but not left hippocampus in HF over control subjects.2 In the current study, we also find significant damage in the right (HF vs. control scores; 1.53 ± 0.94 vs. 0.80 ± 0.86; P = 0.005) and not left hippocampus in HF compared to control subjects. Thus, the specialized MRI analysis technique findings agree with the visual assessment.
Frontal Cortex
Visual Assessment
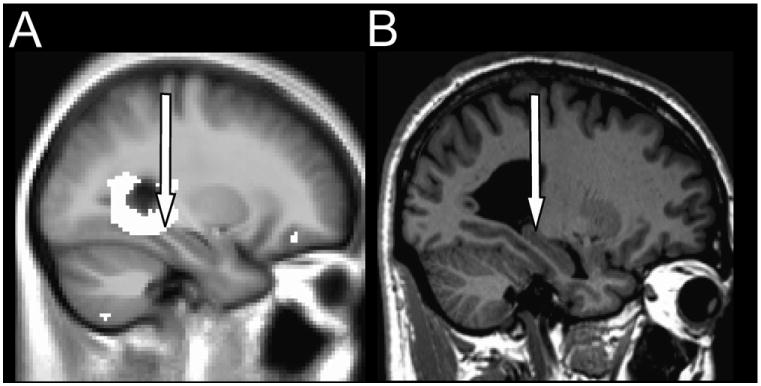
Mean scores of frontal cortical atrophy are tabulated in Table 2. Significant differences in frontal cortical atrophy emerged for the left (P = 0.034), but not for the right side between HF and control subjects. Figure 5 shows frontal cortical atrophy as detected by visual assessment.
Figure 5. Brain images displaying frontal cortical atrophy detected from (A) T2 relaxometry and (B) visual assessment.
(A) The highlighted areas correspond to tissue injury in HF over control subjects. (B) A typical HF patient exhibits frontal cortical atrophy. The arrows point to the atrophy in the frontal cortex.
Relationship between Specialized MRI Analysis and Visual Assessment
We found significantly higher T2 relaxation values in both the left and right frontal cortices in HF compared to control subjects based on specialized MRI analysis techniques.2 Higher T2 relaxation values were reported on the left side compared to the right in HF,2 which agrees with the current study's findings which reports significantly more damage on the left side (HF vs. control scores; 1.76 ± 1.03 vs. 1.24 ± 0.77; P = 0.034). No significant differences in visual atrophy scores emerged for the right frontal cortex in HF patients over control subjects.
Discussion
Overview
We found that visual assessment could corroborate certain lateralized losses in the hippocampus and frontal cortex determined with specialized methods, but could not reliably detect global changes in smaller structures (mammillary bodies). While visual detection of atrophy to the mammillary bodies may not be as sensitive as the more specialized techniques, larger structures, such as the hippocampus and frontal cortex, can be assessed with the more commonly clinically utilized visual technique and thus may allow more convenient and frequent assessment over time in HF patients.
There are advantages and disadvantages to both specialized MRI analysis techniques and visual assessment. The former is considered the most accurate method for assessing brain tissue injury due to its ability to find tissue changes as subtle as 3% across groups.17 However, specialized MRI analysis is not amenable to common clinical practice due to necessary nonstandard quantitative software, extensive time requirements (may take weeks), need for group analysis, and training required to wield these techniques. In contrast, visual assessment has the advantages of not requiring specialized quantitative software, being able to be done quickly (less than an hour), and being able to be carried out on an individual subject. However, the main disadvantage of visual assessment is that it is not as sensitive as specialized MRI analysis techniques at detecting tissue changes. Tissue changes of over 10% within individual subjects are required in order to detect brain injury based on visual examination.18
Agreement and Disagreement between Specialized MRI Analysis and Visual Assessment
The lack of agreement between the visual and specialized MRI techniques for detecting mammillary body atrophy is not unexpected for two reasons. Firstly, perhaps due to the small size of the mammillary body, the visual method is not as sensitive as the specialized analysis techniques at detecting injury. Secondly, the specialized MRI analysis techniques, using group analysis, may have been more impacted by outliers (i.e., one or two subjects who had dramatically different levels or areas of injury which are not typically observed in most HF patients). For these reasons, we do not believe that atrophy to the mammillary body lends itself to visual examination in HF.
The findings from specialized MRI analysis techniques and visual assessment are in complete agreement for the hippocampus and in partial agreement for the frontal cortex. Left frontal cortical atrophy is demonstrated by both specialized MRI analysis techniques and visual assessment. However, the tissue damage in the right frontal cortex reported by specialized MRI analysis techniques could not be detected visually, suggesting that the tissue injury occurring in the right frontal cortex is more subtle and requires more sensitive techniques to be evaluated. The left frontal cortex in HF shows grosser pathology that may be evaluated visually.
Depression and executive function are significantly impacted in HF, which supports the findings that hippocampal and frontal cortical atrophy can be detected visually. The HF patients in the current study displayed more depressive symptoms (hippocampus) than control subjects while also exhibiting impaired executive function (frontal cortex). Visual assessment may be more appropriate at picking up the gross tissue damage in large structures that is observed in HF in order to aid in the clinical management of the disease process.
Potential Mechanisms for Brain Injury in HF
Multiple mechanisms may lead to injury to brain areas that control depression and executive function in HF. These mechanisms may include impaired cerebrovascular autoregulation, thiamine deficiency, and hypoxia from sleep-disordered breathing.
Cerebrovascular autoregulation is impaired, and thus, cerebral blood flow is reduced in HF.19,20 HF patients exhibit reduced cardiac output that may cause brain perfusion to fall below critical levels, leading to neurological signs and symptoms.21
Nutritional conditions may cause damage to brain structures. Thiamine deficiency in animal models is associated with mammillary body and frontal cortical atrophy, along with cognitive deficits that are served by these brain regions.22 Decreased thiamine levels are prevalent in HF patients, and widespread diuretic use likely contributes to this observed thiamine deficiency.23
Persons with sleep-disordered breathing have significant injury in similar brain regions.24-27 Intermittent hypoxic conditions in animal models simulating sleep-disordered breathing, which is reported in 40-100% of HF cases,28,29 damage the hippocampi and frontal cortex.2,30-32 The hypoxia caused by sleep-disordered breathing increases afterload, decreases myocardial oxygen delivery, and decreases myocardial contractility.33 Patients with sleep-disordered breathing exhibit intermittent hypoxia that contributes to autonomic dysregulation and cardiac remodeling.33 Ultimately, the hypoxia caused by sleep-disordered breathing may lead to ischemic damage in brain structures in HF patients.
Potential measures that may reduce the cognitive decline seen in HF patients include stabilizing cerebral blood flow, supplementing the diet with neuroprotective nutrients such as thiamine, and treating sleep-disordered breathing. However, none of these interventions have been thoroughly researched or demonstrated efficacy in the management of cognitive decline in HF.
Lateralization of Brain Atrophy
There may be several explanations for why the right and not left hippocampus is atrophied in HF. Laterally reduced hippocampal volumes on the right side have been reported in depressed patients.34 During memory encoding tasks, control subjects show more activity in the right hippocampus compared to depressive patients,35 suggesting that right hippocampal functionality may be impaired in depression, which is common in HF.36 The hippocampi exhibit lateralization in cerebral blood flow as well. Right-lateralized cerebral blood flow to the hippocampus is associated with increased mental effort in the completion of memory tasks.37 Since memory is impaired in HF,38 it is unsurprising that these patients would exhibit right hippocampal atrophy, possibly as a result of decreased blood flow. Chronic cerebral hypoperfusion in animal models causes cognitive impairments that correspond to hippocampal cell loss.39
There may be multiple reasons for left frontal cortical atrophy in HF. Differences in regional cerebral blood flow to the frontal cortex have been detected,40 with hypoperfusion being reported to exist on the left side.41,42 Neural activity is correlated with the intensity of thought processes in the left frontal cortex, with cerebral blood flow to this region inversely associated with perceived stress.43 The depression and other psychosocial stresses seen in HF may be related to the left frontal cortical atrophy observed in our study.36 Decreased regional blood flow in left prefrontal areas is associated with divided attention at encoding, while decreased blood flow to the right prefrontal cortex is associated with divided attention at retrieval.44 Neural activity associated with executive function is lateralized as well: approach is associated with left frontal activation and avoidance is associated with right frontal activation.45 Differences in left-right frontal cortex functionality may contribute to why cortical atrophy is lateralized in HF.
Study Limitations
The number of subjects examined in this study was small, which limits the generalizability of the findings. Despite the small sample size, significant differences in damage to brain structures between HF and control subjects emerged, suggesting that a considerable effect size on brain injury in the HF patients exists. Although the study cannot definitively state the exact mechanism of tissue changes, we have postulated several plausible mechanisms.
Conclusions
In summary, atrophy in brain structures controlling depression and executive function is visually detectable. Since sophisticated MRI techniques used to assess brain injury may not be available in a clinical environment, visual inspection of MR images could be useful for initial examination of brain injury for rapid evaluation of HF patients, and may be of benefit in evaluating the potential for cognitive consequences in HF, aiding clinicians and researchers in earlier detection of cognitive abnormalities, and allowing easier evaluation of potential treatments for brain injury in HF patients.
Acknowledgments
Grant Support: This research work was supported by National Institute of Health NR-009116 and NR011091.
Footnotes
Disclosures: None.
Publisher's Disclaimer: This is a PDF file of an unedited manuscript that has been accepted for publication. As a service to our customers we are providing this early version of the manuscript. The manuscript will undergo copyediting, typesetting, and review of the resulting proof before it is published in its final citable form. Please note that during the production process errors may be discovered which could affect the content, and all legal disclaimers that apply to the journal pertain.
References
- 1.Kumar R, Woo MA, Birrer BV, Macey PM, Fonarow GC, Hamilton MA, et al. Mammillary bodies and fornix fibers are injured in heart failure. Neurobiol Dis. 2009;33:236–42. doi: 10.1016/j.nbd.2008.10.004. [DOI] [PMC free article] [PubMed] [Google Scholar]
- 2.Woo MA, Kumar R, Macey PM, Fonarow GC, Harper RM. Brain injury in autonomic, emotional, and cognitive regulatory areas in patients with heart failure. J Card Fail. 2009;15:214–23. doi: 10.1016/j.cardfail.2008.10.020. [DOI] [PMC free article] [PubMed] [Google Scholar]
- 3.Desmond PM, O'Brien JT, Tress BM, Ames DJ, Clement JG, Clement P, et al. Volumetric and visual assessment of the mesial temporal structures in Alzheimer's disease. Aust N Z J Med. 1994;24:547–53. doi: 10.1111/j.1445-5994.1994.tb01756.x. [DOI] [PubMed] [Google Scholar]
- 4.Scheltens P, Leys D, Barkhof F, Huglo D, Weinstein HC, Vermersch P, et al. Atrophy of medial temporal lobes on MRI in “probable” Alzheimer's disease and normal ageing: diagnostic value and neuropsychological correlates. J Neurol Neurosurg Psychiatry. 1992;55:967–72. doi: 10.1136/jnnp.55.10.967. [DOI] [PMC free article] [PubMed] [Google Scholar]
- 5.de Leon MJ, George AE, Reisberg B, Ferris SH, Kluger A, Stylopoulos LA, et al. Alzheimer's disease: longitudinal CT studies of ventricular change. AJR Am J Roentgenol. 1989;152:1257–62. doi: 10.2214/ajr.152.6.1257. [DOI] [PubMed] [Google Scholar]
- 6.Kumar R, Woo MA, Macey PM, Fonarow GC, Hamilton MA, Harper RM. Brain axonal and myelin evaluation in heart failure. J Neurol Sci. 2011;307:106–13. doi: 10.1016/j.jns.2011.04.028. [DOI] [PMC free article] [PubMed] [Google Scholar]
- 7.Lindenfeld J, Albert NM, Boehmer JP, Collins SP, Ezekowitz JA, Givertz MM, et al. HFSA 2010 Comprehensive Heart Failure Practice Guideline. J Card Fail. 2010;16:e1–194. doi: 10.1016/j.cardfail.2010.04.004. [DOI] [PubMed] [Google Scholar]
- 8.Steimle AE, Stevenson LW, Chelimsky-Fallick C, Fonarow GC, Hamilton MA, Moriguchi JD, et al. Sustained hemodynamic efficacy of therapy tailored to reduce filling pressures in survivors with advanced heart failure. Circulation. 1997;96:1165–72. doi: 10.1161/01.cir.96.4.1165. [DOI] [PubMed] [Google Scholar]
- 9.Rorden C, Karnath HO, Bonilha L. Improving lesion-symptom mapping. J Cogn Neurosci. 2007;19:1081–8. doi: 10.1162/jocn.2007.19.7.1081. [DOI] [PubMed] [Google Scholar]
- 10.Bakshi R, Czarnecki D, Shaikh ZA, Priore RL, Janardhan V, Kaliszky Z, et al. Brain MRI lesions and atrophy are related to depression in multiple sclerosis. Neuroreport. 2000;11:1153–8. doi: 10.1097/00001756-200004270-00003. [DOI] [PubMed] [Google Scholar]
- 11.Bakshi R, Ariyaratana S, Benedict RH, Jacobs L. Fluid-attenuated inversion recovery magnetic resonance imaging detects cortical and juxtacortical multiple sclerosis lesions. Arch Neurol. 2001;58:742–8. doi: 10.1001/archneur.58.5.742. [DOI] [PubMed] [Google Scholar]
- 12.Schmidt R, Launer LJ, Nilsson LG, Pajak A, Sans S, Berger K, et al. Magnetic resonance imaging of the brain in diabetes: the Cardiovascular Determinants of Dementia (CASCADE) Study. Diabetes. 2004;53:687–92. doi: 10.2337/diabetes.53.3.687. [DOI] [PubMed] [Google Scholar]
- 13.Campolongo M, Benedetti L, Podhajcer OL, Pitossi F, Depino AM. Hippocampal SPARC regulates depression-related behavior. Genes Brain Behav. 2012 doi: 10.1111/j.1601-183X.2012.00848.x. [DOI] [PubMed] [Google Scholar]
- 14.Lovstad M, Funderud I, Endestad T, Due-Tonnessen P, Meling TR, Lindgren M, et al. Executive functions after orbital or lateral prefrontal lesions: Neuropsychological profiles and self-reported executive functions in everyday living. Brain Inj. 2012 doi: 10.3109/02699052.2012.698787. [DOI] [PMC free article] [PubMed] [Google Scholar]
- 15.Steer RA, Clark DA, Beck AT, Ranieri WF. Common and specific dimensions of self-reported anxiety and depression: the BDI-II versus the BDI-IA. Behav Res Ther. 1999;37:183–90. doi: 10.1016/s0005-7967(98)00087-4. [DOI] [PubMed] [Google Scholar]
- 16.Arbuthnott K, Frank J. Trail making test, part B as a measure of executive control: validation using a set-switching paradigm. J Clin Exp Neuropsychol. 2000;22:518–28. doi: 10.1076/1380-3395(200008)22:4;1-0;FT518. [DOI] [PubMed] [Google Scholar]
- 17.Nakamura K, Fisher E. Segmentation of brain magnetic resonance images for measurement of gray matter atrophy in multiple sclerosis patients. Neuroimage. 2009;44:769–76. doi: 10.1016/j.neuroimage.2008.09.059. [DOI] [PMC free article] [PubMed] [Google Scholar]
- 18.Chen W, Song X, Zhang Y, Darvesh S, Zhang N, D'Arcy RC, et al. An MRI-based semiquantitative index for the evaluation of brain atrophy and lesions in Alzheimer's disease, mild cognitive impairment and normal aging. Dement Geriatr Cogn Disord. 2010;30:121–30. doi: 10.1159/000319537. [DOI] [PMC free article] [PubMed] [Google Scholar]
- 19.Georgiadis D, Sievert M, Cencetti S, Uhlmann F, Krivokuca M, Zierz S, et al. Cerebrovascular reactivity is impaired in patients with cardiac failure. Eur Heart J. 2000;21:407–13. doi: 10.1053/euhj.1999.1742. [DOI] [PubMed] [Google Scholar]
- 20.Zuccala G, Cattel C, Manes-Gravina E, Di Niro MG, Cocchi A, Bernabei R. Left ventricular dysfunction: a clue to cognitive impairment in older patients with heart failure. J Neurol Neurosurg Psychiatry. 1997;63:509–12. doi: 10.1136/jnnp.63.4.509. [DOI] [PMC free article] [PubMed] [Google Scholar]
- 21.Lavy S, Stern S, Melamed E, Cooper G, Keren A, Levy P. Effect of chronic atrial fibrillation on regional cerebral blood flow. Stroke. 1980;11:35–8. doi: 10.1161/01.str.11.1.35. [DOI] [PubMed] [Google Scholar]
- 22.Langlais PJ, Savage LM. Thiamine deficiency in rats produces cognitive and memory deficits on spatial tasks that correlate with tissue loss in diencephalon, cortex and white matter. Behav Brain Res. 1995;68:75–89. doi: 10.1016/0166-4328(94)00162-9. [DOI] [PubMed] [Google Scholar]
- 23.Hanninen SA, Darling PB, Sole MJ, Barr A, Keith ME. The prevalence of thiamin deficiency in hospitalized patients with congestive heart failure. J Am Coll Cardiol. 2006;47:354–61. doi: 10.1016/j.jacc.2005.08.060. [DOI] [PubMed] [Google Scholar]
- 24.Macey PM, Henderson LA, Macey KE, Alger JR, Frysinger RC, Woo MA, et al. Brain morphology associated with obstructive sleep apnea. Am J Respir Crit Care Med. 2002;166:1382–7. doi: 10.1164/rccm.200201-050OC. [DOI] [PubMed] [Google Scholar]
- 25.Macey PM, Kumar R, Woo MA, Valladares EM, Yan-Go FL, Harper RM. Brain structural changes in obstructive sleep apnea. Sleep. 2008;31:967–77. [PMC free article] [PubMed] [Google Scholar]
- 26.Kumar R, Birrer BV, Macey PM, Woo MA, Gupta RK, Yan-Go FL, et al. Reduced mammillary body volume in patients with obstructive sleep apnea. Neurosci Lett. 2008;438:330–4. doi: 10.1016/j.neulet.2008.04.071. [DOI] [PubMed] [Google Scholar]
- 27.Lim DC, Veasey SC. Neural injury in sleep apnea. Curr Neurol Neurosci Rep. 2010;10:47–52. doi: 10.1007/s11910-009-0078-6. [DOI] [PubMed] [Google Scholar]
- 28.Ferrier K, Campbell A, Yee B, Richards M, O'Meeghan T, Weatherall M, et al. Sleep-disordered breathing occurs frequently in stable outpatients with congestive heart failure. Chest. 2005;128:2116–22. doi: 10.1378/chest.128.4.2116. [DOI] [PubMed] [Google Scholar]
- 29.Javaheri S, Parker TJ, Liming JD, Corbett WS, Nishiyama H, Wexler L, et al. Sleep apnea in 81 ambulatory male patients with stable heart failure. Types and their prevalences, consequences, and presentations. Circulation. 1998;97:2154–9. doi: 10.1161/01.cir.97.21.2154. [DOI] [PubMed] [Google Scholar]
- 30.Veasey SC, Davis CW, Fenik P, Zhan G, Hsu YJ, Pratico D, et al. Long-term intermittent hypoxia in mice: protracted hypersomnolence with oxidative injury to sleep-wake brain regions. Sleep. 2004;27:194–201. doi: 10.1093/sleep/27.2.194. [DOI] [PubMed] [Google Scholar]
- 31.Pae EK, Chien P, Harper RM. Intermittent hypoxia damages cerebellar cortex and deep nuclei. Neurosci Lett. 2005;375:123–8. doi: 10.1016/j.neulet.2004.10.091. [DOI] [PubMed] [Google Scholar]
- 32.Sica AL, Greenberg HE, Scharf SM, Ruggiero DA. Immediate-early gene expression in cerebral cortex following exposure to chronic-intermittent hypoxia. Brain Res. 2000;870:204–10. doi: 10.1016/s0006-8993(00)02170-3. [DOI] [PubMed] [Google Scholar]
- 33.Leung RS, Comondore VR, Ryan CM, Stevens D. Mechanisms of sleep-disordered breathing: causes and consequences. Pflugers Arch. 2012;463:213–30. doi: 10.1007/s00424-011-1055-x. [DOI] [PubMed] [Google Scholar]
- 34.Nifosi F, Toffanin T, Follador H, Zonta F, Padovan G, Pigato G, et al. Reduced right posterior hippocampal volume in women with recurrent familial pure depressive disorder. Psychiatry Res. 2010;184:23–8. doi: 10.1016/j.pscychresns.2010.05.012. [DOI] [PubMed] [Google Scholar]
- 35.Bremner JD, Vythilingam M, Vermetten E, Vaccarino V, Charney DS. Deficits in hippocampal and anterior cingulate functioning during verbal declarative memory encoding in midlife major depression. Am J Psychiatry. 2004;161:637–45. doi: 10.1176/appi.ajp.161.4.637. [DOI] [PubMed] [Google Scholar]
- 36.Gottlieb SS, Khatta M, Friedmann E, Einbinder L, Katzen S, Baker B, et al. The influence of age, gender, and race on the prevalence of depression in heart failure patients. J Am Coll Cardiol. 2004;43:1542–9. doi: 10.1016/j.jacc.2003.10.064. [DOI] [PubMed] [Google Scholar]
- 37.Gur RC, Ragland JD, Mozley LH, Mozley PD, Smith R, Alavi A, et al. Lateralized changes in regional cerebral blood flow during performance of verbal and facial recognition tasks: correlations with performance and “effort”. Brain Cogn. 1997;33:388–414. doi: 10.1006/brcg.1997.0921. [DOI] [PubMed] [Google Scholar]
- 38.Festa JR, Jia X, Cheung K, Marchidann A, Schmidt M, Shapiro PA, et al. Association of low ejection fraction with impaired verbal memory in older patients with heart failure. Arch Neurol. 2011;68:1021–6. doi: 10.1001/archneurol.2011.163. [DOI] [PMC free article] [PubMed] [Google Scholar]
- 39.Ni J, Ohta H, Matsumoto K, Watanabe H. Progressive cognitive impairment following chronic cerebral hypoperfusion induced by permanent occlusion of bilateral carotid arteries in rats. Brain Res. 1994;653:231–6. doi: 10.1016/0006-8993(94)90394-8. [DOI] [PubMed] [Google Scholar]
- 40.Kume K, Hanyu H, Murakami M, Sato T, Hirao K, Kanetaka H, et al. Frontal Assessment Battery and brain perfusion images in amnestic mild cognitive impairment. Geriatr Gerontol Int. 2011;11:77–82. doi: 10.1111/j.1447-0594.2010.00645.x. [DOI] [PubMed] [Google Scholar]
- 41.Ebert D, Feistel H, Barocka A. Effects of sleep deprivation on the limbic system and the frontal lobes in affective disorders: a study with Tc-99m-HMPAO SPECT. Psychiatry Res. 1991;40:247–51. doi: 10.1016/0925-4927(91)90016-j. [DOI] [PubMed] [Google Scholar]
- 42.Bench CJ, Friston KJ, Brown RG, Scott LC, Frackowiak RS, Dolan RJ. The anatomy of melancholia--focal abnormalities of cerebral blood flow in major depression. Psychol Med. 1992;22:607–15. doi: 10.1017/s003329170003806x. [DOI] [PubMed] [Google Scholar]
- 43.Wang DJ, Rao H, Korczykowski M, Wintering N, Pluta J, Khalsa DS, et al. Cerebral blood flow changes associated with different meditation practices and perceived depth of meditation. Psychiatry Res. 2011;191:60–7. doi: 10.1016/j.pscychresns.2010.09.011. [DOI] [PubMed] [Google Scholar]
- 44.Iidaka T, Anderson ND, Kapur S, Cabeza R, Craik FI. The effect of divided attention on encoding and retrieval in episodic memory revealed by positron emission tomography. J Cogn Neurosci. 2000;12:267–80. doi: 10.1162/089892900562093. [DOI] [PubMed] [Google Scholar]
- 45.Spielberg JM, Miller GA, Engels AS, Herrington JD, Sutton BP, Banich MT, et al. Trait approach and avoidance motivation: lateralized neural activity associated with executive function. Neuroimage. 2011;54:661–70. doi: 10.1016/j.neuroimage.2010.08.037. [DOI] [PMC free article] [PubMed] [Google Scholar]