Abstract
Gibbons are small arboreal apes that display an accelerated rate of evolutionary chromosomal rearrangement and occupy a key node in the primate phylogeny between Old World monkeys and great apes. Here we present the assembly and analysis of a northern white-cheeked gibbon (Nomascus leucogenys) genome. We describe the propensity for a gibbon-specific retrotransposon (LAVA) to insert into chromosome segregation genes and alter transcription by providing a premature termination site, suggesting a possible molecular mechanism for the genome plasticity of the gibbon lineage. We further show that the gibbon genera (Nomascus, Hylobates, Hoolock and Symphalangus) experienced a near-instantaneous radiation ∼5 million years ago, coincident with major geographical changes in southeast Asia that caused cycles of habitat compression and expansion. Finally, we identify signatures of positive selection in genes important for forelimb development (TBX5) and connective tissues (COL1A1) that may have been involved in the adaptation of gibbons to their arboreal habitat.
Supplementary information
The online version of this article (doi:10.1038/nature13679) contains supplementary material, which is available to authorized users.
Subject terms: Genome, Structural variation, Evolutionary genetics, Next-generation sequencing
The genome of the gibbon, a tree-dwelling ape from Asia positioned between Old World monkeys and the great apes, is presented, providing insights into the evolutionary history of gibbon species and their accelerated karyotypes, as well as evidence for selection of genes such as those for forelimb development and connective tissue that may be important for locomotion through trees.
Supplementary information
The online version of this article (doi:10.1038/nature13679) contains supplementary material, which is available to authorized users.
Gibbon genome reflects the high life
The many species of gibbons are small, tree-living apes from Southeast Asia, most of them listed as 'endangered' or 'critically endangered' on the IUCN list. In their presentation of the genome of the northern white-cheeked gibbon (Nomascus leucogenys) , Lucia Carbone and colleagues provide intriguing insights into the biology and evolutionary history of a group that straddles the divide between Old World monkeys and the great apes. The authors investigate how a novel gibbon-specific retrotransposon might be the source of gibbons' genome plasticity. Rapid karyotype evolution combined with multiple episodes of climate and environmental change might explain the almost instantaneous divergence of the four gibbon genera. Positive selection on genes involved in forelimb development and connective tissue might have been related to gibbons' unique mode of locomotion in the tropical canopy.
Supplementary information
The online version of this article (doi:10.1038/nature13679) contains supplementary material, which is available to authorized users.
Main
Gibbons (Hylobatidae) are critically endangered1 small apes that inhabit the tropical forests of southeast Asia (Fig. 1) and belong to the superfamily Hominoidea along with great apes and humans. In the primate phylogeny, gibbons diverged between Old World monkeys and great apes, providing a unique perspective from which to study the origins of hominoid characteristics.
Figure 1. Geographic distribution of gibbon species used in the study.
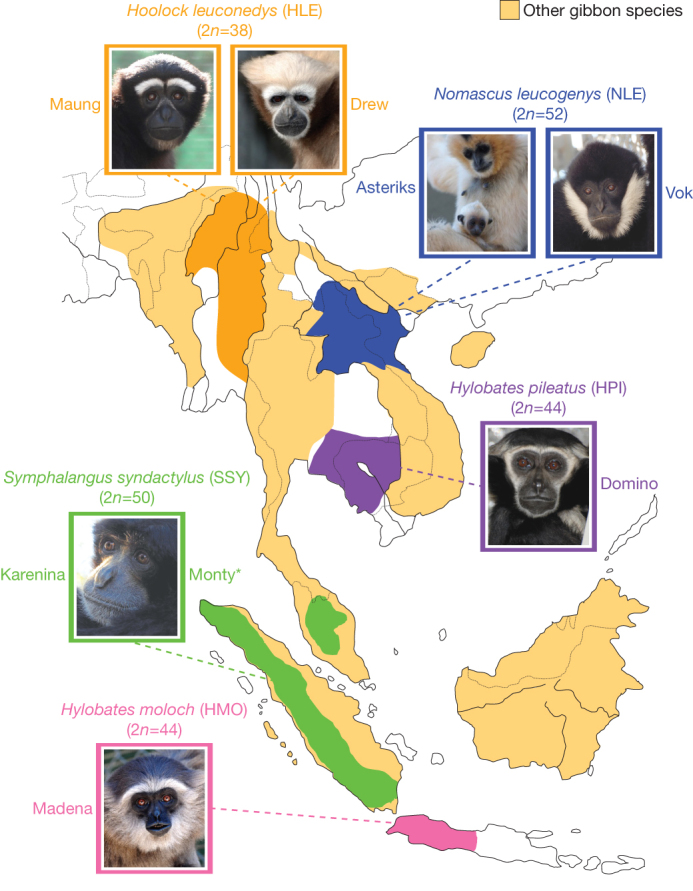
We sequenced two individuals from each gibbon genus and two different species (H. moloch and H. pileatus) for the genus Hylobates. The extant geographic localization for each genus is illustrated on the map. Individuals in the photos are the ones sequenced in this study. The asterisk symbol indicates a deceased animal.
Gibbons have several distinctive traits, the most striking of which is the unusually high number of large-scale chromosomal rearrangements in comparison to the inferred ancestral ape karyotype2. The four gibbon genera (Nomascus, Hylobates, Hoolock and Symphalangus) occupy different regions of southeast Asia and bear distinctive karyotypes, with diploid chromosome numbers ranging from 38 to 52 (Fig. 1). Given the relatively recent differentiation of these genera (4–6 million years ago (Myr ago), this constitutes an extraordinarily fast rate of karyotype change.
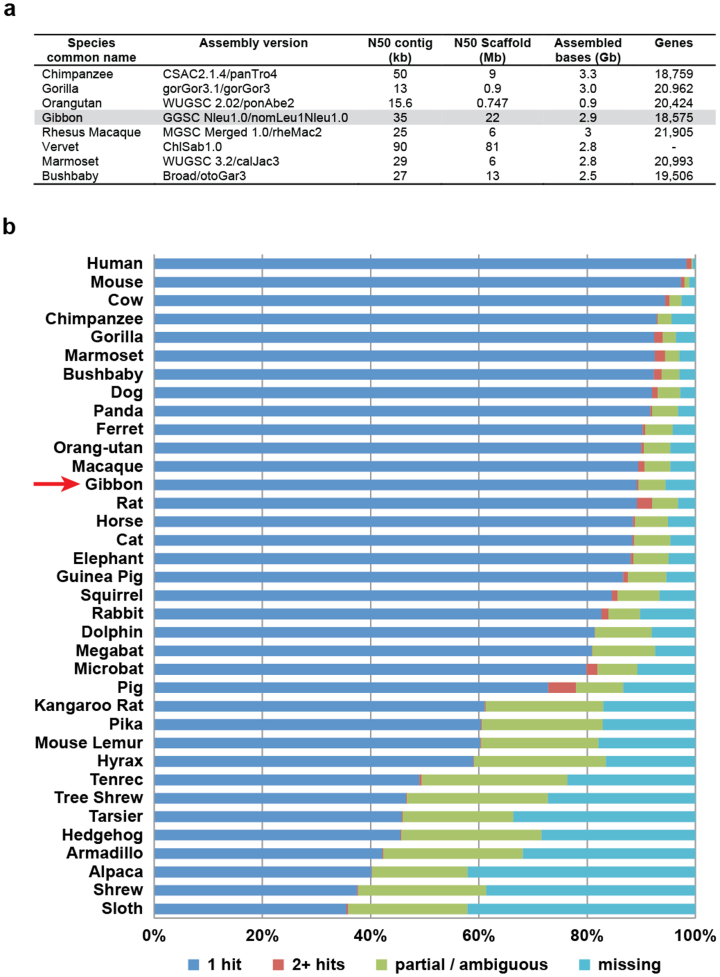
In order to investigate the mechanisms behind the plasticity of the gibbon genome, understand the evolutionary relationships among the four extant gibbon genera and study the evolution of putatively functional sequences related to gibbon-specific adaptations, we sequenced and assembled the genome of a female northern white-cheeked gibbon (Nomascus leucogenys) named ‘Asia’. The reference assembly (Nleu1.0) provides on average 5.7-fold Sanger read coverage over 2.9 gigabase pairs (Gb) (Table 1 and Supplementary Table ST1.1). Our quality assessment (Extended Data Fig. 1) confirmed its equivalence to other Sanger sequence-based non-human primate draft assemblies (such as the orangutan or rhesus macaque3,4) (Supplementary Information section S1, Supplementary Data Files 1 and 2). We also obtained ∼15× whole-genome shotgun (WGS) short-read data (Illumina) for two individuals of each gibbon genus and high-coverage exome data (>60×) for two of the same individuals in order to derive error models for single nucleotide polymorphism (SNP) calls (Supplementary Information section S2; Supplementary Tables ST2.1–2.3).
Table 1.
Gibbon assembly statistics
| Assembly (Nleu1.0/nomLeu1) | |
| Total sequence length | 2,936,052,603 bp |
| Ungapped length | 2,756,591,777 bp |
| Total contig length | 2.77 Gb (92.36%) |
| Number of contigs >1 kb | 197,908 |
| N50 contig length | 35,148 bp |
| Number of scaffolds >3 kb | 17,976 |
| N50 scaffold length | 22,692,035 bp |
| Average read depth | 5.6× |
Extended Data Figure 1. The gibbon assembly statistics and quality control.
a, The table compares the gibbon assembly statistics to those of other primates sequenced with a similar strategy. b, The plot represents the percentage of the 10,734 single-copy gene HMMs (hidden Markov models) for which just one gene (blue) is found in the different mammalian genomes in Ensembl 70. Other HMMs match more than one gene (red). The missing HMMs (cyan) either do not match any protein or the score is within the range of what can be expected for unrelated proteins. The remaining category (green) represents HMMs for which the best matching gene scores better than unrelated proteins but not as well as expected. See Supplementary Information section 1.4 for more details.
Gibbon–human synteny breakpoints
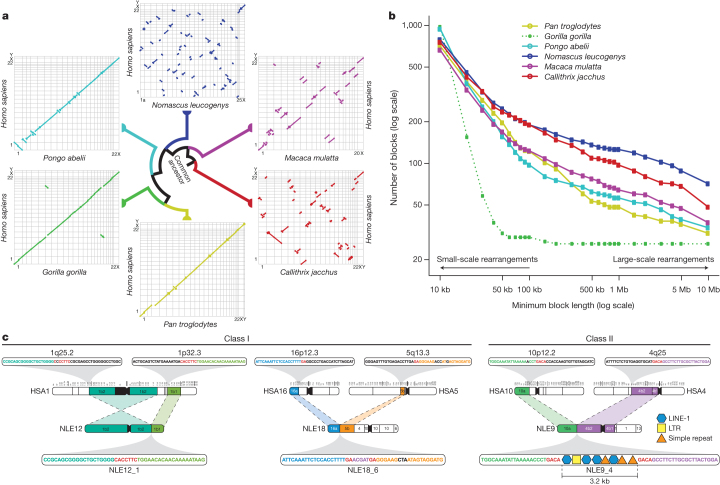
Nleu1.0 scaffolds were aligned against the human reference (GRCh37) to be ordered and oriented into 26 chromosomes (Nleu3.0) under extensive guidance by cytogenetic data. The reshuffled nature of the gibbon genome was especially evident when human–gibbon chromosome alignments were compared with those between human and great apes, rhesus macaque (Old World monkey) and marmoset (New World monkey) (Fig. 2a). This higher rate of reshuffling applied only to large-scale chromosomal rearrangements (>10 megabases (Mb)), whereas smaller-scale rearrangements (10–100 kilobases (kb)) were comparable with other species (Fig. 2b) (Supplementary Information section S1).
Figure 2. Analysis of gibbon–human synteny and breakpoints.
a, Oxford plots for human chromosomes (y axis) vs. chimpanzee, gorilla, orangutan, gibbon, rhesus macaque and marmoset chromosomes (x axis). Each line represents a collinear block larger than 10 Mb. The gibbon genome displays a significantly larger number of large-scale rearrangements than all the other species. In the gorilla plot, chromosomes 4 and 19 stand out as the product of a reciprocal translocation between chromosomes syntenic to human chromosomes 5 and 17. b, The graph shows the number of collinear blocks in primate genomes with respect to the human genome. The number of collinear blocks is a proxy for the number of rearrangements and decreases as the size of the blocks becomes larger. The gibbon genome has undergone a greater number of large-scale rearrangements; however, the number of small-scale rearrangements is comparable with the other species. The extremely low number of large rearrangements in the gorilla genome (dotted green line) is a reflection of the use of the human genome as a template in the assembly process. c, Examples of gibbon–human synteny breakpoints. The first two are class I breakpoints (that is, base-pair resolution) originated through non-homology based mechanisms. NLE12_1 is the result of an inversion in human chromosome 1 and NLE18_6 is the result of a translocation between human chromosomes 16 and 5 with an untemplated insertion in the gibbon sequence shown in purple; in both cases, micro-homologies in the human sequences are shown in red. The last example (NLE9_4) is a class II breakpoint (3.2 kb) containing a mixture of repetitive sequences.
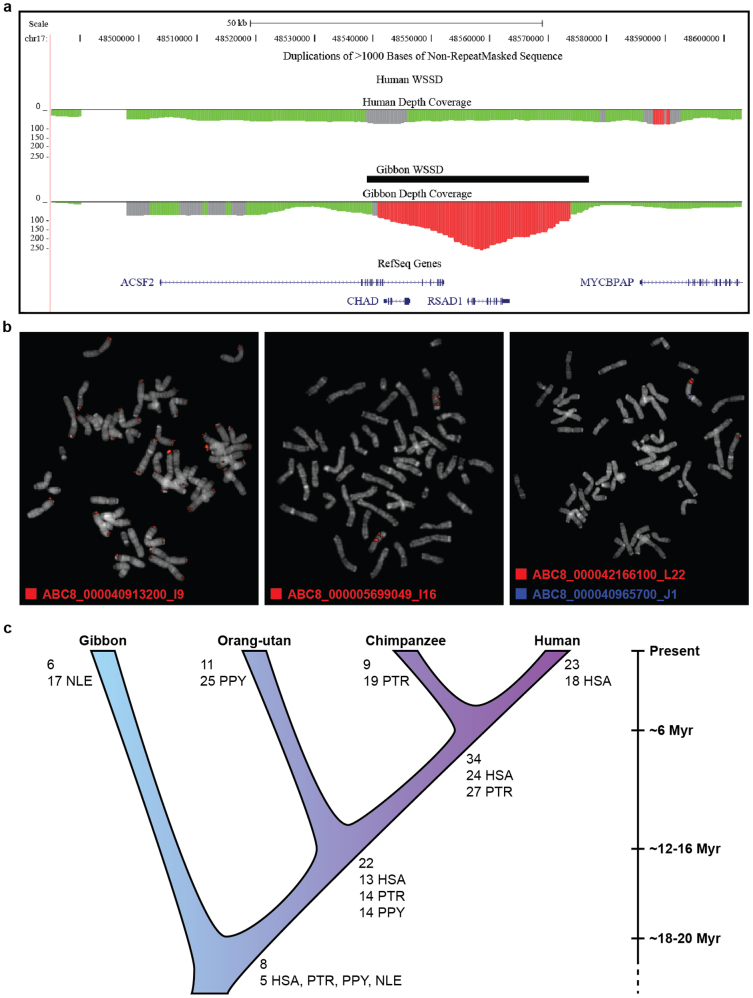
We identified 96 gibbon–human synteny breakpoints in Nleu1.0 and classified them as to whether they could be defined at the base-pair level (class I, n = 42) or only narrowed to an interval due to greater complexity (class II, n = 54). As previously reported5, breakpoints were significantly depleted of genes (Supplementary Fig. SF5.2 and Supplementary Data File 3) and breakpoint intervals contained a mixture of repetitive sequences that inserted exclusively into the gibbon genome2,5,6 (Fig. 2c). To assess breakpoint segmental duplication content, we identified gibbon-specific segmental duplication using in silico methods followed by experimental validation (Extended Data Fig. 2, Supplementary Fig. SF3.1, Supplementary Information section S3 and Supplementary Data File 4). Of note, both gibbon-specific segmental duplication and gene family expansion analyses suggested the gibbon genome has not undergone a greater rate of duplication than other hominoids, further supporting a model in which accelerated evolution has been limited to gross chromosomal rearrangements (Supplementary Information section S6, Supplementary Fig. SF6.1).
Extended Data Figure 2. Analysis of gibbon–human synteny blocks and identification and validation of gibbon segmental duplications.
a, The image shows a representative gibbon-only whole-genome shotgun sequence detection (WSSD) call by Sanger read depth. The duplication identified in this case overlaps with the gene CHAD that codes for a cartilage matrix protein. b, Examples of fluorescence in situ hybridizations on gibbon metaphases using duplicated human fosmid clones that were identified by the (WGS) detection strategy (red signals). Left, interchromosomal duplication. Middle, interspersed intrachromosomal duplication. Right, intrachromosomal tandem duplication confirmed using co-hybridization with a single control probe (blue signals). c, Megabases of lineage-specific and shared duplications for primates based on GRChr37 read depth analysis. Copy-number corrected values by species are shown below.
Segmental duplication enrichment was the best predictor of gibbon–human synteny breakpoints, as shown through permutation analyses (P value < 0.0001); however, breakpoints were also enriched for Alu elements (Supplementary Table ST5.1; Supplementary Information section S5; Supplementary Fig. SF5.2). Although non-allelic homologous recombination between highly similar sequences can mediate large-scale rearrangements7, the majority of gibbon chromosomal breakpoints bore signatures of non-homology based mechanisms (Fig. 2c). These included the insertion of non-templated sequences (2–51 nucleotides (nt)) and/or the absence of identity, suggesting non-homologous end joining. The presence of micro-homologies (2–26 nt) in a small portion of the breakpoints (13/42) pointed to additional alternative mechanisms such as microhomology-mediated end joining8 or microhomology-mediated break-induced replication9. The origin of the complex structure of breakpoint intervals (class II) was less obvious and reinforced the observation that repeats have the tendency to accumulate at the breakpoints.
To explore the possibility that chromatin conformation, rather than sequence, might predispose regions to breakage, we investigated the relationship between gibbon breakpoints and CCCTC-binding factor (CTCF), an evolutionarily conserved protein with multiple functions, including mediating intra- and interchromosomal interactions10. We performed chromatin immunoprecipitation followed by high-throughput sequencing (ChIP-seq) of CTCF-bound DNA using lymphoblast cell lines established from eight gibbon individuals (Supplementary Information section S5). We observed an enrichment of gibbon–human breakpoints in CTCF-binding events (P value = 0.0028), which increased when we considered a ∼20 kb window centred around each breakpoint (P value of < 0.0001). Notably, this enrichment was maintained only for CTCF-binding events shared with other primates (human, orangutan and rhesus macaque)11 but not those specific to gibbon (P value = 0.0019) (Supplementary Fig. SF5.4).
Thus, gibbon–human breakpoints co-localized with distinct genomic features and epigenetic marks; however, as many of these features were shared with other primates, other factors unique to the gibbon lineage must have been present to trigger the increased frequency of chromosomal rearrangements.
LAVA insertions in the gibbon genome
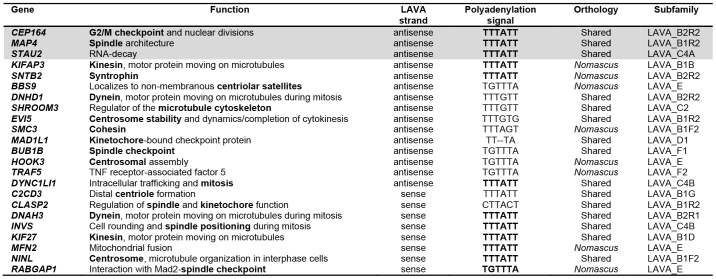
The gibbon genome contains all previously described classes of transposable elements that are mostly also present in other primates. One exceptional addition is the LAVA element, a novel retrotransposon that emerged exclusively in gibbons12 and has a composite structure comprised of portions of other repeats (3′-L1-AluS-VNTR-Alu-like-5′) (Fig. 3a). Searches of Nleu1.0 retrieved 1,797 LAVA insertions, 1,256 of which were 3′ intact elements, many carrying signs of target-primed reverse transcription (TPRT)13. The distribution of 3′ intact LAVA elements uncovered a significant overlap with genes (Pearson chi-squared, P = 0.017) and Gene Ontology (GO) analyses using the database for annotation, visualization, and integrated discovery (DAVID)14 showed a significant functional enrichment exclusive to the ‘microtubule cytoskeleton’ category (false discovery rate = 0.031, P value = 0.001) (Supplementary Information section S7 and Supplementary Data File 6) (Extended Data Fig. 3). Additional analyses with meta-pathway database tools15,16 refined this enrichment to pathways related to chromosome segregation, including ‘establishment of sister chromatid cohesion’ and ‘mitotic metaphase and anaphase’ (Supplementary Table ST7.3). Genes with LAVA insertions include proteins that function as checkpoints for cell division and for spindle integrity/architecture (such as MAP4, CEP164 and BUB1B)17,18,19, participate in kinetochore assembly and attachment to the spindle (for example, MAD1L1 and CLASP2)20,21, and have a role in chromosome segregation during cell division (for example, KIFAP3 and KIF27)22 (Extended Data Table 1).
Figure 3. The LAVA element and evidence for LAVA-mediated early transcription termination.
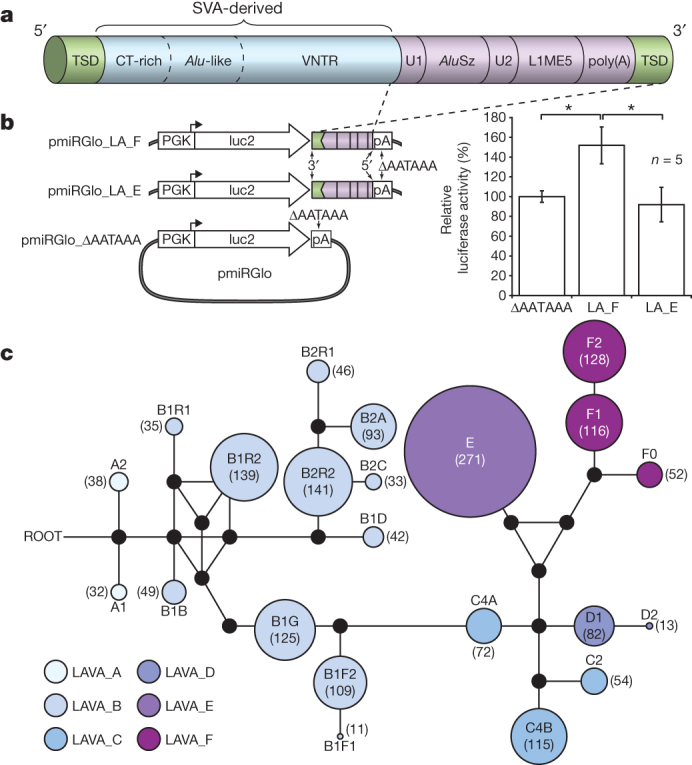
a, Schematic view of the LAVA element highlights the main components that originated from common repeats (L1, Alu, VNTR and Alu-like). Target-site duplications (TSDs) and the poly(A) tail are also indicated. b, Luciferase reporter constructs used to assay for LAVA-mediated early transcriptional termination (left panel) and results of the luciferase reporter assay (right panel) showing increased luciferase activity by ∼50% relative to the background for pmiRGlo_LA_F (*P = 0.0013) (see Supplementary Information section S7.8) n = 5, five biological replicates, from five independent transfections done for each experimental condition tested. The experiment shown was replicated twice in the laboratory. Statistics were carried out using a Student’s t-test (two sided), P values for all pairwise comparisons LA_F vs. LA_E, ΔPA vs. LA_F, and ΔPA vs. LA_E respectively (with 95% CI) were adjusted for multiple comparisons according to the Bonferroni method. Centre values show the average, error bars indicate standard deviation. c, A median-joining network showing the relationships among the 22 LAVA subfamilies generated by comparing the 3′ intact LAVA elements. Coloured circles represent subfamilies and their size is proportional to the number of elements in the subfamily (numbers inside each circle). Black dots represent hypothetical sequences connecting adjacent subfamilies. All possible relationships are shown. Branch lengths are not drawn to scale.
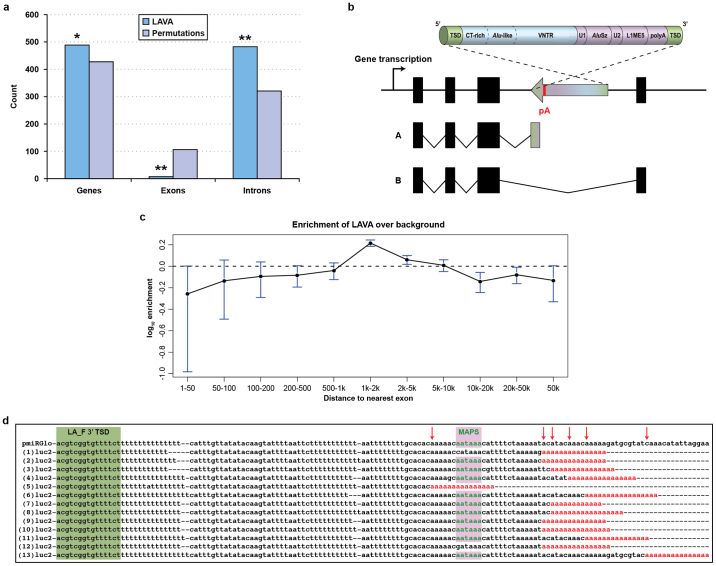
Extended Data Figure 3. Analysis of LAVA element insertion in genes and early termination of transcription.
a, The histogram shows the results of permutation analyses. We find a significant association between LAVA elements and genes. Moreover, insertions are significantly enriched in introns and depleted in exons, most probably as a result of selection against insertions in exons. b, Schematic representation of the mechanism through which LAVA intronic insertions in antisense orientation might cause early termination of transcription. The truncated transcript is indicated on the diagram as A and normal transcript indicated on the diagram as B (pA = polyadenylation site). c, We calculated the distance to the nearest exon for each intronic LAVA and compared this to what would be expected for random insertions (that is, background). We found fewer insertions than expected by chance within 1 kb of the nearest exon. d, Identification of pmiRGlo_LA_F polyadenylation sites by 3′ RACE. Alignment of thirteen 3′ RACE PCR clone sequences and the pmiRGlo_LA_F sequence. LAVA_F 3′ TSD is highlighted by dark green background; the major antisense LAVA_F polyadenylation signal (MAPS) is highlighted by red background. The termination sites are marked with arrows on the LAVA_F sequence. Poly(A) tails of the identified transcripts are in red text.
Extended Data Table 1.
Genes from the ‘microtubule cytoskeleton’ GO category with LAVA insertions
Genes highlighted in grey carry LAVA insertions that are shared, antisense, and carry a perfect antisense polyadenylation site.
Intragenic LAVA insertions were skewed toward introns (Pearson chi-squared, P = 0.0001) and were less frequent than expected when within <1 kb of the nearest exon junction (Extended Data Fig. 3). The majority (74%) of intronic LAVA elements were found in the antisense orientation. We speculated that intronic antisense LAVA insertions may cause early transcription termination by providing a polyadenylation site in the antisense orientation, as previously described for L1 elements23,24 (Extended Data Fig. 3). Indeed, we found 84.1% of the 3′-intact LAVA elements encoded a perfect polyadenylation signal at their 3′ end in antisense orientation.
To obtain experimental evidence that LAVA elements disrupt transcription, we performed a reporter assay in which the 3' end of a luciferase gene construct lacking a transcriptional termination site was fused to the 3'-terminal fragments of LAVA_E and LAVA_F elements, mimicking the arrangement observed in gibbon genes (Fig. 3b, left). Luciferase activity exceeding background level by ∼50% was observed from the LAVA_F reporter construct (Fig. 3b, right), indicating faithful termination of luciferase transcription. Furthermore, 3′ rapid amplification of cDNA ends (RACE) experiments confirmed that the transcription termination site had been supplied from the LAVA element (Extended Data Fig. 3). Thus antisense intronic LAVA insertions can cause early transcription termination with some variability possibly due to the genomic context of the polyadenylation site, which explained the difference between the two reporter constructs.
We also investigated LAVA induced early transcription termination in vivo by analyzing RNA-seq data generated for the gibbon named Asia (Supplementary Table ST2.4). Specifically, we looked for paired-end reads only partially aligning to an antisense LAVA element due to untemplated residues and then identified cases for which the presence of a poly(A) tail was preventing full-length alignment. This analysis revealed that elements from a variety of subfamilies have the potential to cause early transcription termination, including those identified for LAVA elements inserted in the microtubule cytoskeleton genes (for example, LAVA_B2R2, LAVA_C4B, LAVA_B1R2) (Extended Data Table 1). We observed that early transcription termination occurred at relatively low levels as we identified a significant number of read pairs indicative of normal transcription and splicing for LAVA-terminated genes (Supplementary Table ST7.5). This is to be expected, as full inactivation of many of these genes would be lethal. On the other hand, as alternative splicing and RNA pol II transcript termination/polyadenylation are tightly coupled processes, LAVA-mediated early transcription termination could also act by differently affecting distinct isoforms and/or influencing the ratio between isoforms. Finally, LAVA insertions may also affect gene expression by functioning as exon traps, as shown for SVA elements25. One putative example of an exon trapping event was identified for HORMAD2, a gene that monitors the formation of synapsis during crossover26 (Supplementary Information section S7, Supplementary Table ST7.6, Supplementary Fig. SF7.1–7.2).
As genome reshuffling began in the common ancestor of all extant gibbon species, LAVA insertions must have occurred in key genes before the four genera diverged. We experimentally confirmed the mode and tempo of all 23 LAVA insertions in genes from the microtubule cytoskeleton category using both site-specific PCR and in silico methods (Extended Data Figure 4) and found that most of the insertions (15/23) were shared by the four gibbon genera (Supplementary Data File 6). Eleven of the genes match the structural requirements for early transcription termination and five of them are also shared. These genes include MAP4, involved in spindle architecture and CEP164, a G2/M checkpoint gene whose inactivation results in an aberrant spindle during cell division18,19 (Extended Data Table 1).
Extended Data Figure 4. Evolution of the LAVA element.
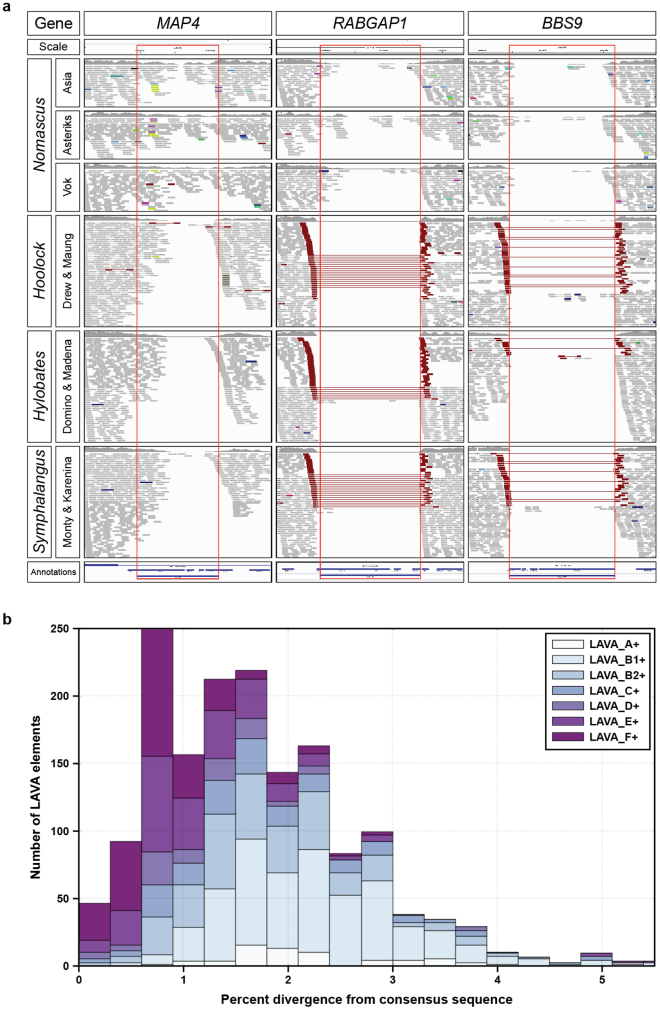
a, Screenshots from the Integrative Genomics Viewer (IGV) browser for loci MAP4, RABGAP1 and BBS9. Each column shows portions of the IGV visualization of a LAVA insertion locus identified in Nleu1.0 and its flanking sequence. Red rectangles indicate the margins of each LAVA insertion. Read pairs are coloured red when their insert size is larger than expected, indicating the presence of an unshared LAVA insertion. MAP4 is a shared LAVA insertion, whereas RABGAP1 and BBS9 are Nomascus specific. b, LAVA elements containing at least 300 bp of the LA section of LAVA were selected and reanalysed using RepeatMasker to determine subfamily affiliation and divergence from the consensus sequence. LAVA elements are grouped based upon their subfamily affiliations (see legend top right for colour scheme). The x axis shows the per cent divergence from the respective consensus sequence and the y axis shows the number of elements with a certain per cent divergence from the consensus sequence.
The complex evolutionary history of gibbons
We explored the relationship between LAVA family expansion and evolution of the gibbon lineage and, through analyses of diagnostic mutations, identified 22 LAVA subfamilies (Fig. 3c). In addition, we tested for the presence or absence of 200 LAVA loci from among the evolutionarily youngest elements in each subfamily (Extended Data Fig. 4) across 17 unrelated gibbon individuals and found that 52% of loci were shared among all four genera, whereas 27% were Nomascus specific. The remaining LAVA insertions showed a variety of confounding phylogenetic relationships consistent with incomplete lineage sorting (ILS) of ancestral polymorphisms, perhaps as a result of a rapid radiation of gibbon genera (Supplementary Information section S7; Supplementary Table ST7.1–7.2). We used a maximum likelihood method27 to obtain age estimates for the 22 LAVA subfamilies. In the case of the two oldest subfamilies, LAVA_A1 and LAVA_A2, we obtained estimates of ∼18 Myr ago and ∼17 Myr ago, respectively (Supplementary Table ST7.3). A coalescent-based methodology implemented in the software G-PhosCS28 using Nleu1.0 estimated a gibbon–great ape population divergence time of ∼16.8 Myr ago (95% confidence intervals (CI): 15.9–17.6 Myr ago) assuming a split time with macaque of 29 Myr ago (Supplementary Information section S4). Hence, the LAVA element probably originated around the time of the divergence of gibbons from the ancestral great ape/human lineage.
The evolutionary history of the gibbon lineage and, in particular, the timing and order of splitting among the four genera, is still a subject of debate29. To address this issue, we generated medium coverage (mean ∼15×) WGS short read data for two individuals from each of the four genera, including two different Hylobates species (H. moloch and H. pileatus) (Supplementary Table ST2.1–2.2). Although phylogenetic analysis of assembled whole mitochondrial DNA genomes using BEAST30 strongly supported monophyletic groupings for each gibbon genus, the branching order of the four genera remained unresolved (Supplementary Fig. SF9.1–9.2; Supplementary Information S9).
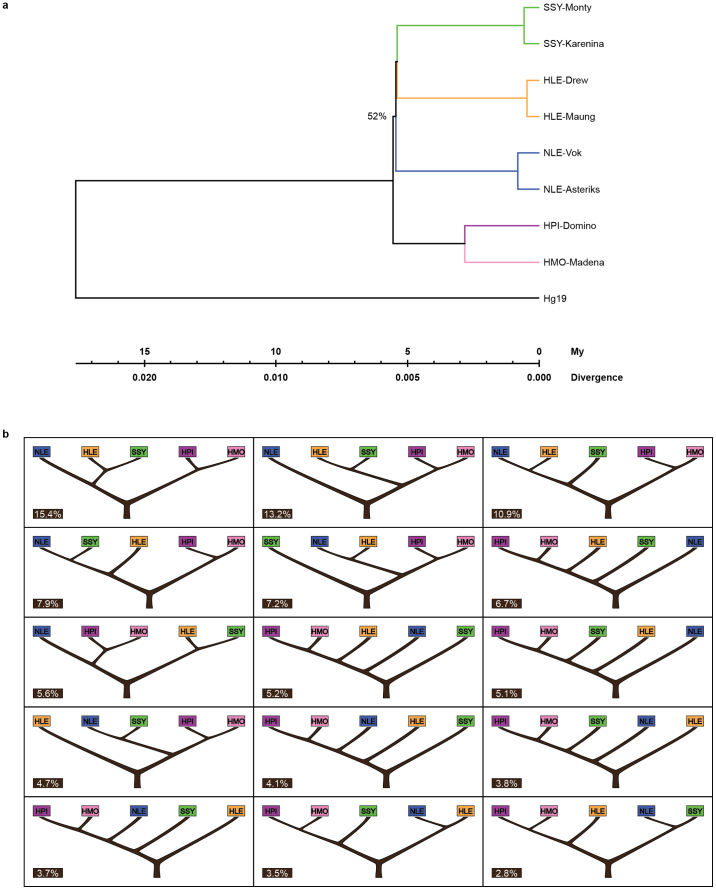
Neighbour-joining trees constructed from pairwise sequence divergence, k, across ∼11,000 genic (200 base pairs (bp)) and ∼12,000 non-genic (1 kilobase (kb)) autosomal loci supported a supermatrix sequence topology of (((Siamang (SSY), Hoolock (HLE)), Nomascus (NLE)), (H. pileatus (HPL)), H. moloch (HMO)) (Fig. 4a); nevertheless, bootstrap confidence for the node separating NLE and Hylobates was low (∼52%). This topology was also the most frequently observed when constructing k-based unweighted pair group method with arithmetic mean (UPGMA) trees along the genome using non-overlapping 100-kb sliding windows. However, all 15 possible rooted topologies for the four genera were observed at considerable frequencies (Extended Data Fig. 5), consistent with the extensive ILS observed in the LAVA element analysis.
Figure 4. Gibbon phylogeny and demography.
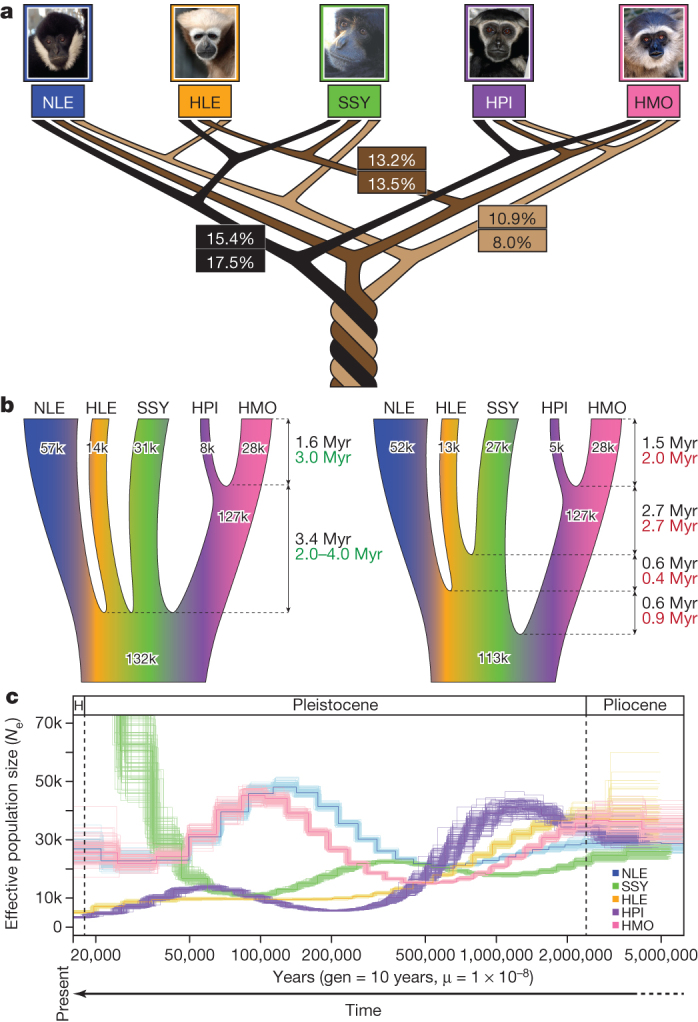
a, The three most frequently observed UPGMA gene trees (numbers at the top) constructed across the genome at 100-kb sliding windows and posterior probabilities (numbers at the bottom) for the same species topologies from a coalescent-based ABC analysis. The relatively low numbers observed suggest presence of substantial ILS amongst the gibbon genera. b, Parameters estimates describing gibbon population demography assuming an instant radiation for all four genera (left) and the most probable bifurcating species topology (right). Black, green and red numbers indicate divergence times and Ne as calculated by ABC, BEAST and G-PhoCS analysis, respectively (Supplementary Information section S9). c, PSMC analysis estimating changes in historical Ne. The large increase in Ne observed in our PSMC plot for SSY in recent times is probably exaggerated due to higher sequencing error and mapping biases in non-NLE samples (see details in Supplementary section S8). A generation time of 10 years45,46 was used to obtain a per generation mutation rate of 1 × 10⁻⁸ per year.
Extended Data Figure 5. Analysis of the phylogenetic relationships between gibbon genera.
a, Neighbour-joining trees for gibbons using non-genic loci. b, UPGMA trees for 100 kb non-overlapping sliding windows moving along the gibbon genome reporting the top 15 topologies (see also Supplementary Table ST8.3). The percentage of total support for each topology is given within each subpanel.
In order to infer the most likely bifurcating species topology amongst the four genera while taking into account ILS, we used a novel coalescent-based ABC methodology using the autosomal non-genic and genic loci (Veeramah et al., in the press) (Supplementary Information section S8). The topology described above had the highest combined posterior probability, though support was relatively low (P (model) = 17%) and other topologies, including one with NLE and Hylobates interchanged as the most external taxa, had comparable probabilities (Fig. 4a).
The estimated internal branch lengths under the best species topology using our ABC framework and G-PhoCS were very short, supporting a rapid speciation process for the four gibbon genera (Fig 4b, right). Given this observation and uncertainty in the best topology, we also estimated parameters under an instantaneous speciation model (Fig. 4b, left). Assuming an overall autosomal mutation rate of 1 × 10⁻⁹ per site per year, we placed the beginning of the speciation process at ∼5 Myr ago under both models, with the two Hylobates species diverging ∼1.5 Myr ago.
Consistent with the ABC analysis, SSY and HLE share the largest number of alleles across the whole genome (Supplementary Table ST8.5). However, NLE and the two Hylobates samples are both significantly closer to SSY than HLE as assessed by the D-statistic31. This result could be explained by two independent gene flow events between SSY and both NLE and Hylobates. However, fertile intergenic hybrids have yet to be observed either in the wild or captivity32; an alternative explanation would be long-term population structure in the gibbon ancestral population. Both the ABC and G-PhoCS analyses suggest that the ancestral gibbon effective population size (Ne) was large (80,000–130,000), but neither of these frameworks can distinguish this from a structured ancestral population.
The coalescent-based analysis (Fig. 4a), along with estimates of genome-wide heterozygosity (Supplementary Fig. ST8.2), suggests a larger long-term Ne for both N. leucogenys and H. moloch compared to the other species. Analysis using the pairwise sequentially Markovian coalescent (PSMC) model33 indicates that these two species underwent an increase in Ne during the Late Pleistocene era (500–100 thousand years ago (kyr ago) followed by a subsequent decrease in Ne 100–50 kyr ago (Fig. 4c) (Supplementary Information section S8). Fluctuation in Ne could result from changes in the actual number of individuals in the population, changes in population structure, and/or variable gene flow.
Functional sequence evolution
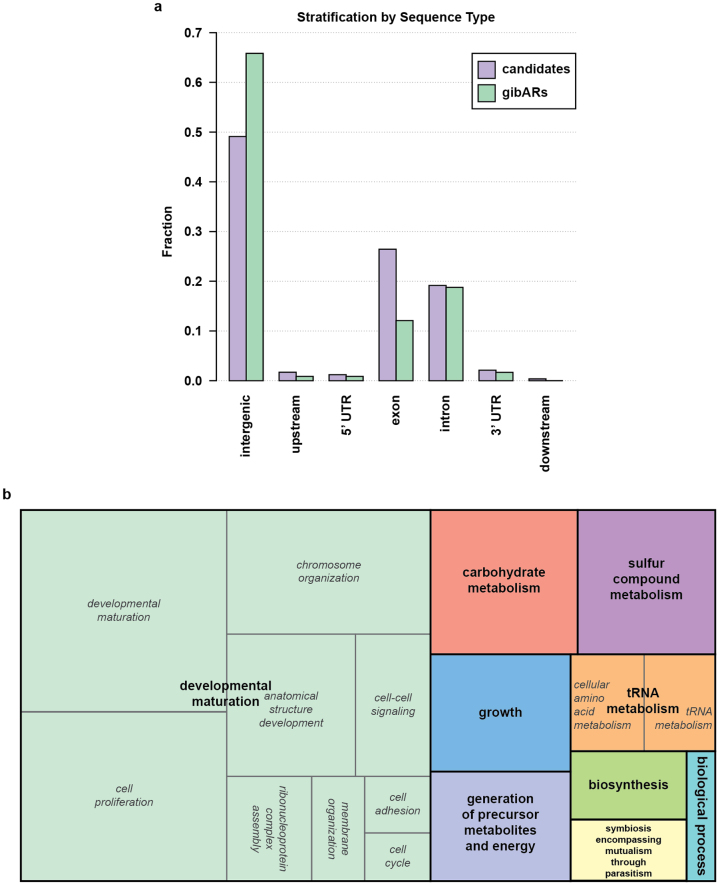
Accelerated substitution rates are a hallmark of adaptive evolution, and genomic regions with excess lineage-specific substitutions have been found to have functional roles34. We identified 240 short (153 bp) median length) regions with accelerated substitution rates in the gibbon lineage (gibARs). We observed that gibARs were primarily intergenic (66%) and tended to co-localize near the same genes as LAVA elements (P value = 81 × 10−6; odds ratio of 2.74 (95% CI: 1.79–4.07)). Consistent with this finding, a GO enrichment test for genes within ± 100 kb of each gibAR (in comparison with background genes) revealed enrichment for the ‘chromosome organization’ category (Benjamini–Hochberg false discovery rate <5%) (Extended Data Fig. 6). Given evidence of functional roles gathered for human accelerated regions35, we speculate that the gibARs may create functional elements (for example, enhancers or protein-binding domains) to modulate the transcriptional effect of local LAVA insertions (Supplementary Information section S12 and Supplementary Data File 9).
Extended Data Figure 6. Analysis of the relationship between gibbon accelerated regions (gibARs) and genes.
a, Intergenic regions are enriched in gibARs. Different sequence types are shown on the x axis and the y axis displays the fraction of gibARs and candidate regions annotated to the respective class. gibARs are significantly enriched in intergenic regions (P = 4.7 × 10⁻⁶) and significantly depleted in exons (P = 7.3 × 10⁻⁶). P values for each class were calculated with the Fisher’s exact test. Introns are comparably prevalent in candidates and gibARs, whereas in the UTR and flanking region, counts are too low to draw meaningful conclusions (data not shown). b, TreeMap from REVIGO for GOslim Biological Process terms with a Benjamini–Hochberg false discovery rate of 5%. Each rectangle is a cluster representative; larger rectangles represent ‘superclusters’ including loosely related terms. The size of the rectangles reflects the P value.
We assessed the potential presence of positive selection in 13,638 human genes with one-to-one orthologues in gibbon using a branch-site likelihood ratio test36 (Supplementary Information section S10). One of the most striking features of gibbons is their use of brachiation (arboreal locomotion using only the arms). We uncovered evidence related to traits possibly associated with this adaptation such as the gibbon’s longer arms, more powerful shoulder flexors, rotator muscles and elbow flexors37. First, some genes whose functions relate to these anatomical specializations appear to have undergone positive selection in gibbons. They include TBX5 (P value = 0.00015), required for the development of all forelimb elements38; COL1A1 (pro-alpha1 chains of type I collagen) (P value = 3.39 × 10⁻¹¹), the fibril-forming collagen that is the main protein of bones, tendons and teeth39; and CHRNA1 (acetylcholine receptor subunit alpha precursor) (P value = 0.00039), involved in skeletal muscle contraction40. These genes have not been identified as positively selected in other primates to date. We also observed that some genes involved in chondrogenesis (SNX19, ID2 and EXT1) were associated with gibARs. Finally, the chondroadherin gene (CHAD)41 coding for a cartilage matrix protein is specifically duplicated in all gibbon genera (Extended Data Fig. 2).
Discussion
Our sequencing, assembling and analysis of the gibbon genome has provided numerous insights into the accelerated evolution of the gibbon karyotype and identified genetic signatures related to gibbon biology. First, segmental duplications and repetitive sequences were the best predictors of gibbon–human breakpoints, although we excluded a causal role given the predominance of non-homology-based repair signatures. Furthermore, accelerated rearrangement was confined to large-scale chromosomal events, pointing to a mechanism responsible for causing gross chromosomal changes, rather than global genomic instability. This is in line with our hypothesis that the high rate of chromosomal rearrangements may have been due to LAVA-induced premature transcription termination of chromosome segregation genes. This effect may have occurred at a low enough level to be compatible with life but sufficient to increase the frequency of chromosome segregation errors. The link between erroneous chromosome segregation and increased chromosomal rearrangement has been recently demonstrated by others through in vitro experiments25,26.
The question remains how such a high number of chromosomal rearrangements could become fixed in such a relatively short time. One possibility is that a combination of geographic isolation and post-mating reproductive barriers accelerated the radiation of the four gibbon genera. Our estimates dated the lineage-splitting event to the Miocene–Pliocene transition, when major changes in the distribution of tropical and subtropical forests were caused by the elevation of the Yunnan plateau and rise in sea levels42,43. Furthermore, fluctuation in sea levels beginning in the Early Pliocene appears to have brought about cycles of forest fragmentation and amalgamation, leading to alternating range compression and expansion for many mammalian groups44.
Together, these results advance our knowledge of the unique traits of the small apes and highlight the complex evolutionary history of these species. Moreover, our analyses of the rearranged gibbon genome help to provide insight into the mechanisms of chromosome evolution as well as uncovering a new source of genome plasticity.
Methods Summary
Sanger-based whole-genome sequencing was performed as described for other species. The genome assembly was generated using the ARACHNE genome assembler assisted with alignment data from the human genome (Supplementary Information section S1). The source DNA for the sequencing was derived from a single female (Asia; studbook no. 0098, ISIS no. NLL605) housed at the Virginia Zoo in Norfolk, Virginia. Short-read libraries were constructed at the Oregon Health & Science University (OHSU) following standard Illumina protocols and sequenced on an Illumina HiSeq 2000. Analyses were performed with custom analysis pipelines. See Supplementary Information for additional information about the methods.
Supplementary information
This file contains Supplementary Sections 1-6 – see Supplementary Contents for details. (PDF 19003 kb)
This file contains Supplementary Data 1. (XLSX 43 kb)
This file contains Supplementary Data 2. (XLSX 164 kb)
This file contains Supplementary Data 3. (PDF 1775 kb)
This file contains Supplementary Data 4. (XLSX 175 kb)
This file contains Supplementary Data 5. (XLSX 1604 kb)
This file contains Supplementary Data 6. (PPTX 5073 kb)
This file contains Supplementary Data 7. (XLSX 6602 kb)
This file contains Supplementary Data 8. (XLSX 44 kb)
This file contains Supplementary Data 9. (PDF 2103 kb)
Acknowledgements
The gibbon genome project was funded by the National Human Genome Research Institute (NHGRI) including grants U54 HG003273 (R.A.G.) and U54 HG003079 (R.K.W.) with further support from National Institutes of Health NIH/NIAAA P30 AA019355 and NIH/NCRR P51 RR000163 (L.C.), R01_HG005226 (J.D.W., M.F.H.), NIH P30CA006973 (S.J.W.), a fellowship from the National Library of Medicine Biomedical Informatics Research Training Program (N.H.L.), R01 GM59290 (M.A.B.) and U41 HG007497-01 (M.A.B, M.K.K.), R01 MH081203 (J.M.S.), HG002385 (E.E.E.), National Science Foundation (NSF) CNS-1126739 (B.U., M.A.B., M.K.K.) and DBI-0845494 (M.W.H.), PRIN 2012 (M.R.), Futuro in ricerca 2010 RBFR103CE3 (M.V.), ERC Starting Grant (260372) and MICINN (Spain) BFU2011-28549 (T.M.-B.), grant of the Ministry of National Education, CNCS – UEFISCDI, project number PN-II-ID-PCE-2012-4-0090 (A.D.), grant of the Deutsche Forschungsgemeinschaft SCHU1014/8-1 (G.G.S.), ERC Starting and Advanced Grant and EMBO Young Investigator Award (Z.I., N.V.F.), ERC Starting Grant and EMBO Young Investigator Award (D.T.O.), Commonwealth Scholarship Commission (M.C.W.). E.E.E. is an investigator of the Howard Hughes Medical Institute. We acknowledge the contributions of the staff of the HGSC, including the operations team: H. Dinh, S. Jhangiani V. Korchina, C. Kovar; the library team: K. Blankenburg, L. Pu, S. Vattathil; the assembly team: D. Rio-Deiros, H. Jiang; the submissions team: M. Batterton, D. Kalra, K. Wilczek-Boney, W. Hale, G. Fowler, J. Zhang; the quality control team: P. Aqrawi, S. Gross, V. Joshi, J. Santibanez; and the sequence production team: U. Anosike, C. Babu, D. Bandaranaike, B. Beltran, D. Berhane-Mersha, C. Bickham, T. Bolden, M. Dao, M. Davila, L. Davy-Carroll, S. Denson, P. Fernando, C. Francis, R. Garcia III, B. Hollins, B. Johnson, J. Jones, J. Kalu, N. Khan, B. Leal, F. Legall III, Y. Liu, J. Lopez, R. Mata, M. Obregon, C. Onwere, A. Parra, Y. Perez, A. Perez, C. Pham, J. Quiroz, S. Ruiz, M. Scheel, D. Simmons, I. Sisson, J. Tisius, G. Toledanes, R. Varghese, V. Vee, D. Walker, C. White, A. Williams, R. Wright, T. Attaway, T. Garrett, C. Mercado, N. Ngyen, H. Paul and Z. Trejos. We thank Z. Ivics for providing some of the reagents. We additionally acknowledge the Production Sequencing Group at The Genome Institute. Wellcome Trust (grant numbers WT095908 and WT098051), NHGRI (U41HG007234) and European Molecular Biology Laboratory. For the production of next-generation sequences, we acknowledge the Massively Parallel Sequencing Shared Resources (MPSSR) at OHSU, the National Center of Genomic Analyses (CNAG) (Barcelona, Spain), the University of Arizona Genetics Core (UAGC), and the UCSF sequencing core. We also acknowledge the Louisiana Optical Network Institute (LONI). We thank the Gibbon Conservation Center and the Fort Wayne Children’s Zoo for providing the gibbon samples. The MAKER annotation pipeline is supported by NSF IOS-1126998.We thank T. Brown for proofreading and editing the manuscript.
Extended data figures and tables
Related audio
Researcher Lucia Carbone on what the gibbon genome reveals about the acrobatic animals
PowerPoint slides
Author Contributions
L.C. led the project and the manuscript preparation. L.C., W.C.W., K.C.W., J.R., E.E.E., T.M.-B., R.A.H., K.R.V. and M.F.H. supervised the project and contributed to overall organization of the manuscript. L.C. and T.J.M. prepared the figures. Sanger data production, assembly construction and testing was carried out by: L.F., C.F., D.M.M., L.V.N., A.C., S.L.L., L.R.L., D.P.L., W.C.W., K.C.W., J.R., S.G., L.D.W.H., D.R. and S.M. Mitochondrial genome assembly was done by Y.L. Illumina sequencing production and submission: L.C., T.M.-B., J.D.W., M.F.H., E.T., L.J.W., M.G., I.G., A.B. and J.H.-R. Samples were provided by G.S. Gene set and validation of gene models: D.B., S.W., S.S., B.A., M.M., J.He., P.F., M.S.C. and M.Y. Assembly validation: B.L.-G., J.He. and T.M.-B. BAC library generation: P.J.dJ., B.tH. and B.Z. Cytogenetic analyses: M.R., N.A. and O.C. Segmental duplications and structural variations: J.Hu., C.B., B.L.-G., J.Q., M.F.-C., G.C., F.A., M.V., T.M.-B. and E.E.E. cDNA Array CGH: L.D., M.O’B., A.K.-F. and J.M.S. Comparative analysis of gibbon chromosomal rearrangements was carried out by J.He. Breakpoint analysis: L.C., C.W.W. and L.J.W. LAVA analysis: L.C., R.A.H., T.J.M., N.H.L., L.J.W., K.A.N., K.S., A.D., M.A.B., M.K.K., J.A.W., B.U., A.S. and R.H. Luciferase assay and 3′ RACE: A.D., B.I., C.O., G.G.S., N.V.F. and Z.I. RNA-seq analysis for early transcription termination: S.J.W. and C.L.B. Short-read alignments, SNP calling and population genetics analysis (autosomal DNA): L.M.J., F.L.M., A.E.W., L.J.W., K.R.V., M.F.H. and J.D.W. Population genetics analyses (mtDNA): C.R., L.W., M.B. and T.M.-B. Positive selection analyses: G.W.C.T. and M.W.H. Gene family evolution analyses: M.W.H. and C.C. Gibbon accelerated region analyses: K.S.P. and D.K. CTCF-binding analyses: M.C.W., D.T.O., P.F., E.T., C.W.W., L.J.W., J.He. and K.B. Biogeography analysis: N.G.J. and C.R. Principal investigators: R.K.W. and R.A.G.
Accession codes
Primary accessions
GenBank/EMBL/DDBJ
Sequence Read Archive
Data deposits
The N. leucogenys WGS project has been deposited in GenBank under the project accession ADFV00000000.1. All short-read data have been deposited into the Short Read Archive (http://www.ncbi.nlm.nih.gov/sra) under the accession number SRP043117. Resources for exploring the gibbon genome are available at UCSC (http://genome.ucsc.edu), Ensembl (http://ensembl.org), NCBI (http://ncbi.nlm.nih.gov), and the Baylor College of Medicine Human Genome Sequencing Center (https://www.hgsc.bcm.edu/non-human-primates/gibbon-genome-project). This paper is dedicated to the memory of Alan R. Mootnick (1951–2011).
Competing interests
E.E.E. is on the scientific advisory board (SAB) of DNAnexus and was an SAB member of Pacific Biosciences (2009–2013) and SynapDx (2011–2013).
Footnotes
USTAR Center for Genetic Discovery, University of Utah, Salt Lake City, Utah 84112, USA.
References
- 1.Mittermeier, R. A., Rylands, A. B. & Wilson, D. E. Handbook of the Mammals of the World Vol. 3 (Lynx Edicions,. (2013)
- 2.Carbone L, et al. A high-resolution map of synteny disruptions in gibbon and human genomes. PLoS Genet. 2006;2:e223. doi: 10.1371/journal.pgen.0020223. [DOI] [PMC free article] [PubMed] [Google Scholar]
- 3.Locke DP, et al. Comparative and demographic analysis of orang-utan genomes. Nature. 2011;469:529–533. doi: 10.1038/nature09687. [DOI] [PMC free article] [PubMed] [Google Scholar]
- 4.Gibbs RA, et al. Evolutionary and biomedical insights from the rhesus macaque genome. Science. 2007;316:222–234. doi: 10.1126/science.1139247. [DOI] [PubMed] [Google Scholar]
- 5.Girirajan S, et al. Sequencing human–gibbon breakpoints of synteny reveals mosaic new insertions at rearrangement sites. Genome Res. 2009;19:178–190. doi: 10.1101/gr.086041.108. [DOI] [PMC free article] [PubMed] [Google Scholar]
- 6.Carbone L, et al. Evolutionary breakpoints in the gibbon suggest association between cytosine methylation and karyotype evolution. PLoS Genet. 2009;5:e1000538. doi: 10.1371/journal.pgen.1000538. [DOI] [PMC free article] [PubMed] [Google Scholar]
- 7.Bailey JA, Eichler EE. Primate segmental duplications: crucibles of evolution, diversity and disease. Nature Rev. Genet. 2006;7:552–564. doi: 10.1038/nrg1895. [DOI] [PubMed] [Google Scholar]
- 8.Yan CT, et al. IgH class switching and translocations use a robust non-classical end-joining pathway. Nature. 2007;449:478–482. doi: 10.1038/nature06020. [DOI] [PubMed] [Google Scholar]
- 9.Hastings PJ, Ira G, Lupski JR. A microhomology-mediated break-induced replication model for the origin of human copy number variation. PLoS Genet. 2009;5:e1000327. doi: 10.1371/journal.pgen.1000327. [DOI] [PMC free article] [PubMed] [Google Scholar]
- 10.Merkenschlager M, Odom DT. CTCF and cohesin: linking gene regulatory elements with their targets. Cell. 2013;152:1285–1297. doi: 10.1016/j.cell.2013.02.029. [DOI] [PubMed] [Google Scholar]
- 11.Schwalie PC, et al. Co-binding by YY1 identifies the transcriptionally active, highly conserved set of CTCF-bound regions in primate genomes. Genome Biol. 2013;14:R148. doi: 10.1186/gb-2013-14-12-r148. [DOI] [PMC free article] [PubMed] [Google Scholar]
- 12.Carbone L, et al. Centromere remodeling in Hoolock leuconedys (Hylobatidae) by a new transposable element unique to the gibbons. Genome Biol. Evol. 2012;4:648–658. doi: 10.1093/gbe/evs048. [DOI] [PMC free article] [PubMed] [Google Scholar]
- 13.Luan DD, Korman MH, Jakubczak JL, Eickbush TH. Reverse transcription of R2Bm RNA is primed by a nick at the chromosomal target site: a mechanism for non-LTR retrotransposition. Cell. 1993;72:595–605. doi: 10.1016/0092-8674(93)90078-5. [DOI] [PubMed] [Google Scholar]
- 14.Huang da W, Sherman BT, Lempicki RA. Systematic and integrative analysis of large gene lists using DAVID bioinformatics resources. Nature Protocols. 2009;4:44–57. doi: 10.1038/nprot.2008.211. [DOI] [PubMed] [Google Scholar]
- 15.Mostafavi S, Ray D, Warde-Farley D, Grouios C, Morris Q. GeneMANIA: a real-time multiple association network integration algorithm for predicting gene function. Genome Biol. 2008;9:S4. doi: 10.1186/gb-2008-9-s1-s4. [DOI] [PMC free article] [PubMed] [Google Scholar]
- 16.Kamburov A, Wierling C, Lehrach H, Herwig R. ConsensusPathDB—a database for integrating human functional interaction networks. Nucleic Acids Res. 2009;37:D623–D628. doi: 10.1093/nar/gkn698. [DOI] [PMC free article] [PubMed] [Google Scholar]
- 17.Baker DJ, Jin F, Jeganathan KB, van Deursen JM. Whole chromosome instability caused by Bub1 insufficiency drives tumorigenesis through tumor suppressor gene loss of heterozygosity. Cancer Cell. 2009;16:475–486. doi: 10.1016/j.ccr.2009.10.023. [DOI] [PMC free article] [PubMed] [Google Scholar]
- 18.Samora CP, et al. MAP4 and CLASP1 operate as a safety mechanism to maintain a stable spindle position in mitosis. Nature Cell Biol. 2011;13:1040–1050. doi: 10.1038/ncb2297. [DOI] [PubMed] [Google Scholar]
- 19.Leber B, et al. Proteins required for centrosome clustering in cancer cells. Sci. Transl. Med. 2010;2:33ra38. doi: 10.1126/scitranslmed.3000915. [DOI] [PubMed] [Google Scholar]
- 20.Schuyler SC, Wu YF, Kuan VJ. The Mad1–Mad2 balancing act—a damaged spindle checkpoint in chromosome instability and cancer. J. Cell Sci. 2012;125:4197–4206. doi: 10.1242/jcs.107037. [DOI] [PubMed] [Google Scholar]
- 21.Maia AR, et al. Cdk1 and Plk1 mediate a CLASP2 phospho-switch that stabilizes kinetochore-microtubule attachments. J. Cell Biol. 2012;199:285–301. doi: 10.1083/jcb.201203091. [DOI] [PMC free article] [PubMed] [Google Scholar]
- 22.Haraguchi K, Hayashi T, Jimbo T, Yamamoto T, Akiyama T. Role of the kinesin-2 family protein, KIF3, during mitosis. J. Biol. Chem. 2006;281:4094–4099. doi: 10.1074/jbc.M507028200. [DOI] [PubMed] [Google Scholar]
- 23.Han JS, Szak ST, Boeke JD. Transcriptional disruption by the L1 retrotransposon and implications for mammalian transcriptomes. Nature. 2004;429:268–274. doi: 10.1038/nature02536. [DOI] [PubMed] [Google Scholar]
- 24.Wheelan SJ, Aizawa Y, Han JS, Boeke JD. Gene-breaking: a new paradigm for human retrotransposon-mediated gene evolution. Genome Res. 2005;15:1073–1078. doi: 10.1101/gr.3688905. [DOI] [PMC free article] [PubMed] [Google Scholar]
- 25.Damert A, et al. 5′-Transducing SVA retrotransposon groups spread efficiently throughout the human genome. Genome Res. 2009;19:1992–2008. doi: 10.1101/gr.093435.109. [DOI] [PMC free article] [PubMed] [Google Scholar]
- 26.Wojtasz L, et al. Meiotic DNA double-strand breaks and chromosome asynapsis in mice are monitored by distinct HORMAD2-independent and -dependent mechanisms. Genes Dev. 2012;26:958–973. doi: 10.1101/gad.187559.112. [DOI] [PMC free article] [PubMed] [Google Scholar]
- 27.Marchani EE, Xing J, Witherspoon DJ, Jorde LB, Rogers AR. Estimating the age of retrotransposon subfamilies using maximum likelihood. Genomics. 2009;94:78–82. doi: 10.1016/j.ygeno.2009.04.002. [DOI] [PMC free article] [PubMed] [Google Scholar]
- 28.Gronau I, Hubisz MJ, Gulko B, Danko CG, Siepel A. Bayesian inference of ancient human demography from individual genome sequences. Nature Genet. 2011;43:1031–1034. doi: 10.1038/ng.937. [DOI] [PMC free article] [PubMed] [Google Scholar]
- 29.Wall JD, et al. Incomplete lineage sorting is common in extant gibbon genera. PLoS ONE. 2013;8:e53682. doi: 10.1371/journal.pone.0053682. [DOI] [PMC free article] [PubMed] [Google Scholar]
- 30.Drummond AJ, Rambaut A. BEAST: Bayesian evolutionary analysis by sampling trees. BMC Evol. Biol. 2007;7:214. doi: 10.1186/1471-2148-7-214. [DOI] [PMC free article] [PubMed] [Google Scholar]
- 31.Durand EY, Patterson N, Reich D, Slatkin M. Testing for ancient admixture between closely related populations. Mol. Biol. Evol. 2011;28:2239–2252. doi: 10.1093/molbev/msr048. [DOI] [PMC free article] [PubMed] [Google Scholar]
- 32.Hirai H, Hirai Y, Domae H, Kirihara Y. A most distant intergeneric hybrid offspring (Larcon) of lesser apes, Nomascus leucogenys and Hylobates lar. Hum. Genet. 2007;122:477–483. doi: 10.1007/s00439-007-0425-0. [DOI] [PubMed] [Google Scholar]
- 33.Li H, Durbin R. Inference of human population history from individual whole-genome sequences. Nature. 2011;475:493–496. doi: 10.1038/nature10231. [DOI] [PMC free article] [PubMed] [Google Scholar]
- 34.Prabhakar S, et al. Human-specific gain of function in a developmental enhancer. Science. 2008;321:1346–1350. doi: 10.1126/science.1159974. [DOI] [PMC free article] [PubMed] [Google Scholar]
- 35.Pollard KS, et al. An RNA gene expressed during cortical development evolved rapidly in humans. Nature. 2006;443:167–172. doi: 10.1038/nature05113. [DOI] [PubMed] [Google Scholar]
- 36.Yang Z. PAML 4: phylogenetic analysis by maximum likelihood. Mol. Biol. Evol. 2007;24:1586–1591. doi: 10.1093/molbev/msm088. [DOI] [PubMed] [Google Scholar]
- 37.Michilsens F, Vereecke EE, D’Août K, Aerts P. Functional anatomy of the gibbon forelimb: adaptations to a brachiating lifestyle. J. Anat. 2009;215:335–354. doi: 10.1111/j.1469-7580.2009.01109.x. [DOI] [PMC free article] [PubMed] [Google Scholar]
- 38.Browne ML, et al. Evaluation of genes involved in limb development, angiogenesis, and coagulation as risk factors for congenital limb deficiencies. Am. J. Med. Genet. A. 2012;158A:2463–2472. doi: 10.1002/ajmg.a.35565. [DOI] [PMC free article] [PubMed] [Google Scholar]
- 39.Marini JC, et al. Consortium for osteogenesis imperfecta mutations in the helical domain of type I collagen: regions rich in lethal mutations align with collagen binding sites for integrins and proteoglycans. Hum. Mutat. 2007;28:209–221. doi: 10.1002/humu.20429. [DOI] [PMC free article] [PubMed] [Google Scholar]
- 40.Masuda A, et al. hnRNP H enhances skipping of a nonfunctional exon P3A in CHRNA1 and a mutation disrupting its binding causes congenital myasthenic syndrome. Hum. Mol. Genet. 2008;17:4022–4035. doi: 10.1093/hmg/ddn305. [DOI] [PMC free article] [PubMed] [Google Scholar]
- 41.Hessle L, et al. The skeletal phenotype of chondroadherin deficient mice. PLoS ONE. 2013;8:e63080. doi: 10.1371/journal.pone.0063080. [DOI] [PMC free article] [PubMed] [Google Scholar]
- 42.Cane MA, Molnar P. Closing of the Indonesian seaway as a precursor to east African aridification around 3–4 million years ago. Nature. 2001;411:157–162. doi: 10.1038/35075500. [DOI] [PubMed] [Google Scholar]
- 43.Xu J.-X, Ferguson D. K, Li C-S, Wang Y.-F Late Miocene vegetation and climate of the Lühe region in Yunnan, southwestern China. Rev. Palaeobot. Palynol. 2008;148:36–59. [Google Scholar]
- 44.Woodruff D. S, Turner L. M The Indochinese–Sundaic zoogeographic transition: a description and analysis of terrestrial mammal species distributions. J. Biogeogr. 2009;36:803–821. [Google Scholar]
- 45.Harvey PH, Martin RD, Clutton-Brock TH, Smuts BB, et al. Primate Societies. 1987. Life histories in comparative perspective; pp. 181–196. [Google Scholar]
- 46.Kim SK, et al. Patterns of genetic variation within and between Gibbon species. Mol. Biol. Evol. 2011;28:2211–2218. doi: 10.1093/molbev/msr033. [DOI] [PMC free article] [PubMed] [Google Scholar]
Associated Data
This section collects any data citations, data availability statements, or supplementary materials included in this article.
Supplementary Materials
This file contains Supplementary Sections 1-6 – see Supplementary Contents for details. (PDF 19003 kb)
This file contains Supplementary Data 1. (XLSX 43 kb)
This file contains Supplementary Data 2. (XLSX 164 kb)
This file contains Supplementary Data 3. (PDF 1775 kb)
This file contains Supplementary Data 4. (XLSX 175 kb)
This file contains Supplementary Data 5. (XLSX 1604 kb)
This file contains Supplementary Data 6. (PPTX 5073 kb)
This file contains Supplementary Data 7. (XLSX 6602 kb)
This file contains Supplementary Data 8. (XLSX 44 kb)
This file contains Supplementary Data 9. (PDF 2103 kb)
Data Availability Statement
Primary accessions
GenBank/EMBL/DDBJ
Sequence Read Archive
Data deposits
The N. leucogenys WGS project has been deposited in GenBank under the project accession ADFV00000000.1. All short-read data have been deposited into the Short Read Archive (http://www.ncbi.nlm.nih.gov/sra) under the accession number SRP043117. Resources for exploring the gibbon genome are available at UCSC (http://genome.ucsc.edu), Ensembl (http://ensembl.org), NCBI (http://ncbi.nlm.nih.gov), and the Baylor College of Medicine Human Genome Sequencing Center (https://www.hgsc.bcm.edu/non-human-primates/gibbon-genome-project). This paper is dedicated to the memory of Alan R. Mootnick (1951–2011).


