Abstract
Glioblastoma, a highly malignant glioma, is resistant to both radiation and chemotherapy and is an intractable problem in clinical treatment. New therapeutic approaches are in urgent need. Calanquinone A, an herbal constituent, displayed anti-proliferative activity against glioblastoma cells, including A172, T98 and U87. Flow cytometric analysis showed an S phase arrest and a subsequent apoptosis to calanquinone A action. Further identification demonstrated a rapid increase of γH2A.X formation at S phase. The data together with comet tail formation and Chk1 activation indicated DNA damage response. N-acetyl cysteine (an antioxidant and a glutathione precursor) and exogenously applied glutathione, but not trolox (an antioxidant), completely abolished calanquinone A-induced effects. Immunofluorescence assay revealed that calanquinone A decreased the intracellular glutathione levels in both A172 and T98 cells. However, calanquinone A, by itself, did not conjugate glutathione. The data suggested that the decrease of cellular glutathione predominantly contributed to the anticancer mechanism. Furthermore, calanquinone A induced the activation of AMP-activated protein kinase (AMPK) and the inhibition of p70S6K activity. Rhodamine efflux assay showed that calanquinone A did not block efflux activity, indicating that calanquinone A was not a P-glycoprotein substrate. In summary, the data suggest that calanquinone A displays anti-glioblastoma activity through a decrease of cellular glutathione levels that subsequently induces DNA damage stress and AMPK activation, leading to cell cycle arrest at S-phase and apoptotic cell death. Furthermore, calanquinone A does not serve as a P-glycoprotein substrate, suggesting a potential for further development in anti-glioblastoma therapy.
Keywords: Calanquinone A, Glutathione, DNA damage, AMPK, Glioblastoma
1. Introduction
Glioblastoma, a highly malignant glioma, is the most aggressive primary cancer of the central nervous system and is lethal brain tumor in adults. Glioblastoma is resistant to both radiation and chemother-apy (Ziegler et al., 2008; DeAngelis, 2001). Its invasive nature is the most challenging obstacle to surgical resection. Despite great advances in the understanding of molecular basis of glioblastomas and the advances in diagnosis (Kitange et al., 2003), there has been limited improvement in outcomes for patients. Therefore, new therapeutic approaches are anxiously anticipated to be explored.
Glutathione, an endogenous antioxidant, is part of cellular defense system preventing damage to crucial cellular components resulted from lipid peroxidation and other reactive oxygen species (Marí et al., 2009; Pompella et al., 2003). Although glutathione plays a role in cell survival, it also confers resistance to cancer chemother-apeutic drugs. Increased levels of cellular glutathione may promote the survival of tumor cells, impeding chemotherapy (Balendiran et al., 2004). The modulation of glutathione levels in tumor cells through chemotherapeutic intervention may decrease the drug resistance and increase the therapeutic response (Backos et al., 2012; Balendiran et al., 2004). There are multiple lines of evidence that malignant glioma cells show a multidrug resistant phenotype associated with multidrug resistance protein (MRP) expression and high intracellular levels of glutathione (Le Jeune et al., 2004; Perek et al., 2002). The glutathione also confers the resistance to radio-therapy, a standard management of glioblastoma either alone or in combination with surgery and/or chemotherapy. Therefore, target-ing cellular glutathione may overcome the resistance to both chemotherapy and radiotherapy and provide a potential approach for the treatment of glioblastomas.
Notably, several lines of evidence suggest that glutathione depletion may decrease cellular ATP levels (Laube et al., 2006).
The changes in ATP content and in AMP/ATP ratio are critical factors in determining the activity of AMP-activated protein kinase (AMPK). AMPK, consisting of an α catalytic subunit and βγ regulatory subunits, is an evolutionary conserved sensor of cellular energy status. Low energy status that increases AMP/ATP or ADP/ ATP ratios can activate AMPK, which in turn regulates energy homeostasis by switching off ATP consuming processes and switching on catabolic pathways to generate ATP (Bao et al., 2006). Acting as a metabolic master switch, AMPK is able to regulate numerous cellular functions, including glucose uptake, fatty acid oxidation, insulin sensitivity and mitochondrial biogen-esis (O'Neill, 2013; Ojuka, 2004). Because disturbances in energy homeostasis are responsible to numerous diseases, such as obesity, type2 diabetes and cancer, AMPK has emerged as a strategic target for therapeutic development (Hardie et al., 2012). Recently, it has been demonstrated that metformin, serving as an AMPK activator, inhibits the growth of glioblastoma cells (Ferla et al., 2012). Moreover, metformin promotes differentiation of stem-like glioma-initiating cells into non-tumorigenic cells and depletes self-renewing and tumor-initiating cell population within estab-lished tumors. It has been suggested that targeting glioma-initiating cells through AMPK activation is a feasible therapeutic strategy against glioblastoma (Sato et al., 2012).
Calanquinone A, isolated from Calanthe arisanesis, has been reported to display potent cytotoxic activity against a wide variety of cancer types (Thangaraj et al., 2012; Lee et al., 2008). However, the anticancer mechanism has not been identified. In this study, the glutathione-involved effects, including DNA damage response and AMPK activation, to calanquinone A action have been exten-sively studied in glioblastoma cells. The study highlights glu-tathione being a potential target for anti-glioblastoma therapy.
2. Materials and methods
2.1. Materials
RPMI 1640 medium and fetal bovine serum (FBS) were obtained from GIBCO/BRL Life Technologies (Grand Island, NY).
Antibodies to cyclin-dependent kinase 1 (Cdk1), p70S6K, phospho-p70S6KThr389, AMPKα, phospho-AMPKαThr172, m-TOR, phospho-mTORSer2448, LKB1, phospho-LKB1Thr189, γH2A.X, phospho-Chk1 Ser345 and GAPDH were from Cell Signaling Technologies (Boston, MA). Antibodies to cyclin D1, cyclin E, cyclin A, cyclin B1, Cdk4, Cdk2 and α-tubulin and anti-mouse and anti-rabbit IgGs were obtained from Santa Cruz Biotechnology, Inc. (Santa Cruz, CA). Sulforhodamine B (SRB), N-acetyl cysteine (NAC), trolox, 20,70-dichlorofluorescin diacetate (DCF-DA), monochlorobimane, propi-dium iodide (PI) and all other chemical compounds were obtained from Sigma-Aldrich (St. Louis, MO). Calanquinone A (Fig. 1A) was totally synthesized and the structure identification and purity were also provided elsewhere (Thangaraj et al., 2012).
Fig. 1.
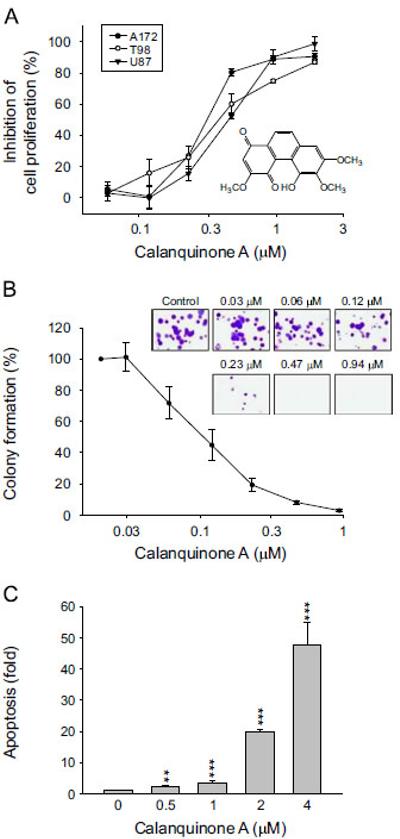
Effect of calanquinone A on cell proliferation and apoptosis of glioblastoma cells. Chemical structure of calanquinone A (A). The graded concentrations of calanquinone A were added to the cells for 48 h (A and C) or 10 days to A172 cells
(B). After the treatment, the cells were fixed and stained for SRB assay and clonogenic assay, respectively (A and B), or the DNA fragmentation was determined by the detection of nucleosomal DNA (C). Data are expressed as mean7S.E.M. of three to four determinations. nnPo0.01 and nnnPo0.001 compared with the control.
2.2. Cell lines and cell culture
A172, T98 and U87, three human cell lines derived from glioblastoma, were from American Type Culture Collection (Rock-ville, MD). Cells were cultured in RPMI 1640 medium supplemented with 10% heat-inactive FBS (v/v), penicillin (100 units/ml) and streptomycin (100 μg/ml). Cultures were maintained in a 37 °C incubator with 5% CO2.
2.3. SRB assays
Cells were seeded in 96-well plates in medium with 5% FBS. After 24 h, cells were fixed with 10% trichloroacetic acid (TCA) to represent cell population at the time of compound addition (T0). After additional incubation of 0.1% dimethylsulfoxide (DMSO) or calanquinone A 48 h, cells were fixed with 10% TCA and SRB at 0.4% (w/v) in 1% acetic acid was added to stain cells. Unbound SRB was washed out by 1% acetic acid. SRB bound cells were solubi-lized with 10 mM Trizma base. The absorbance was read at a wavelength of 515 nm. Using the following absorbance measure-ments, such as time zero (T0), control growth (C), and cell growth in the presence of calanquinone A (Tx), the percentage growth was calculated at each of the compound concentrations levels. Percen-tage growth inhibition was calculated as: [1_(Tx_T0)/(C _T0)] _ 100%. Growth inhibition of 50% (IC50) is determined at the compound concentration which results in 50% reduction of total protein increase in control cells during the compound incubation (Skehan et al., 1990).
2.4. Colony formation assay
To assess anchorage-dependent colony formation effect, the cells (100 cells/well) were seeded in a 6-well plate. After a 10-day treatment with calanquinone A, the cell colonies were rinsed with phosphate-buffered saline (PBS), stained with 0.25% crystal violet/ 20% ethanol and photographed by a camera with Copy Stan (Nikon Model No. CS-920; Shimadzu, Japan).
2.5. DNA fragmentation assay
The DNA fragmentation was determined using the Cell Death Detection ELISAplus kit (Roche, Mannheim, Germany). The assay was based on the quantitative in vitro determination of cytoplas-mic histone-associated DNA fragments (mono- and oligonucleo-somes) after induced cell death. After the treatment with calanquinone A, the cells were lysed and centrifuged, and the supernatant was used for the detection of nucleosomal DNA according to the manufacturer's protocol.
2.6. Cell cycle synchronization
Synchronization of glioblastoma cells was performed by thy-midine block. Briefly, Cells were treated with 2 mM thymidine in medium/10% FCS for 24 h. After washing cells with PBS, the block was released by the incubation of cells in fresh medium/10% FCS (indicated as time zero), and cells were harvested at 0, 3, 6, 9 and 12 h. The cell-cycle progression was detected by flow cytometric analysis.
2.7. Flow cytometric analysis of PI staining
After treatment, cells were harvested by trypsinization, fixed with 70 % (v/v) alcohol at 4 °C for 30 min and washed with PBS. The cells were centrifuged and resuspended with 0.5 ml PI solu-tion containing Triton X-100 (0.1%, v/v), RNase (100 μg/ml) and PI (80 μg/ml). DNA content was analyzed with the FACScan and CellQuest software (Becton Dickinson, Mountain View, CA).
2.8. Measurement of reactive oxygen species production and intracellular Ca2 + levels
Cells were pre-incubated with fluo-3/AM (2.5 μM, for measure-ment of Ca2+ levels) or with DCF-DA (10 μM, for measurement of reactive oxygen species production) for 30 min. The cells were washed twice and incubated in fresh medium. Vehicle (0.1% DMSO) or calanquinone A was added to the cells for the indicated times. The intracellular Ca2+ levels and reactive oxygen species production were determined by flow cytometric analysis.
2.9. Confocal immunofluorescence microscopic examination
Cells were seeded in 8-well chamber slides. After the treatment of the indicated agent, the cells were washed twice with PBS, fixed with 100% methanol at _20 °C for 5 min and incubated in 1% bovine serum albumin (BSA) containing 0.1% Triton X-100 at 37 °C for 30 min. The cells were washed twice with PBS for 5 min, stained with anti-γH2A.X antibody (1:200 dilutions) at 37 °C for 1 h and washed three times with PBS (5 min each wash). The slides were incubated with FITC-conjugated secondary antibody (1:100 dilutions) at 37 °C for 40 min. Nuclear staining was per-formed by the addition of 1 μg/ml DAPI. After three washes in PBS (5 min each wash), the cells were analyzed by a confocal laser microscopic system (Leica TCS SP2).
2.10. Comet assays
After treatment, cells were pelleted and resuspended in ice-cold PBS. Resuspended cells were mixed with 1.5% low melting point agarose and were loaded onto a fully frosted slide that had been pre-coated with 0.7% agarose and a coverslip was applied to the slide. Slides were submerged in pre-chilled lysis solution (1% Triton X-100, 2.5 M NaCl, and 10 mM EDTA, pH 10.5) for 1 h at 4 1C. After soaking with pre-chilled electrophoresis buffer (0.3 N NaOH and 1 mM EDTA) for 20 min, slides were subjected to electrophor-esis for 15 min at 0.5 V/cm (20 mA). After electrophoresis, slides were stained with 1 _ Sybr Gold (Molecular Probes) and nuclei images were visualized and captured at 400 _ magnifications with an Axioplan 2 fluorescence microscope (Zeiss) equipped with a CCD camera (Optronics). Over hundreds of cells were scored to calculate overall percentage of comet tail-positive cells.
2.11. γH2A.X- PI double staining
After treatment, the cells were pelleted, fixed with 70% (v/v) alcohol at 4 °C for 30 min and incubated in PBS/0.2% Triton X-100 at room temperature for 5 min. The cells were washed with PBS and incubated with γH2A.X antibodies (dilute in PBS/1% BSA, 1:1000) at room temperature for 1 h. The cells were washed with PBS and incubated with FITC-conjugated secondary antibody (dilute in PBS/1% BSA, 1:1000) at room temperature for 1 h. Finally, the cells were suspended with 0.5 ml PI solution. The expression of γH2A.X and cell cycle distribution were simultaneously quanti-fied and analyzed by flow cytometric analysis.
2.12. Detection of cellular glutathione
Cells were treated without or with the agent for the indicated times. Before the termination of incubation, monochlorobimane (final concentration of 100 μM) was added to the cells and incubated for the last 15 min at 37 1C. The cellular glutathione was detected by fluorescence microscopic examination.
2.13. Detection of exogenously applied glutathione
Glutathione was incubated with GST and variant concentration of calanquinone A at 37 °C for 15 min, then monochlorobimane was added. All samples were incubated at 37 °C for 10 min. The final volume of reaction was 100 μl. Final concentrations were 2.5 mM glutathione, 1 U/ml GST, and 0.5 mM monochlorobimane. Fluorescence was measured using microplate reading fluorometer at Ex/Em¼380/460 nm.
2.14. Western blotting
After treatment, the cells were harvested with trypsinization, centrifuged and lysed in 0.1 ml of lysis buffer containing 10 mM Tris–HCl (pH 7.4), 150 mM NaCl, 1 mM EGTA, 1% Triton X-100, 1 mM phenylmethylsulfonylfluoride, 10 μg/ml leupeptin, 10 μg/ml aprotinin, 50 mM NaF and 100 μM sodium orthovanadate. Total protein was quantified, mixed with sample buffer and boiled at 90 °C for 5 min. Equal amount of protein (30 μg) was separated by electrophoresis in SDS-PAGE, transferred to PVDF membranes and detected with specific antibodies. The immunoreactive proteins after incubation with appropriately labeled secondary antibody were detected with an enhanced chemiluminescence detection kit (Amersham, Buckinghamshire, UK).
2.15. Rhodamine efflux
The uptake was measured after 1 h of incubation with 5 μM rhodamine 123 at 37 1C. Efflux was determined after 1 h of incubation at 37 °C in the absence or presence of the indicated agent. Flow cytometric analysis was performed after two further washes.
2.16. Data analysis
Data are presented as the mean7S.E.M. for the indicated number of separate experiments. Statistical analysis of data for multiple groups is performed with one-way analysis of variance (ANOVA). Student's t-test is applied for comparison of two groups. P-values less than 0.05 are statistically considered significant.
3. Results
3.1. Calanquinone A displays an anti-proliferative activity in glioblastoma cells
The ability of calanquinone A to inhibit the proliferation of several glioblastoma cell lines, including A172, T98 and U87, was examined using SRB colorimetric assay. Calanquinone A induced a concentration-dependent anti-proliferative activity with IC50 values of 0.31, 0.38 and 0.45 μM, respectively (Fig. 1A). The long-term effect of calanquinone A was determined by colonogenic assay. The data demonstrated that a ten-day treatment of A172 cells with calanquinone A resulted in a profound inhibition of colony formation with an IC50 of 0.1170.02 μM (Fig. 1B). The data confirmed the anti-proliferative activity of calanquinone A. More-over, calanquinone A induced a concentration-dependent apopto-sis in A172 cells after a 48-h exposure (Fig. 1C).
3.2. Calanquinone A induces S phase arrest of the cell cycle
To determine the effect of calanquinone A on the progression of cell cycle, A172 cells were synchronized predominantly at S phase by using thymidine block treatment. Upon the release from thymidine block for 6 h, more than 90% of the cells progressed into G2 and M phases and then, the cells progressed into G1 phase gradually after the release for 9–12 h (Fig. 2A). In the presence of calanquinone A, the progression of cell cycle was significantly arrested at S phase (Fig. 2A). The protein expressions of a variety of cell cycle regulators, including cyclins, Cdks, p21 and p53, were examined accordingly. The data demonstrated that calanquinone A induced a significant increase of protein expression levels of two S phase-related cyclins, cyclin E and cyclin A (Fig. 2B).
Fig. 2.
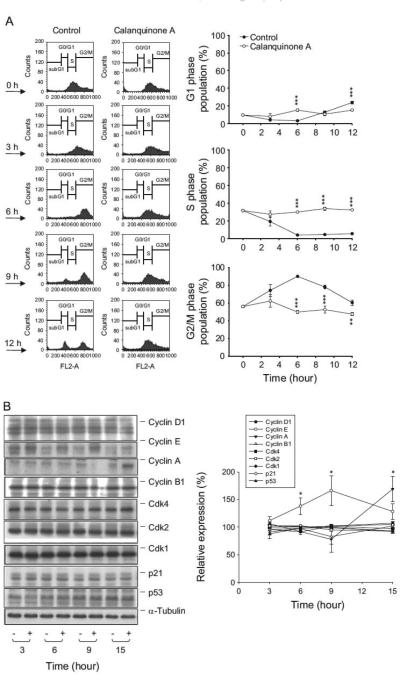
Effect of calanquinone A on cell-cycle progression and expression of cell cycle regulators. (A) Synchronization of A172 cells was performed by thymidine block as described in the Materials and Methods section. The cells were released in the absence or presence of 4 μM calanquinone A. (B) After the treatment without or with calanquinone A (4 μM), the cells were harvested and lysed for the detection of protein expression by Western blot analysis. The data are representative of three independent experiments. Data are expressed as mean7S.E.M. of three determinations. nP o0.05, nnPo0.01 and nnnPo0.001 compared with the control.
3.3. Calanquinone A imposes cellular stress and induces DNA damage
Reactive oxygen species production and overload of intracel-lular Ca2+ are two major effects associated with cellular stress caused by anticancer agents (Chiu et al., 2009). Accordingly, the fluorescent reactive oxygen species indicator DCF-DA and Ca2+ indicator Fluo-3 were used to determine the cellular stresses by using flow cytometric analysis. As a consequence, calanquinone A induced a profound increase of both reactive oxygen species production and intracellular Ca2+ levels (i.e. 8.170.7-fold increase of reactive oxygen species at 30 min, and 2.370.5-fold increase in intracellular Ca2+ at 60 min) (Supplementary Fig. 1). DNA damage response can be induced by a variety of sources. Upon sensing DNA damage, cell cycle checkpoint is activated to arrest the progression at S phase of cell cycle. Histone H2A.X is phosphorylated on the residue Ser139, termed γH2A.X, at sites of DNA damage. The data demonstrated that calanquinone A induced a rapid increase of γH2A.X formation, indicating the DNA damage insults (Fig. 3). Oxidative DNA damage has been extensively documented to be induced by reactive oxygen species through a wide variety of stimuli (De Zio et al., 2012).
Fig. 3.
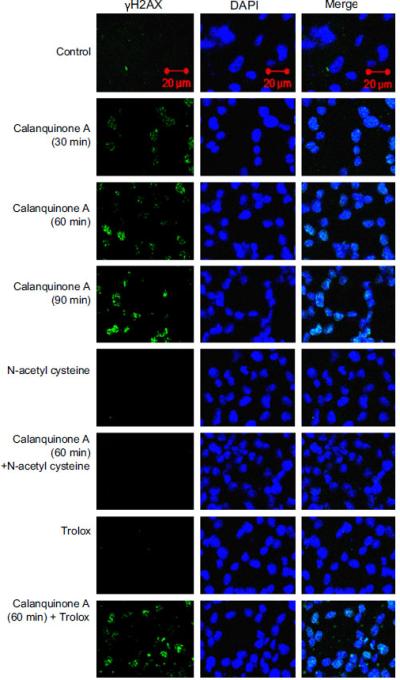
Effect of calanquinone A γH2A.X formation. A172 cells were incubated in the absence or presence of the indicated agent (calanquinone A, 4μM; N-acetyl cysteine, 1 mM; trolox 0.3 mM). The cells were fixed for the confocal fluorescence microscopic detection of γH2A.X formation (green fluorescence) in the nucleus (blue-fluorescent DAPI staining). (For interpretation of references to color in this figure legend, the reader is referred to the web version of this article.)
Two antioxidants, trolox and NAC, were used to study the functional involvement of reactive oxygen species. Trolox, a water-soluble vitamin E analog, shows antioxidant activity. It is widely used to reduce oxidative stress or damage. NAC serves as a prodrug to L-cysteine, a precursor to biologic antioxidant – glutathione. Therefore, the administration of NAC replenishes glutathione stores. It is noteworthy that NAC but not trolox completely abolished calanquinone A-mediated γH2A.X formation (Fig. 3), indicating a functional role played by glutathione other than reactive oxygen species. Comet assay (a single cell gel electro-phoresis assay) was performed to confirm the DNA damage. Similarly, calanquinone A induced a dramatic increase of comet tail, which was significantly inhibited by NAC and exogenously applied glutathione (Fig. 4A). To further determine the level of DNA damage at S phase, the fluorescence intensity with double staining of γH2A.X and DNA (by PI conjugation) was quantified using flow cytometric analysis. Calanquinone A induced an increase of γH2A.X predominantly at S phase. The effect was significantly inhibited by both NAC and exogenously applied glutathione (Fig. 4B). Altogether, the results indicate that the decrease of intracellular glutathione levels may explain calanqui-none A-induced DNA damage response at S phase.
Fig. 4.
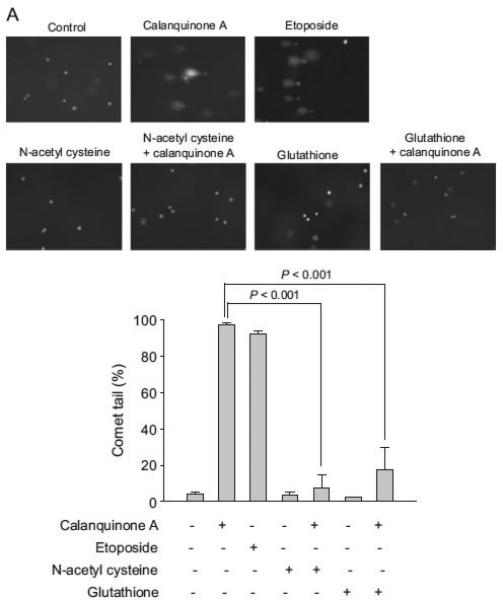
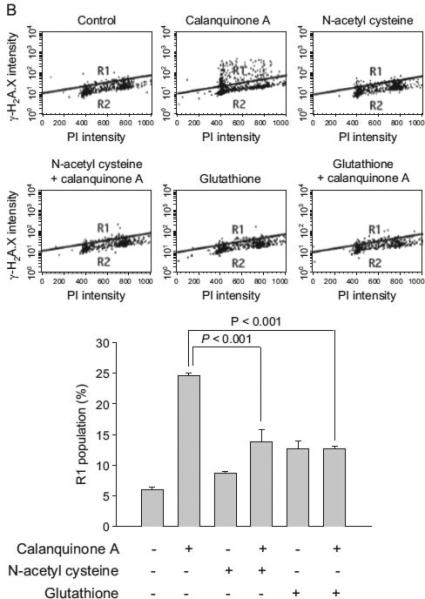
Effect of calanquinone A on DNA damage response and γH2A.X expression at S phase. (A) A172 cells were treated without or with the indicated agent (calanquinone A, 4 μM; etoposide, 50 μM; N-acetyl cysteine, 1 mM; glutathione, 0.3 mM) for 1 h. Etoposide, serving as a positive control, forms a complex with DNA and topoisomerase II and leads DNA strands to break. The comet assay was employed to examine the integrity of chromosome DNA. Comet tail-positive cells indicate under the DNA damage stress. Data are expressed as mean7S.E.M. of three independent determinations. (B) After the treatment of A172 cells with the indicated agent for 3 h, γH2A.X propidium iodide double staining was used to detect DNA damage in the S phase of the cell cycle as described in the Materials and Methods section.
3.4. Calanquinone A decreases intracellular glutathione levels
Monochlorobimane has been well identified to show high specificity for glutathione with very little binding to protein sulfhydryls (Chatterjee et al., 1999). The intracellular glutathione content was measured using fluorescence microscopic examination with monochlorobimane dye. The unbound dye was non-fluores-cent, whereas the monochlorobimane–glutathione conjugate shows blue fluorescence. As a result, calanquinone A decreased the intracellular glutathione levels in a time-dependent manner in A172 and T98 cells. The depletion activity was completely abolished by NAC (Fig. 5). The results confirmed the ability of calanquinone A in depleting cellular glutathione. However, calanquinone A, by itself, did not significantly conjugate and deplete exogenously applied glutathione (3.9% depletion at 4 mM).
Fig. 5.
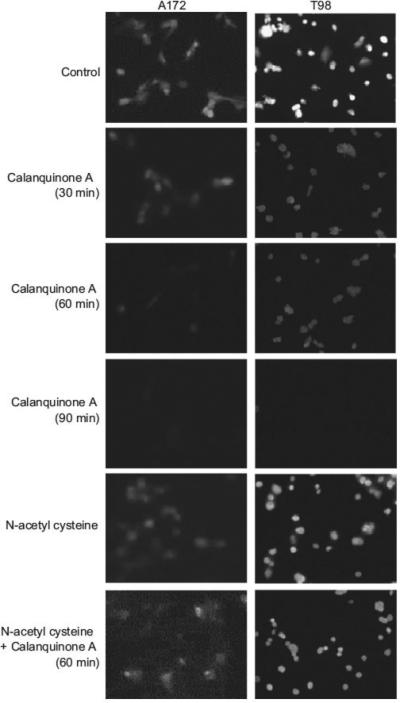
Effect of calanquinone A on cellular glutathione content. The cells were incubated in the absence or presence of the agent (calanquinone A, 4 μM; N-acetyl cysteine, 1 mM) for the indicated time. The cellular glutathione was detected by fluorescence microscopic examination of monochlorobimane staining. Data are representative of three independent experiments.
3.5. Calanquinone A regulates the activities of AMPK and p70S6K
The serine/threonine protein kinases, including LKB1, AMPK, p70S6K and mTOR, have been extensively studied to play a central role to coordinately or independently regulate translational path-ways (Hardie et al., 2012; Green et al., 2011). To examine the effect of calanquinone A on the kinase activity, the phosphorylation of the kinases at critical residues was detected by Western blot analysis. The data in Fig. 6A showed that calanquinone A induced an increase of phosphorylated AMPK levels but a decrease of phosphorylated LKB1 and p70S6K levels. However, the phosphory-lated mTOR levels were not modified by calanquinone A. The results were intriguing since the AMPK activation was not depen-dent on LKB1 activity to calanquinone A action (the result has been discussed below in the Discussion section). However, both NAC and exogenously applied glutathione completely inhibited calan-quinone A-mediated alteration of these phosphorylated kinases levels (Fig. 6B). The data suggest that cellular glutathione content may regulate LKB1-independent AMPK/p70S6K pathway but not mTOR pathway.
Fig. 6.
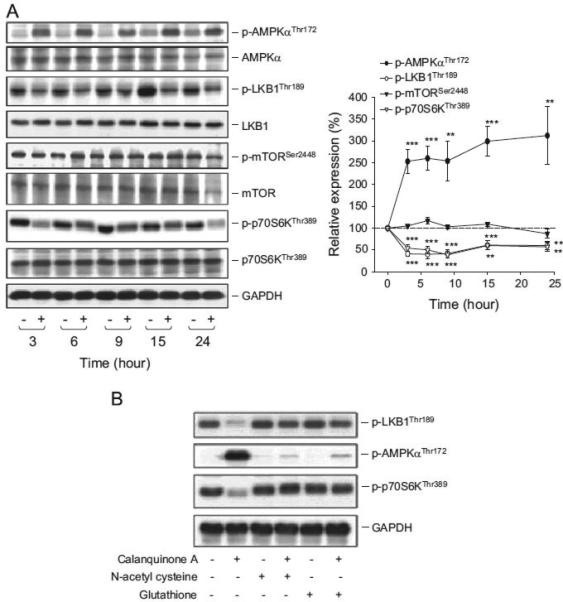
Effect of calanquinone A on the regulation of translational pathways. A172 cells were incubated in the absence or presence of calanquinone A (4 μM) for the indicated time (A) or for 3 h (B). The cells were harvested and lysed for the detection of the indicated protein expression by Western blot. The levels of protein expression were quantified using computerized image analysis system ImageQuant (Amersham Biosciences). The data representative of three to four independent experiments and are expressed as mean7S.E.M. nnPo0.01 and nnnP o0.001 compared with the control.
3.6. Calanquinone A is not a P-glycoprotein substrate
P-glycoprotein, a member of the ATP-binding cassette trans-porter superfamily, confers substrate efflux from cells, leading to a decrease of intracellular substrate concentration Schinkel and Jonker (2003). P-glycoprotein is highly expressed in luminal surface of the endothelium of brain capillary and human glioblas-tomas, and is responsible for drug resistance in chemotherapy. The fluorescent dye rhodamine 123, a P-glycoprotein substrate, was used to determine the functional activity of P-glycoprotein efflux transport system (Efferth et al., 1989). Rhodamine 123 efflux activity that was more apparent in A172 cells than that in T98 and U87 cells (Supplementary Fig. 2) and was significantly inhibited by verapamil, a P-glycoprotein substrate (Fig. 7). Calanquinone A, even at 10 μM (30 times of anti-proliferative IC50), did not modify rhodamine 123 efflux activity in A172 cells (Fig. 7) suggesting that calanquinone A was not a P-glycoprotein substrate.
Fig. 7.
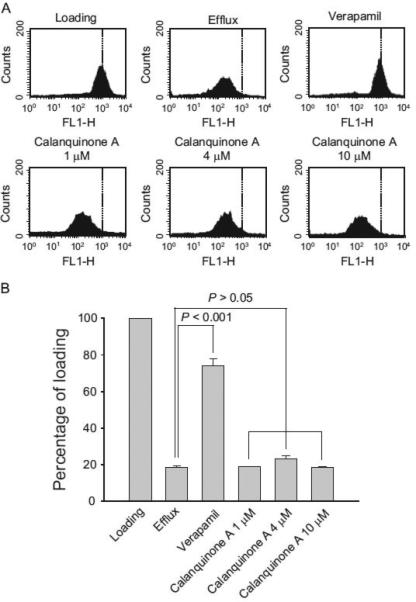
Effect of calanquinone A on rhodamine 123 efflux. A172 cells were treated without or with the indicated agent (calanquinone A, 1–10 μM; verapamil 100 μM) for 1 h. The cells were harvested for the detection of rhodamine 123 content by flow cytometric analysis. Data are expressed as mean7S.E.M. of three independent determinations.
4. Discussion
Glutathione in the reduced form is a tripeptide enzymatically constituted by glycine, cysteine and glutamate. Glutathione serves as a reducing agent and is one of the major antioxidants that tightly control the redox status in cells (Franco and Cidlowski, 2009; Circu and Aw, 2008). Glutathione synthesis is initiated by the generation of γ-glutamylcysteine that is synthesized by γ-glutamylcysteine synthetase (γ-GCS) from cysteine and glutamate. The introduction of cysteine is the rate-limiting step in glutathione production. Numerous studies show that knockdown of γ-GCS induces apoptosis in a wide spectrum of cell types (Diaz-Hernandez et al., 2005); whereas, γ-GCS over-expression promotes cell survival against cell death signaling pathways from numerous stimuli, such as TNF, JNK and mitochondrial stresses (Franco and Cidlowski, 2009; Fan et al., 2005; Botta et al., 2004). Furthermore, the starvation of cysteine has been documented to result in apoptotic cell death through glutathione depletion-mediated acti-vation of mitochondrial permeability transition (Armstrong et al., 2004). These studies have revealed a correlation between deple-tion of glutathione and induction of apoptosis. Accordingly, the modulation of glutathione levels may lead to therapeutic approach, in particular oncologic therapy, since a variety of tumor types are over-expressed with and highly demanded for cellular glutathione, including malignant glioma cells (Le Jeune et al., 2004; Perek et al., 2002). The study has provided evidence showing that a decrease of cellular glutathione levels is respon-sible to calanquinone A-induced anticancer activity against glioblastoma cells, although calanquinone A, by itself, did not conjugate and deplete glutathione. A variety of studies have reported that glutathione depletion may be associated with severe mitochondrial damage (Armstrong et al., 2004; Lee et al., 2004). However, our data show that the early exposure (up to six hours) to calanquinone A, in spite of decreasing cellular glutathione, neither modified the protein levels of Bcl-2 family members (data not shown) nor caused the loss of mitochondrial membrane potential (Supplementary Fig. 3). The compartmentalization of cellular glutathione reveals several pools of glutathione distribu-tion, including cytosol pool, mitochondrial pool and nuclear pool.
Although glutathione contents are detected predominantly in mitochondria, their subcellular distributions are dynamically changeable (Söderdahl et al., 2003). Most importantly, depletion of mitochondrial glutathione induces oxidative stress-related apoptotic cell death (Marí et al., 2009). The present data showed that reactive oxygen species production was associated with calanquinone A-mediated effect. However, the oxidative stress did not functionally contribute to the signaling pathways and apoptosis to calanquinone A action (Fig. 3). The data suggest that calanquinone A may not target mitochondria for glutathione depletion, although the subcellular target to calanquinone A action needs further elucidation.
There are several lines of evidence suggesting that an increase of intracellular Ca2+ levels is able to trigger DNA cleavage by activating a Ca2+ -dependent endonuclease (Yakovlev et al., 2000). Calanquinone A induced a profound increase of intracellular Ca2+ levels, which might contribute to the DNA damage effect. In response to DNA damage response, poly (ADP-ribose) polymerase (PARP) can catalyze the synthesis of poly (ADP-ribose). This polymer is covalently attached to several nuclear proteins and PARP itself, converting DNA breaks into intracellular signals and activating DNA repair system. Our data also demonstrated that calanquinone A induced a decrease of PARP protein expression (Supplementary Fig. 4). The decreased PARP levels might impair DNA repair activity, leading to DNA damage to calanquinone A action.
A common cellular response to stresses is the activation of cell cycle checkpoints. DNA damage checkpoints are regulatory path-ways to arrest the cell cycle responsive to DNA damage, allowing time for DNA repair. If permanent checkpoint arrest occurs upon the stimuli, the cells will enter into a cell death program. Upon the stimulation by calanquinone A, the glioblastoma cells were arrested at S phase, a common cellular response to DNA damaging stimuli. Both cyclin E and cyclin A have S phase promoting activity and are important for the onset of DNA replication and mitosis (Woo and Poon, 2003; Strausfeld et al., 1996). The effect of calanquinone A on S phase arrest was further confirmed by the significant increase of both protein levels of cyclin E and cyclin A. The comet tail was detected by a single cell gel electrophoresis assay for the identification of calanquinone A-induced DNA damage response.
Furthermore, H2A.X has been suggested to play a crucial role in checkpoint arrest of the cell cycle and is a hallmark for DNA damage response (Yuan et al., 2010). DNA damage causes rapid H2A.X phosphorylation at Ser139 (termed γH2A.X) by candidate kinases, such as ATR, ATM and DNA-PK (Tyagi et al., 2005). The rapidly recruit a variety of γH2A.X formation at sites of DNA damage can proteins for DNA repair (Yuan et al., 2010). Chk1, a downstream kinase of ATM/ATR kinase, also plays a crucial role in regulation of DNA damage checkpoint. Phosphorylation of Chk1 at Ser345 con-tributes to the kinase activation and localizes Chk1 to nucleus after checkpoint activation (Jiang et al., 2003). In this study, the expres-sion of γH2A.X (Fig. 3) and Chk1 activation (Supplementary Fig. 5) were detected for the confirmation of calanquinone A-induced DNA damage and checkpoint arrest of the cell cycle, which were also identified to be attributed to the decrease of cellular glutathione levels other than oxidative stress.
The ability of AMPK to regulate numerous bioenergetic path-ways renders it a feasible target for therapeutic treatment, including diabetes, neurodegenerative disorders and cancers (Cardaci et al., 2012). Recently, there has been much interest in the potential use of AMPK activators for cancer treatment (Hardie et al., 2012; Ferla et al., 2012; Sato et al., 2012). However, there are limited studies demonstrating the regulation between glutathione depletion and AMPK activity. Lee and the colleagues have reported that an inhibition of p70S6K activity, a downstream effector of AMPK, is associated with the depletion of cellular glutathione (Lee et al., 2006). The similar effects were detected in calanquinone A-challenged glioblastoma cells. So far, at least two kinases have been identified as upstream activators of AMPK, the tumor suppressor LKB1 and Ca2+/calmodulin-dependent protein kinase kinase β (CAMKKβ) (Hurley et al., 2005; Woods et al., 2003). LKB1, a serine/threonine protein kinase, is involved in various cellular responses such as cell polarity, cell growth and metabolism. LKB1 may autophosphorylate at Thr189 (Karuman et al., 2001) and regulate crucial cellular responses predominantly through AMPK/ mTOR signaling pathway. It can phosphorylate the catalytic α subunit of AMPK through an increase of cellular AMP/ATP ratio (Woods et al., 2003). The present data showed that calanquinone A induced the activation of AMPK that was a glutathione depletion-dependent activity. Furthermore, calanquinone A induced the increase of AMPK activity was associated with the inhibition, other than the stimulation, of LKB1 phosphorylation at Thr189. Because several kinases may contribute to the phosphorylation status of LKB1 on this residue or other residues, such as protein kinase Cζ on Ser428 (Song et al., 2008), the activity of LKB1 to calanquinone A action needs further identification. The other upstream regulator of AMPK activity is CAMKKβ. It has been evident that CAMKKβ activates AMPK through an increase of intracellular Ca2+ levels (Hurley et al., 2005). Because calanqui-none A induced an increase of intracellular Ca2+ concentration in A172 cells, CAMKKβ may play a functional role in regulating AMPK activity. However, the direct evidence has not been provided in this study.
P-glycoprotein (P-glycoprotein) belongs to a member of the ATP-binding cassette transporter superfamily which confers efflux of the substrates from intracellular to extracellular fluid, resulting in a reduction of the levels of intracellular substrate Schinkel and Jonker (2003). P-glycoprotein overexpression has been demon-strated in a lot of malignancies and is a major mechanism to develop multidrug resistance (Baguley, 2010). Several lines of evidence show that P-glycoprotein is overexpressed in most of the tumor tissues of glioblastomas and explains the disappointing overall long-term efficacy of chemotherapy (Leweke et al., 1998) since many chemotherapeutic drugs are P-glycoprotein substrates that are also capable of inducing overproduction of P-glycoprotein. In this study, rhodamine efflux assay was performed to study the resistance status of P-glycoprotein activity. The data showed that rhodamine 123 was dramatically effluxed in A172 cells. Verapamil, a P-glycoprotein substrate, significantly blocked the efflux activity. However, calanquinone A did not modify the efflux activity suggesting that calanquinone A was not a P-glycoprotein substrate.
In conclusion, the data suggest that calanquinone A displays an effective anticancer activity against glioblastoma cells through a depletion of cellular glutathione that subsequently induces DNA damage stress and AMPK activation, leading to cell cycle arrest at S-phase and apoptotic cell death. Furthermore, calanquinone A does not induce a massive mitochondrial dysfunction and is not a P-glycoprotein substrate, suggesting a potential for further devel-opment in glioblastoma therapy.
Supplementary Material
Acknowledgments
We acknowledge the support provided by the National Science Council of the Republic of China (101-2320-B-002-018-MY3 and 101-2923-B-002-008-MY3) and by the National Taiwan University (10R71809). The support by the Center for Innovative Therapeutics Discovery at National Taiwan University is also acknowledged.
References
- Armstrong JS, Whiteman M, Yang H, Jones DP, Sternberg P., Jr Cysteine starvation activates the redox-dependent mitochondrial permeability transi-tion in retinal pigment epithelial cells. Investig. Ophthalmol. Vis. Sci. 2004;45:4183–4189. doi: 10.1167/iovs.04-0570. [DOI] [PubMed] [Google Scholar]
- Backos DS, Franklin CC, Reigan P. The role of glutathione in brain tumor drug resistance. Biochem. Pharmacol. 2012;83:1005–1012. doi: 10.1016/j.bcp.2011.11.016. [DOI] [PubMed] [Google Scholar]
- Baguley BC. Multidrug resistance in cancer. Methods Mol. Biol. 2010;596:1–14. doi: 10.1007/978-1-60761-416-6_1. [DOI] [PubMed] [Google Scholar]
- Balendiran GK, Dabur R, Fraser D. The role of glutathione in cancer. Cell Biochem. Funct. 2004;22:343–352. doi: 10.1002/cbf.1149. [DOI] [PubMed] [Google Scholar]
- Bao S, Wu Q, McLendon RE, Hao Y, Shi Q, Hjelmeland AB, Dewhirst MW, Bignerm DD, Richm JN. Glioma stem cells promote radioresistance by preferential activation of the DNA damage response. Nature. 2006;444:756–760. doi: 10.1038/nature05236. [DOI] [PubMed] [Google Scholar]
- Botta D, Franklin CC, White CC, Krejsa CM, Dabrowski MJ, Pierce RH, Fausto N, Kavanagh TJ. Glutamatecysteine ligase attenuates TNF-induced mitochondrial injury and apoptosis. Free Radic. Biol. Med. 2004;37:632–642. doi: 10.1016/j.freeradbiomed.2004.05.027. [DOI] [PubMed] [Google Scholar]
- Cardaci S, Filomeni G, Ciriolo MR. Redox implications of AMPK-mediated signal transduction beyond energetic clues. J. Cell Sci. 2012;125:2115–2125. doi: 10.1242/jcs.095216. [DOI] [PubMed] [Google Scholar]
- Chatterjee S, Noack H, Possel H, Keilhoff G, Wolf G. Glutathione levels in primary glial cultures: monochlorobimane provides evidence of cell type-specific distribution. Glia. 1999;27:152–161. [PubMed] [Google Scholar]
- Chiu TH, Lai WW, Hsia TC, Yang JS, Lai TY, Wu PP, Ma CY, Yeh CC, Ho CC, Lu HF, Wood WG, Chung JG. Aloe-emodin induces cell death through S-phase arrest and caspase-dependent pathways in human tongue squamous cancer SCC-4 cells. Anticancer Res. 2009;29:4503–4511. [PubMed] [Google Scholar]
- Circu ML, Aw TY. Glutathione and apoptosis. Free Radic. Res. 2008;42:689–706. doi: 10.1080/10715760802317663. [DOI] [PMC free article] [PubMed] [Google Scholar]
- DeAngelis LM. Brain tumors. N. Engl. J. Med. 2001;344:114–123. doi: 10.1056/NEJM200101113440207. [DOI] [PubMed] [Google Scholar]
- De Zio D, Bordi M, Cecconi F. Oxidative DNA damage in neurons: implication of ku in neuronal homeostasis and survival. Int. J. Cell Biol. 2012;2012:752420. doi: 10.1155/2012/752420. [DOI] [PMC free article] [PubMed] [Google Scholar]
- Diaz-Hernandez JI, Almeida A, Delgado-Esteban M, Fernandez E, Bolanos JP. Knockdown of glutamate-cysteine ligase by small hairpin RNA reveals that both catalytic and modulatory subunits are essential for the survival of primary neurons. J. Biol. Chem. 2005;280:38992–39001. doi: 10.1074/jbc.M507065200. [DOI] [PubMed] [Google Scholar]
- Efferth T, Löhrke H, Volm M. Reciprocal correlation between expression of P-glycoprotein and accumulation of rhodamine 123 in human tumors. Antic-ancer Res. 1989;9:1633–1637. [PubMed] [Google Scholar]
- Fan Y, Wu D, Jin L, Yin Z. Human glutamylcysteine synthetase protects HEK293 cells against UV-induced cell death through inhibition of c-Jun NH2-terminal kinase. Cell Biol. Int. 2005;29:695–702. doi: 10.1016/j.cellbi.2005.04.006. [DOI] [PubMed] [Google Scholar]
- Ferla R, Haspinger E, Surmacz E. Metformin inhibits leptin-induced growth and migration of glioblastoma cells. Oncol. Lett. 2012;4:1077–1081. doi: 10.3892/ol.2012.843. [DOI] [PMC free article] [PubMed] [Google Scholar]
- Franco R, Cidlowski JA. Apoptosis and glutathione: beyond an antioxidant. Cell Death Differ. 2009;16:1303–1314. doi: 10.1038/cdd.2009.107. [DOI] [PubMed] [Google Scholar]
- Green AS, Chapuis N, Lacombe C, Mayeux P, Bouscary D, Tamburini J. LKB1/AMPK/mTOR signaling pathway in hematological malignancies: from metabolism to cancer cell biology. Cell Cycle. 2011;10:2115–2120. doi: 10.4161/cc.10.13.16244. [DOI] [PubMed] [Google Scholar]
- Hardie DG, Ross FA, Hawley SA. AMP-activated protein kinase: a target for drugs both ancient and modern. Chem. Biol. 2012;19:1222–1236. doi: 10.1016/j.chembiol.2012.08.019. [DOI] [PMC free article] [PubMed] [Google Scholar]
- Hurley RL, Anderson KA, Franzone JM, Kemp BE, Means AR, Witters LA. The Ca2+/calmodulin-dependent protein kinase kinases are AMP-activated protein kinase kinases. J. Biol. Chem. 2005;280:29060–29066. doi: 10.1074/jbc.M503824200. [DOI] [PubMed] [Google Scholar]
- Jiang K, Pereira E, Maxfield M, Russell B, Goudelock DM, Sanchez Y. Regulation of Chk1 includes chromatin association and 14-3-3 binding follow-ing phosphorylation on Ser-345. J. Biol. Chem. 2003;278:25207–25217. doi: 10.1074/jbc.M300070200. [DOI] [PubMed] [Google Scholar]
- Karuman P, Gozani O, Odze RD, Zhou XC, Zhu H, Shaw R, Brien TP, Bozzuto CD, Ooi D, Cantley LC, Yuan J. The Peutz–Jegher gene product LKB1 is a mediator of p53-dependent cell death. Mol. Cell. 2001;7:1307–1319. doi: 10.1016/s1097-2765(01)00258-1. [DOI] [PubMed] [Google Scholar]
- Kitange GJ, Templeton KL, Jenkins R. Recent advances in the molecular genetics of primary gliomas. Curr. Opin. Oncol. 2003;15:197–203. doi: 10.1097/00001622-200305000-00003. [DOI] [PubMed] [Google Scholar]
- Laube GF, Shah V, Stewart VC, Hargreaves IP, Haq MR, Heales SJ, van't Hoff WG. Glutathione depletion and increased apoptosis rate in human cystinotic proximal tubular cells. Pediatr. Nephrol. 2006;21:503–509. doi: 10.1007/s00467-006-0005-x. [DOI] [PubMed] [Google Scholar]
- Le Jeune N, Perek N, Denoyer D, Dubois F. Influence of glutathione depletion on plasma membrane cholesterol esterification and on Tc-99m-sestamibi and Tc-99mtetrofosmin uptakes: a comparative study in sensitive U-87-MG and multidrug-resistant MRP1 human glioma cells. Cancer Biother. Radiopharm. 2004;19:411–421. doi: 10.1089/cbr.2004.19.411. [DOI] [PubMed] [Google Scholar]
- Lee CL, Nakagawa-Goto K, Yu D, Liu YN, Bastow KF, Morris-Natschke SL, Chang FR, Wu YC, Lee KH. Cytotoxic calanquinone A from Calanthe arisanensis and its first total synthesis. Bioorganic Med. Chem. Lett. 2008;18:4275–4277. doi: 10.1016/j.bmcl.2008.06.099. [DOI] [PMC free article] [PubMed] [Google Scholar]
- Lee CS, Park SY, Ko HH, Han ES. Effect of change in cellular GSH levels on mitochondrial damage and cell viability loss due to mitomycin c in small cell lung cancer cells. Biochem. Pharmacol. 2004;68:1857–1867. doi: 10.1016/j.bcp.2004.06.010. [DOI] [PubMed] [Google Scholar]
- Lee SH, Seo GS, Kim HS, Woo SW, Ko G, Sohn DH. 20,40,60-Tris (methoxymethoxy) chalcone attenuates hepatic stellate cell proliferation by a heme oxygenase-dependent pathway. Biochem. Pharmacol. 2006;72:1322–1333. doi: 10.1016/j.bcp.2006.08.004. [DOI] [PubMed] [Google Scholar]
- Leweke F, Damian MS, Schindler C, Schachenmayr W. Multidrug resistance in glioblastoma. Chemosensitivity testing and immunohistochemical demonstration of P-glycoprotein. Pathol. Res. Pract. 1998;194:149–155. doi: 10.1016/S0344-0338(98)80015-0. [DOI] [PubMed] [Google Scholar]
- Marí M, Morales A, Colell A, García-Ruiz C, Fernández-Checa JC. Mitochondrial glutathione, a key survival antioxidant. Antioxid. Redox Signal. 2009;11:2685–2700. doi: 10.1089/ars.2009.2695. [DOI] [PMC free article] [PubMed] [Google Scholar]
- Ojuka EO. Role of calcium and AMP kinase in the regulation of mitochon-drial biogenesis and GLUT4 levels in muscle. Proc. Nutr. Soc. 2004;63:275–278. doi: 10.1079/PNS2004339. [DOI] [PubMed] [Google Scholar]
- O'Neill HM. AMPK and exercise: glucose uptake and insulin sensitivity. Diabetes Metab. J. 2013;37:1–21. doi: 10.4093/dmj.2013.37.1.1. [DOI] [PMC free article] [PubMed] [Google Scholar]
- Perek N, Koumanov F, Denoyer D, Boudard D, Dubois F. Modulation of the multidrug resistance of glioma by glutathione levels depletion—interaction with Tc-99MSestamibi and Tc-99M-Tetrofosmin. Cancer Biother. Radiopharm. 2002;17:291–302. doi: 10.1089/10849780260179251. [DOI] [PubMed] [Google Scholar]
- Pompella A, Visvikis A, Paolicchi A, De Tata V, Casini AF. The changing faces of glutathione, a cellular protagonist. Biochem. Pharmacol. 2003;66:1499–1503. doi: 10.1016/s0006-2952(03)00504-5. [DOI] [PubMed] [Google Scholar]
- Sato A, Sunayama J, Okada M, Watanabe E, Seino S, Shibuya K, Suzuki K, Narita Y, Shibui S, Kayama T, Kitanaka C. Glioma-initiating cell elimination by metformin activation of FOXO3 via AMPK. Stem Cells Translat. Med. 2012;1:811–824. doi: 10.5966/sctm.2012-0058. [DOI] [PMC free article] [PubMed] [Google Scholar]
- Schinkel AH, Jonker JW. Mammalian drug efflux transporters of the ATP binding cassette (ABC) family: an overview. Adv. Drug Deliv. Rev. 2003;55:3–29. doi: 10.1016/s0169-409x(02)00169-2. [DOI] [PubMed] [Google Scholar]
- Skehan P, Storeng R, Scudiero D, Monks A, McMahon J, Vistica D, Warren JT, Bokesch H, Kenney S, Boyd MR. New colorimetric cytotoxicity assay for anticancer-drug screening. J. Natl. Cancer Inst. 1990;82:1107–1112. doi: 10.1093/jnci/82.13.1107. [DOI] [PubMed] [Google Scholar]
- Söderdahl T, Enoksson M, Lundberg M, Holmgren A, Ottersen OP, Orrenius S, Bolcsfoldi G, Cotgreave IA. Visualization of the compartmentalization of glutathione and protein-glutathione mixed disulfides in cultured cells. FASEB J. 2003;17:124–126. doi: 10.1096/fj.02-0259fje. [DOI] [PubMed] [Google Scholar]
- Song P, Xie Z, Wu Y, Xu J, Dong Y, Zou MH. Protein kinase Czeta-dependent LKB1 serine 428 phosphorylation increases LKB1 nucleus export and apoptosis in endothelial cells. J. Biol. Chem. 2008;283:12446–12455. doi: 10.1074/jbc.M708208200. [DOI] [PMC free article] [PubMed] [Google Scholar] [Retracted]
- Strausfeld UP, Howell M, Descombes P, Chevalier S, Rempel RE, Adamczewski J, Maller JL, Hunt T, Blow JJ. Both cyclin A and cyclin E have S-phase promoting (SPF) activity in Xenopus egg extracts. J. Cell Sci. 1996;109:1555–1563. doi: 10.1242/jcs.109.6.1555. [DOI] [PubMed] [Google Scholar]
- Thangaraj S, Tsao WS, Luo YW, Lee YJ, Chang CF, Lin CC, Uang BJ, Yu CC, Guh JH, Teng CM. Total synthesis of moniliformediquinone and calanquinone A as potent inhibitors for breast cancer. Tetrahedron. 2012;67:6166–6172. [Google Scholar]
- Tyagi A, Singh RP, Agarwal C, Siriwardana S, Sclafani RA, Agarwal R. Resveratrol causes Cdc2-tyr15 phosphorylation via ATM/ATR-Chk1/2-Cdc25C pathway as a central mechanism for S phase arrest in human ovarian carcinoma Ovcar-3 cells. Carcinogenesis. 2005;26:1978–1987. doi: 10.1093/carcin/bgi165. [DOI] [PubMed] [Google Scholar]
- Woo RA, Poon RY. Cyclin-dependent kinases and S phase control in mammalian cells. Cell Cycle. 2003;2:316–324. [PubMed] [Google Scholar]
- Woods A, Johnstone SR, Dickerson K, Leiper FC, Fryer LG, Neumann D, Schlattner U, Wallimann T, Carlson M, Carling D. LKB1 is the upstream kinase in the AMP-activated protein kinase cascade. Curr. Biol. 2003;13:2004–2008. doi: 10.1016/j.cub.2003.10.031. [DOI] [PubMed] [Google Scholar]
- Yakovlev AG, Wang G, Stoica BA, Boulares HA, Spoonde AY, Yoshihara K, Smulson ME. A role of the Ca2+/Mg2+-dependent endonuclease in apoptosis and its inhibition by Poly(ADP-ribose) polymerase. J. Biol. Chem. 2000;275:21302–21308. doi: 10.1074/jbc.M001087200. [DOI] [PubMed] [Google Scholar]
- Yuan J, Adamski R, Chen J. Focus on histone variant H2AX: to be or not to be. FEBS Lett. 2010;584:3717–3724. doi: 10.1016/j.febslet.2010.05.021. [DOI] [PMC free article] [PubMed] [Google Scholar]
- Ziegler DS, Wright RD, Kesari S, Lemieux ME, Tran MA, Jain M, Zawel L, Kung AL. Resistance of human glioblastoma multiforme cells to growth factor inhibitors is overcome by blockade of inhibitor of apoptosis proteins. J. Clin. Invest. 2008;118:3109–3122. doi: 10.1172/JCI34120. [DOI] [PMC free article] [PubMed] [Google Scholar]
Associated Data
This section collects any data citations, data availability statements, or supplementary materials included in this article.


