Abstract
A sheath-flow surface-enhanced Raman scattering (SERS) detector is demonstrated to provide chemical information enabling identification of the 20 proteinogenic L-amino acids separated by capillary zone electrophoresis (CZE). Amino acids were used to illustrate the chemical specificity of SERS detection from structurally related molecules. Analysis of the SERS electropherograms obtained from the separation and sequential online detection of six groups of structurally related amino acids shows that our sheath-flow SERS detector is able to resolve the characteristic Raman bands attributed to the amine, carboxyl, and side chain constituents. The results demonstrate the chemical information available from our detector and also provide insight into the nature of the analyte interaction with the silver SERS substrate. The spectra extracted from the SERS electropherogram of a mixture containing the 20 proteinogenic L-amino acids show unique signatures characteristic to each amino acid, thus enabling identification. The results presented here demonstrate the potential of this sheath-flow SERS detector as a general purpose method for high throughput characterization and identification following separations of complex biomolecular mixtures.
Introduction
Chemical analysis of complex samples often involves a separation followed by detection. Common analytical separations in solution include liquid chromatography (LC) and capillary zone electrophoresis (CZE).1, 2 As flexible separation techniques, LC and CZE can easily be integrated to various detection platforms, including microfluidic devices.3–5 Advances in chemical analysis require improved separations but also highly sensitive and chemically specific detectors.
Mass spectrometry is commonly considered the gold standard as it provides exquisite analyte identification based on mass-to-charge ratios.6 However, the cost of high-resolution mass spectrometers, challenges in differentiating structurally related molecules such as isobaric compounds, and ion suppression can limit the utility of this approach for characterization.7–9 Moreover, the interface between the separation and the mass spectrometer often poses a challenge in instrumental design.10, 11 The development of alternative detectors would improve routine analysis.
Optical methods of detection are appealing because they are typically nondestructive, readily incorporated with solutions within a capillary flow, and often inexpensive. Common optical detection methods include laser-induced fluorescence (LIF) and UV-visible absorption.12 Despite its high degree of sensitivity, LIF requires inclusion of a fluorophore in the system under investigation.13–16 On the other hand, on-column UV-visible absorption offers a low cost and flexible alternative but suffers from lack of molecular specificity and lower sensitivity.17, 18 These two techniques are therefore of limited use for identifying unknown compounds since extensive knowledge of the samples is required beforehand. As a result, there is a critical need for high-throughput detection techniques capable of providing chemical and structural information with high sensitivity and selectivity beyond retention or migration times.
Raman is an intriguing option for separations detection because it is readily incorporated to detect molecules flowing through capillaries and provides label-free structural and quantitative information about a variety of molecules with a higher degree of chemical specificity than UV-visible absorption.19 In principle, the chemical information available from Raman could also facilitate identification of analytes in mass spectrometry experiments. However, normal Raman detection is generally limited to concentrations of 10−2 – 10−3 M.20 The low sensitivity of Raman has limited its general implementation for online detection. Using resonance Raman, Morris and colleagues were able to detect 10−7 M methyl orange in a CZE experiment.21 Other approaches, such as using fractionation to enable longer signal acquisitions22 or preconcentration with isotachophoresis,20 have been employed to increase sensitivity. SERS has become an effective method of obtaining high sensitivity Raman spectra.23–28 Different research groups have used online SERS with separations to detect model analytes, commonly rhodamine dyes, down to concentrations of 10−6 M;29, 30 however, SERS studies on more common molecules are lacking. One example, of which we are aware, detected 10−6 M nucleotides in LC fractions by SERS with 20 s signal acquisitions.22 Our recent work demonstrated that sheath-flow SERS detection lowers the limit of detection of rhodamine to concentrations of 10−9–10−10 M and enables high throughput online detection in CZE.31, 32 This suggests that sheath-flow SERS may enable high sensitivity characterization of more common analytes.
This report expands on our previous studies and shows that SERS can be integrated online with CZE for the detection and identification of biologically relevant molecules in complex mixtures. Herein we demonstrate the use of our previously reported sheath-flow SERS detector to characterize and identify the 20 proteinogenic amino acids separated by CZE. Amino acids are known to play central roles as intermediates in metabolism and determine the biological activity of proteins,37 and thus provide a straightforward proof-of-concept system to illustrate the chemical specificity of a new detector. The current study provides the first report on the detection of amino acids by SERS in flow. We present a novel approach that enables a fast, high throughput, reproducible, and chemical specific online SERS-based detection. Using this approach, we are able to characterize and identify the twenty proteinogenic amino acids separated by CZE in a single separation.
Experimental Methods
Materials and Reagents
L-amino acids (~99%) and sodium tetraborate decahydrate (>99.5%) were purchased from Sigma-Aldrich (St. Louis, MO). Ultrapure water (18.2 MΩ cm) was obtained from a Barnstead Nanopure filtration system. All other chemicals were of analytical grade and used without any further purification.
SERS Substrate Fabrication
SERS-active substrates were fabricated by thermal evaporation of silver onto a commercial anodized aluminum oxide filter (Anodisc 13, Whatman) with 0.1 μm pores according to previously published procedures.38 Further details on the nanofabrication of the substrates are provided in the ESI.
SERS Flow Cell Preparation
SERS-active substrates were incorporated into a custom-built flow cell by affixing individual substrates onto a standard microscope glass slide, as described before,31 and shown in Figure S-1 (ESI). One end of a 72 μm i.d., 143 μm o.d. fused silica capillary was affixed to the SERS substrate. The other end of the capillary was inserted into a custom-made injection block, which can provide pressure drive flow for sample injection at a flow rate of 1μL/min and apply high voltage for the CE separation.39 The inlet port located on the base plate of the custom-built flow cell was connected to a syringe pump system (Model NE-500 OEM, New Era Pump Systems Inc., Farmingdale, NY) controlled by Lab View (National Instruments, Austin, TX). Hydrodynamic focusing of the sample stream inside the flow chamber was accomplished by pumping the sheath fluid (15 mM sodium tetraborate decahydrate buffer, pH 9.4) continuously at a flow rate of 10 μL/min through the flow channel. The outlet port was used as the flow channel drain into a waste reservoir.
CZE-SERS Setup
The sheath flow SERS detector was coupled online to a CZE system as previously described.32 Capillary zone electrophoresis was performed in positive mode by applying a constant potential of 15 kV to a Pt electrode embedded in the custom-made injection block using a Spellman, CZE 1000R power supply (Spellman High Voltage Electronics Corp., Hauppauge, NY). The home-built flow cell was grounded directly from the substrate during the CZE separations. Sample injection was performed using a 2 s pressure injection, which injects ~34 nL of sample. Following injection, the sample was replaced with sodium tetraborate decahydrate buffer (pH 9.4) in the injection block and 15 kV (~40 μA, 300 V cm−1) was applied to the Pt electrode at the sample end of the capillary. Additional details are provided in the ESI.
Raman Spectroscopy
Raman measurements were performed using a previously described home-built instrument.38 Laser excitation was provided by a 632.8 nm HeNe laser. The incident beam was delivered to the sample through a 40X water-immersion objective (Olympus, NA=0.8). The laser illumination was focused to a spot size of approximately 0.4 μm2. The laser power used was 1.2 mW, as measured at the sample. Raman back-scattering signal was collected in the same objective lens and directed to the spectrograph and EMCCD (Newton 970, Andor). 4000 spectra were recorded in kinetic series with 100 ms acquisition times between 2000 and 500 cm−1. The spectral resolution of the home-built Raman instrument is about 3 cm−1 based on the grating (600 groves/mm), entrance slit (25 μm), monochromator pathlength (320 mm) and CCD pixel size.
Data Analysis
Band height and peak frequency determination were performed using MATLAB (R2012a, The Mathworks Inc., Natwick, MA). Baseline correction (Weighted Least Squares, Whittaker filter, 2nd order) and data smoothing (Savitsky-Golay, 3 points, 0th order) were performed on the SERS electropherograms using automated scripts in PLS Toolbox version 6.2 (Eigenvector Research Inc., Wenatchee, WA) operating in a MATLAB environment. SERS electropherograms were created by plotting the Raman intensity on the z-axis as a function of Raman shift on the y-axis and the migration time along the x-axis. To highlight the spectral features, the contrast minimum and maximum in each SERS electropherogram was adjusted based on the experimentally observed noise level (σ). The SERS electropherograms threshold was set so that only bands with signal > 4σ appear in black on the white background. The total photon electropherogram (TPE) shown in Figure 7B was created by adding the photons detected at all Raman shifts during each time point of the experiment.
Figure 7.
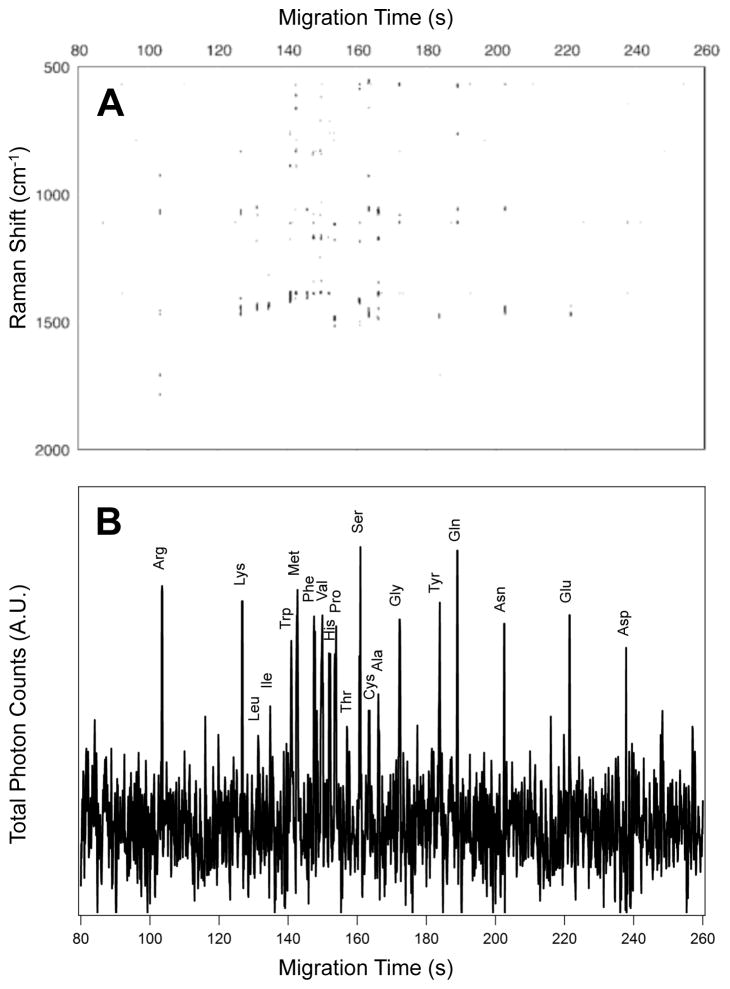
(A) The SERS electropherogram following the electrophoretic separation of the twenty proteinogenic L-amino acids indicates that Arg migrates at tm = 108.8 s, Lys migrates at tm = 110.2 s, Leu migrates at tm = 112.1 s, Ile migrates at tm = 113.1 s, Trp migrates at tm = 116.9 s, Met migrates at tm = 119.7 s, Phe migrates at tm = 121.0 s, Val migrates at tm = 124.3 s, His migrates at tm = 126.7 s, Pro migrates at tm = 127.6 s, Thr migrates at tm = 129.1 s, Ser migrates at tm = 131.5 s, Cys migrates at tm = 132.2 s, Ala migrates at tm = 134.8 s, Gly migrates at tm = 136.5 s, Tyr migrates at tm = 176.2 s, Gln migrates at tm = 180.7 s, Asn migrates at tm = 194.6 s, Glu migrates at tm = 207.6 s, and Asp migrates at tm = 214.2 s. The signal threshold (>4σ) was set to 1250 counts. (B) Total photon electropherogram (TPE) showing the photons detected at all Raman shifts as a function of migration time. The concentration of each amino acid in this mixture is 5.0×10⁻⁵ M. The SERS signal generated by the elution of each amino acid in the detection volume persists for less than 500 ms at these concentrations.
Results and Discussion
The twenty proteinogenic L-amino acid solutions were prepared by dissolving respective amounts of each amino acid in 15 mM sodium tetraborate decahydrate buffer (pH 9.4) as stock solutions with a concentration of 10−3 M. In the current investigation, the L-amino acids were divided into 6 groups of structurally-related amino acids: the aromatic side chain amino acids (phenylalanine, tryptophan, and tyrosine), the acidic and amide side chain amino acids (asparagine, aspartic acid, glutamic acid, and glutamine), the basic side chain amino acids (arginine, histidine, and lysine), the sulfur-containing side chain amino acids (cysteine and methionine), the aliphatic side chain amino acids (alanine, glycine, isoleucine, leucine, proline, and valine), and the alcoholic side chain amino acids (serine and threonine).
Aromatic Side Chain Amino Acids
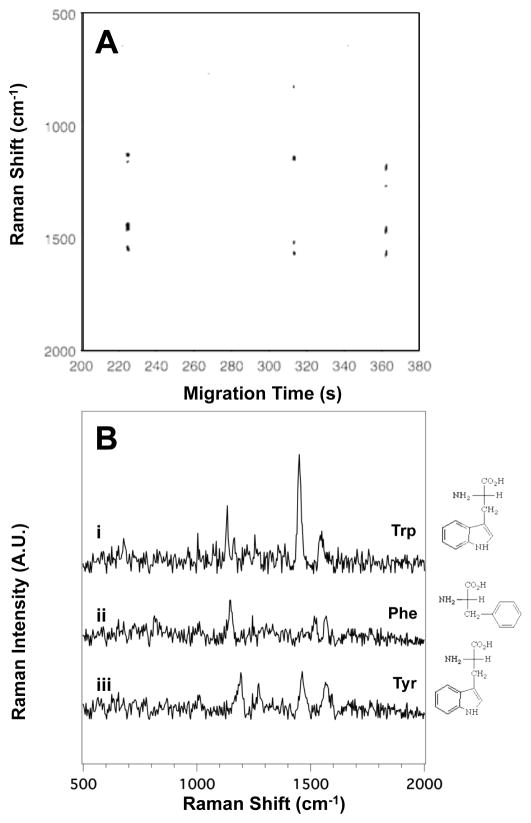
Of all the amino acids, the aromatic side chain amino acids have without a doubt been the most studied by SERS. The aromatic constituents in the side chains of these molecules are known to provide distinct vibrational modes specific to each aromatic amino acid. Figure 1A shows the SERS electropherogram of the three aromatic amino acids (phenylalanine, tryptophan, and tyrosine). The electropherogram shows signals associated with tryptophan (Trp) at tm = 224 ± 6 s, phenylalanine (Phe) at tm = 310 ± 11 s, and tyrosine (Tyr) at tm = 361 ± 8 s. The SERS signal generated by the elution of each amino acid in the detection volume persists for less than 1s, indicating the SERS detector is only sensitive to the most concentrated portion of the analyte migration band.32 Figure 1B shows the averaged SERS spectra of (i) Trp, (ii) Phe, and (iii) Tyr extracted from the SERS electropherogram shown in Figure 1A.
Figure 1.
(A) The SERS electropherogram of the three aromatic side chain amino acids indicates that Trp migrates at tm = 224 ± 6 s, Phe at tm = 310 ± 11 s, and Tyr at tm = 361 ± 8 s. The signal threshold (>4σ) was set to 250 counts. (B) Averaged SERS spectra of (i) Trp, (ii) Phe, and (iii) Tyr were extracted from the electropherogram in (A) between 223.5 and 224.5 s, 312.3 and 313.1 s, and 361.1 and 362.1 s, respectively. The amino acid concentration in this mixture is 3.3×10⁻⁴ M.
The number and position of the bands in the SERS spectra shown in Figure 1B are in agreement with those reported from SERS studies of aromatic amino acids.36, 40–45 A complete table of the observed bands in the SERS spectra of the aromatic side chain amino acids shown in Figure 1B, with their literature assignments, is provided in Table S1 in the ESI.
Although the SERS spectra of the aromatic amino acids share some spectral similarities, they can be readily distinguished by the positions of the bands attributed to the aromatic constituents in the side chain of the molecules. The prominent ring vibrations of Trp are observed at 1165 (ring C-H bending), 1356 (pyrrole ring stretching), and 1552 cm−1 (ring stretching).41, 42, 44–48 There are other features present near the limit of detection, including the bands at 677 (ring C-H deformation), 1004 (symmetric ring C-C stretch), and 1134 cm−1 (NH3+ rocking mode).43, 49 The SERS spectrum of Phe shows prominent features at 1142 (NH3+ rocking), 1516 (NH3+ deformation), and 1564 cm−1 (ring stretching mode).41, 43, 45, 47–52 Weak bands near the noise limit are observed at 1244 (ring stretching mode), and 813 cm−1 (CH2 rocking).41, 43, 45, 47–53 The SERS spectrum of Tyr shows peaks at 1193 (C-C stretching), 1272 (CH2 wag), 1463 (CH2 scissoring), and 1564 cm−1 (ring stretching).41, 44, 45, 47, 48, 54 The symmetric ring C-C stretch at 1004 cm−1 is possibly observed near the noise level. While unique bands, such as the Cβ-Cγ stretching mode at 1193 cm−1 for Tyr can be used as markers, it is the aggregate signal observed for each amino acid that enables identification.
Acidic and Amide Side Chain Amino Acids
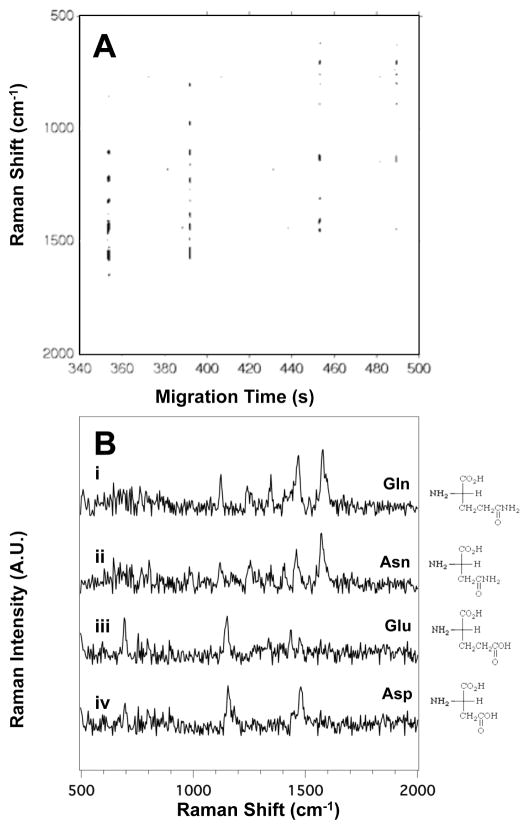
Figure 2A illustrates the SERS electropherogram of the four acidic and amide side chain amino acids: asparagine (Asn), aspartic acid (Asp), glutamic acid (Glu), and glutamine (Gln). The electropherogram indicates the detection of Gln at tm = 353 ± 12s, Asn at tm = 391 ± 8 s, Glu at tm = 460 ± 10 s, and Asp at tm = 490 ± 14 s.
Figure 2.
(A) The SERS electropherogram of the four acidic and amide side chain amino acids indicates that Gln migrates at tm = 350 ± 12s, Asn at tm = 391 ± 8 s, Glu at tm = 460 ± 10 s, and Asp at tm = 490 ± 14 s. The signal threshold (>4σ) was set to 530 counts. (B) Averaged SERS spectra of (i) Gln, (ii) Asn, (iii) Glu, and (iv) Asp were extracted from the electropherogram in (A) between 352.6 and 353.2 s, 391.2 and 391.8 s, 456.2 and 457.0 s, and 487.9 and 488.8 s, respectively. The amino acid concentration in this mixture is 2.5×10⁻⁴ M.
Figure 2B shows the averaged SERS spectra of (i) Gln, (ii) Asn, (iii) Glu, and (iv) Asp extracted from Figure 2A. As expected based on their structure similarities, the SERS spectra of Gln and Asn, as well as Glu and Asp, share a number of common bands. Table S2 in the ESI summarizes the observed bands in the SERS spectra of the acidic and amide side chain amino acids shown in Figure 2B along with their literature assignments.
Specific bands are observed that enable differentiation of the four analytes. For example, the bands at 1123 and 1575 cm−1 in the SERS spectra shown in Figure 2B(i) and (ii) are attributed to the rocking mode of NH3+ and the COO− deformation in Asn and Gln, suggesting that these functional groups are interacting with the surface.43 These vibrations are intrinsic to the carboxiamide group in these two amino acids.
The spectral features differentiating Asn and Gln are the intensity of the CH2 bending and scissoring modes at 1248 and 1465 cm−1.43 Since Gln contains an additional methylene group, the intensity of the band at 1248 cm−1 is the same in both spectra but the band at 1465 cm−1 is more intense in the SERS spectrum Gln (Figure 2B, i). The 1465 cm−1 band arises from CH2 groups, and a greater spectral contribution is expected for Gln. Thus we assign spectrum (i) to Gln and (ii) to Asn.
Glu and Asp have acidic side chains; the difference in structure between them being an additional methylene group in Glu. Differences in the intensity of the bands assigned to the CH2 scissoring modes at 1437 and 1473 cm−1 enable assignments.43 As evident in Figure 2B, these two bands are more intense in the SERS spectrum of Glu than in the SERS spectrum of Asp. The COO− deformation at 692 cm−1 is a fairly unique signal in the SERS spectra of Glu and Asp, which helps distinguish these two amino acids from others.49
Basic Side Chain Amino Acids
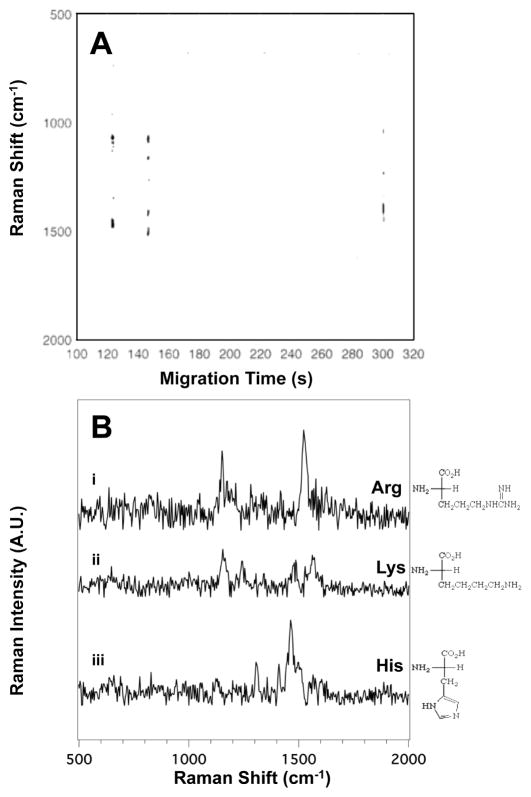
Figure 3A shows the SERS electropherogram of the three basic side chain amino acids: arginine (Arg), histidine (His), and lysine (Lys). The Raman signal observed indicates that Arg migrates at tm = 123 ± 4 s, Lys migrates at tm = 146 ± 7 s, and His at tm = 299 ± 9 s. Figure 3B shows the averaged SERS spectra of (i) Arg, (ii) Lys, and (iii) His extracted from the heatmap shown in Figure 3A. A complete table of the observed bands in the SERS spectra of the basic side chain amino acids shown in Figure 3B, with their literature assignments, is provided in Table S3 in the ESI.
Figure 3.
(A) The SERS electropherogram of the three basic side chain amino acids acids indicates that Arg migrates at tm = 123 ± 4 s, Lys migrates at tm = 146 ± 7 s, and His at tm = 299 ± 9 s. The signal threshold (>4σ) was set to 430 counts. (B) Averaged SERS spectra of (i) Arg, (ii) Lys, and (iii) His were extracted from the electropherogram in (A) between 122.6 and 123.5 s, 146.2 and 147.0 s, and 298.7 and 299.5 s, respectively. The amino acid concentration in this mixture is 3.3×10⁻⁴ M.
The SERS spectra shown in Figure 3B present distinct features attributed to the characteristic molecular components of Arg, His and Lys. Arg is identified by bands associated with the amine group at 1151 cm−1 (N-H wag) and 1523 (NH3+ deformation). The SERS spectrum of Lys consists of bands at 1155 (N-H wag), 1244 (CH2 wag), 1486 (CH2 bend), and overlapping peaks at 1536 and 1569 cm−1 (NH3+ deformation and COO− stretch, respectively). The spectrum of His (Figure 3B, iii) shows prominent assignable peaks at 1306 (CH2 wag), 1410 (COO− stretch), 1463 (CH2 scissoring), and 1482 cm−1 (imidazole ring stretch + C-H bend).40, 43, 55 The imidazole band at 1482 cm−1 is a unique feature in the spectrum of His, and supports other bands assigned in Table S3 that are near the noise limit.
Sulfur-Containing Side Chain Amino Acids
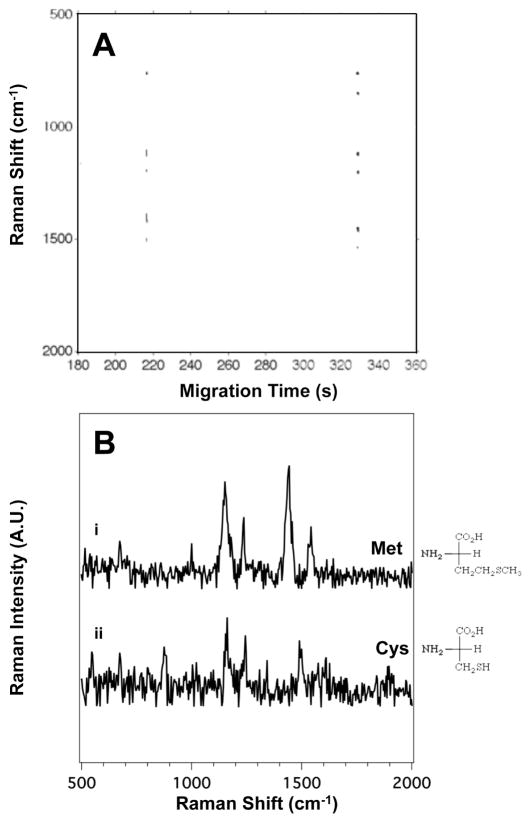
Figure 4A presents the SERS electrophoragram of the two sulfur-containing side chain amino acids: cysteine (Cys) and methionine (Met). The Raman signal observed indicates that Met migrates at tm = 216 ± 8 s and Cys at tm = 329 ± 6 s.
Figure 4.
(A) The SERS electropherogram of the two sulfur-containing side chain amino acids indicates that Met migrates at tm = 216 ± 8 s and Cys at tm = 329 ± 6 s. The signal threshold (>4σ) was set to 680 counts. (B) Averaged SERS spectra of (i) Met and (ii) Cys were extracted from the electropherogram in (A) between 215.6 and 216.1 s, and 328.7 and 329.4 s, respectively. The amino acid concentration in this mixture is 5.0×10⁻⁴ M.
Figure 4B shows the averaged SERS spectra of Met (i) and Cys (ii) extracted from the SERS electropherogram. The spectra of both Met and Cys show the characteristic C-S stretch at 673 cm−1.56, 57 Another prominent band observed in both spectra is the 1155 cm−1 band attributed to the NH3+ deformation of the amine group. The main bands present in the SERS spectra shown in Figure 4B are tabulated and assigned in Table S4 in the ESI.
The spectral features allowing discrimination between Met and Cys are the bands attributed to the hydrocarbon portions of the side chain. The SERS spectrum of Met has a strong band at 1443 cm−1 attributed to the CH2 scissoring motion. Bands associated with methylene vibrations are at different frequencies and less intense in the spectrum of Cys. From all the features observed we assign (i) to Met and (ii) to Cys.
The transient signal and strong N-H deformation mode at 1155 cm−1 suggest that these amino acids coordinate to the surface via amine group and not through the sulfur. While sulfur is known to have a strong affinity for silver,56 that interaction does not appear to be significant in our experiment.
Aliphatic Side Chain Amino Acids
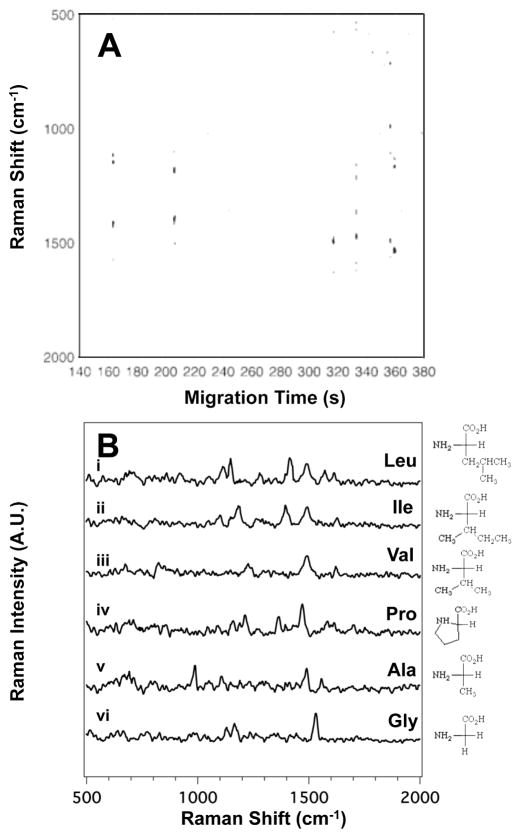
The aliphatic amino acids are often difficult to discern between based on subtle differences in the acyl change substituents. Figure 5A shows the SERS electropherogram for the separation of alanine (Ala), glycine (Gly), isoleucine (Ile), leucine (Leu), proline (Pro), and valine (Val). The Raman signal observed indicates that Leu migrates at tm = 163 ± 8 s, Ile at tm = 206 ± 5 s, Val at tm = 320 ± 11 s, Pro at tm = 332 ± 7 s, Ala at tm = 356 ± 10 s, and Gly at tm = 360 ± 14 s.
Figure 5.
(A) The SERS electropherogram of the six aliphatic side chain amino acids indicates that Leu migrates at tm = 163 ± 8 s, Ile at tm = 206 ± 5 s, Val at tm = 320 ± 11 s, Pro at tm = 332 ± 7 s, Ala at tm = 360 ± 10 s, and Gly at tm = 360 ± 14 s. The signal threshold (>4σ) was set to 230. (B) Averaged SERS spectra of (i) Leu, (ii) Ile, (iii) Val, (iv) Pro, (v) Ala, and (iv) Gly extracted from the electropherogram in (A) between 162.9 and 163.6 s, 205.7 and 206.6 s, 316.5 and 317.2 s, 332.5 and 333.1 s, 356.2 and 357.0 s, and 358.7 and 359.5 s, respectively. The amino acid concentration in this mixture is 16×10−5 M.
The spectra extracted from the SERS electropherogram (Figure 5B) show distinct spectra for (i) Leu, (ii) Ile, (iii) Val, (iv) Pro, (v) Ala, and (iv) Gly. Table S5 in the ESI summarizes the observed bands in the SERS spectra of the aliphatic amino acids along with their literature assignments. Interestingly, bands attributed to the characteristic vibrations of their hydrocarbon chain are weak or non-existent in the SERS spectra, suggesting that the hydrocarbon side chain is not interacting with the silver surface.
Many bands are observed to vary in relative intensity between amino acids, suggesting that identical molecular constituents provide different scattering cross-sections based on differences in the interaction between the molecules and the SERS substrate. The spectral reproducibility observed in this study, along with these variations in relative band intensities, provide unique spectral fingerprints for identification.
The Raman spectra of the isobaric isomers Leu and Ile are distinctly different. The SERS spectrum of Leu shows peaks at 1112 (C-H deformation), 1148 (NH3+ deformation), 1413 (COO− stretch), 1493 (COO− stretch), 1572 (C=O stretch), and 1614 cm−1 (COO− stretch). In the spectrum of Ile, the observed bands are at 1108 (C-H deformation), 1186 (NH3+ deformation), 1397 (COO− stretch), 1493 (COO− stretch), and 1624 cm−1 (COO− stretch). Similar to the results we reported for rhodamine isomers, structural differences are evident in the frequencies observed in the SERS spectra.43, 49
The SERS spectrum of Val (Figure 5B, iii) is characterized by bands largely attributable to the carboxyl group, such as at 1493 (COO− stretch) and 1621 cm−1 (COO− stretch). The other subtle feature that allows identification of Val is the C-N stretching motion observed at 1227 cm−1.
The SERS spectrum of Pro (Figure 5B, iv) includes the bands at 1152 (NH3+ deformation), 1226 (C-N stretch), 1366 (CH2 scissoring), 1393 (COO− stretch), 1472 (CH2 scissoring), and 1614 cm−1(COO− stretch).43, 49 While most of the SERS spectra of the aliphatic amino acids do not have C-H signals, Pro does. This may arise from the ring structure between the amine and the side-chain residues. Nonetheless, the structure provides a distinctive spectrum.
Gly is the amino acid with the simplest structure, and has a simple SERS spectrum (Figure 5B, v). Peaks are observed at 1130 (NH3+ deformation), 1165 (NH3+ deformation), and 1543 cm−1 (C=O stretch).40, 43, 49, 58, 59
Alcoholic Side Chain Amino Acids
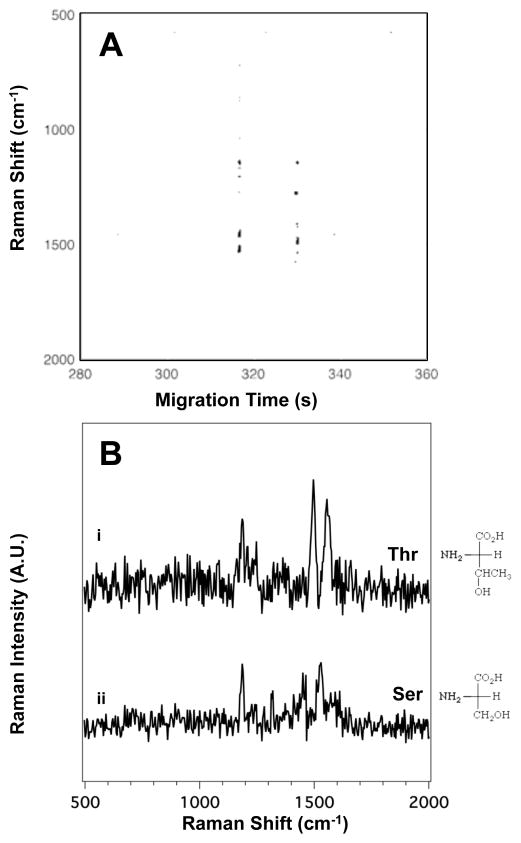
Figure 6A shows the SERS electropherogram from the alcoholic amino acids, serine (Ser) and threonine (Thr). The Raman signals detected in Figure 6A indicate that Thr migrates at tm = 320 ± 13 s and Ser at tm = 330 ± 15 s.
Figure 6.
(A) The SERS electropherogram of the two alcoholic amino acids indicates that Thr migrates at tm = 320 ± 13 s and Ser at tm = 330 ± 15 s. The signal threshold (>4σ) was set to 960 counts. (B) Averaged SERS spectra of (i) Thr and (ii) Ser were extracted from the electropherogram in (A) between 316.2 and 317.0 s, and 329.4 and 329.1 s, respectively. The amino acid concentration in this mixture is 5.0×10⁻⁴ M.
Figure 6B shows the averaged SERS spectra of Thr (i) and Ser (ii) extracted from the electropherogram. A complete table of the observed bands in the SERS spectra of the alcoholic amino acids shown in Figure 6B, with their literature assignments, is provided in Table S6 in the ESI. Thr shows peaks at 1151 (NH3+ deformation), 1184 (C-H bend), 1456 (CH3 bend), and 1539 cm−1 (NH3+ deformation). For Ser, peaks are observed at 1179 (C-H bend), 1417 (COO− stretch), and 1496 cm−1(COO− stretch).43
Mixture of the 20 Amino Acids
To examine the ability to separate and resolve chemical differences of a large number of biologically relevant molecules, we performed CZE-SERS on a mixture containing the 20 proteinogenic L-amino acids. The Raman signals observed in Figure 7A suggest we are near the detection limit at a concentration of 5 × 10⁻⁵ M; however, identification of all 20 amino acids was possible by matching the bands observed in the SERS electropherogram of the 20 amino acid mixture with those characteristic of the amino acid vibrations reported and assigned above.
In CZE-SERS, it is challenging to monitor intensity at a single wavelength to produce a typical electropherogram as each analyte evinces characteristic Raman bands at varying frequenies. Where UV-Vis detection provides broad bands shared by many analytes, Raman peaks are narrow and thus provide increased chemical selectivity. In small separations, traces associated with each analyte can be overlaid60 or a common band may be found;19, 32 however, this is complicated as the number of analytes increase. To help visualize the separations, Figure 7B shows a total photon electropherogram (TPE). Similar to a total ion chromatogram (TIC) in mass spectrometry, this trace combines the photons detected at all Raman shifts into a single number that can be monitored as analytes migrate from the capillary. Similar to current practices in mass spectrometry, a spectrum can then be obtained from features observed in this TPE. A disadvantage to viewing the data this way is molecules with few detected SERS bands (e.g. Leu, Ile, and Thr) are evident in the SERS electropherogram but are near the noise level in the combined photon trace.
By comparing the observed Raman spectra in Figure 7A with those observed in Figures 1–6, we determined the migration order of the 20 amino acid mixture to be: arginine (tm= 108.8 s), lysine (tm= 110.2 s), leucine (tm= 112.1 s), isoleucine (tm= 113.1 s), tryptophan (tm= 116.9 s), methionine (tm= 119.7 s), phenylalanine (tm= 121.0 s), valine (tm= 124.3 s), histidine (tm= 126.7 s), proline (127.6 s), threonine (tm= 129.1 s), serine (tm= 131.5 s), cysteine (tm= 132.2 s), alanine (tm= 134.8 s), glycine (tm= 136.5 s), tyrosine (tm= 176.2 s), glutamine (tm= 180.7 s), asparagine (tm= 194.6 s), glutamic acid (tm= 207.6 s), and aspartic acid (tm= 214.2 s). Details regarding the peaks used to make the assignments are provided in the ESI. In order to ensure reproducibility of results, at least four electropherograms of each of the six groups of structurally related amino acids and the mixture containing the 20 proteinogenic L-amino acids were acquired using more than a dozen different SERS-active substrates over a four month period. The high degree of spectral reproducibility observed in this study derives from the reproducibility of the SERS substrate and the analyte surface interaction in the sheath-flow detector. While the absolute migration times reported from Figure 7 differ from the smaller separations, the order and relative migration times are consistent. It should be noted that the data was collected over an extended period, with different pieces of capillary and a non-thermostated experiment, thus differences are expected. The migration times observed from technical replicates are reproducible as indicated by the small standard deviations observed with the smaller separations (Figures 1–6). The migration order agrees with previous reports of fluorescently labeled amino acids at basic pH.61
As seen in Figure 7, baseline resolution of each of the 20 amino acids was accomplished. This is in contrast to the fluorescence study by Dovichi and coworkers where some amino acids co-migrated.61 However, the mechanism of detection following separation is not trivial in the case our sheath-flow SERS detector. We have previously shown that the mechanism of detection inside the flow cell appears to obey Langmuir-type behavior where hydrodynamic confinement promotes molecule interaction with the silver surface, such that the SERS signal is only generated from the highest concentration portion of the migrating analyte band.32 This effect intrinsic to SERS detection may facilitate differentiation between closely migrating analytes. Other SERS studies have surface modification to promote adsorption and SERS detection.62 Incorporating such strategies may further improve the detection limit or our sheath flow SERS detector. The spectra shown in this study are averaged across the migrating sample band, thus longer retention on the surface may increase spectral quality.
The SERS electropherogram of the amino acid mixture (Figure 7A) used a 4 s injection, which injects ~68 nL of sample. In our previous study using rhodamine, the large cross-section and strong interaction with the surface enabled subnanomolar detection. The sensitivity of the SERS detection is a combination of Raman cross-section and surface affinity. The lower polarizability and adsorption coefficient of amino acids required sample concentrations of 10−5 M. However, given the nanoliter volumes needed for analysis, this corresponds to analyte on the order of 100s of femtomoles. Given the small volumes needed for analysis, common sample pretreatments, such as solid phase extraction, may further facilitate detection. Improvement in fluidics may also reduce dead volume and further improve detection sensitivity.
The spectral results from this study show that amino acids can associate through the amino, carboxylate, or side chain groups, providing multiple means of interaction with the surface. As a result, orientation information can be gained from spectral data because band intensity is known to be enhanced from vibrational modes of the adsorbed molecule with a large polarizability component perpendicular to the surface.49 Thus, using SERS to study these molecules has the potential to provide a better understanding of the analyte interaction with the SERS substrate. Of note, the aromatic amino acids do not seem to provide significantly more intense scattering than the other amino acids, particularly when comparing their spectra in the 20 amino acid separation (Figure S-2).
Previous SERS studies of amino acids typically deposit them onto the SERS-active substrate and evaporate the solvent, promoting adsorption of the molecules onto the metal surface. 40–43, 48, 49, 55, 57, 63–68 The observed enhanced vibrational modes suggest an orientation preference for these molecules with the surface. This preference is reported to be dependent on the pH, associated with the anionic (NH2RCOO−), zwitterionic (+H3NRCOO−), and cationic (+H3NRCOOH) states of amino acids in solution.40, 49, 55 From the bands observed in our SERS spectra, it appears that the charged groups interact most closely with SERS substrate.
These presented results demonstrate the chemical specificity the sheath-flow SERS detector offers as a general-purpose method for characterizing analytes post-separation. UV-visible absorption is reported to have detection limits of 10−5–10−6 M,12 where these results combined with our previous work32 suggest limit of detection for sheath-flow SERS is analyte dependent between 10−5–10−10 M. Here we have focused on analyte identification; however, previously we have shown a linear response for concentrations below monolayer coverage.31 The sample volumes needed are minimal, but sample concentration appears to influence interaction with the SERS surface. Nonetheless, we are able to identify a chemically diverse sample, amino acids, at relevant concentrations. Further work examining orientation and potential isotopic effects, as well as surface functionalization, improved fluidics, and sample pre-concentration, may provide new insight into the mechanism and further improve detection.
Conclusion
We have demonstrated sensitive and reproducible online SERS detection of the 20 proteinogenic L-amino acids separated by capillary zone electrophoresis. The sheath-flow SERS detector was sensitive enough to detect amino acids at varying micromolar concentrations. The biochemical variation in the 20 amino acids provided spectral features that can differentiate each amino acid. A mixture of the 20 proteinogenic L-amino acids was separated and identified at micromolar concentrations using 100 ms spectra sequentially collected, demonstrating the ability of the sheath-flow SERS detector to characterize complex mixtures. The spectral reproducibility observed in this study suggests that each amino acid evinces a unique spectrum that can be used for identification, possibly with library matching in the future. The surface selection inherent to SERS provides insight into how the analytes interact with the SERS substrate. The current sheath-flow SERS detector provides complementary characterization to mass spectrometry and improved chemical identification over UV-visible absorption used for post-chromatographic detection. The results presented here demonstrate a fast, robust, reproducible, high throughput, and chemical specific SERS detector for online use with chemical separations.
Supplementary Material
Acknowledgments
The University of Notre Dame, NIH Award R21 GM107893, and the Cottrell Scholar Award from the Research Corporation for Science Advancement supported this work. The authors thank Norman Dovichi for helpful comments regarding this work.
Footnotes
Electronic supplementary information (ESI) available: Additional experimental details, supporting Fig. S1–S2, supporting tables 1–6, and additional information on signal assignment.
References
- 1.Dovichi NJ, Hu S. Current Opinion in Chemical Biology. 2003;7:603–608. doi: 10.1016/j.cbpa.2003.08.012. [DOI] [PubMed] [Google Scholar]
- 2.Jorgenson JW, Lukacs KD. Science. 1983;222:266–272. doi: 10.1126/science.6623076. [DOI] [PubMed] [Google Scholar]
- 3.Ohno K, Tachikawa K, Manz A. Electrophoresis. 2008;29:4443–4453. doi: 10.1002/elps.200800121. [DOI] [PubMed] [Google Scholar]
- 4.Squires TM, Quake SR. Reviews of Modern Physics. 2005;77:977–1026. [Google Scholar]
- 5.Fiorini GS, Chiu DT. Biotechniques. 2005;38:429–446. doi: 10.2144/05383RV02. [DOI] [PubMed] [Google Scholar]
- 6.Kaltashov IA, Eyles SJ. Mass Spectrometry Reviews. 2002;21:37–71. doi: 10.1002/mas.10017. [DOI] [PubMed] [Google Scholar]
- 7.Banks JF. Electrophoresis. 1997;18:2255–2266. doi: 10.1002/elps.1150181216. [DOI] [PubMed] [Google Scholar]
- 8.Figeys D, Aebersold R. Electrophoresis. 1998;19:885–892. doi: 10.1002/elps.1150190603. [DOI] [PubMed] [Google Scholar]
- 9.von Brocke A, Nicholson G, Bayer E. Electrophoresis. 2001;22:1251–1266. doi: 10.1002/1522-2683(200105)22:7<1251::AID-ELPS1251>3.0.CO;2-9. [DOI] [PubMed] [Google Scholar]
- 10.Smith RD, Olivares JA, Nguyen NT, Udseth HR. Anal Chem. 1988;60:436–441. [Google Scholar]
- 11.Kebarle P, Tang L. Anal Chem. 1993;65:A972–A986. [Google Scholar]
- 12.Swinney K, Bornhop DJ. ELECTROPHORESIS. 2000;21:1239–1250. doi: 10.1002/(SICI)1522-2683(20000401)21:7<1239::AID-ELPS1239>3.0.CO;2-6. [DOI] [PubMed] [Google Scholar]
- 13.Chen DY, Dovichi NJ. Journal of Chromatography B-Biomedical Applications. 1994;657:265–269. doi: 10.1016/0378-4347(94)00014-x. [DOI] [PubMed] [Google Scholar]
- 14.MacTaylor CE, Ewing AG. Electrophoresis. 1997;18:2279–2290. doi: 10.1002/elps.1150181218. [DOI] [PubMed] [Google Scholar]
- 15.Santesson S, Andersson M, Degerman E, Johansson T, Nilsson J, Nilsson S. Anal Chem. 2000;72:3412–3418. doi: 10.1021/ac000140r. [DOI] [PubMed] [Google Scholar]
- 16.Otsuka K, Karuhaka K, Higashimori M, Terabe S. J Chromatogr A. 1994;680:317–320. doi: 10.1016/0021-9673(94)80082-0. [DOI] [PubMed] [Google Scholar]
- 17.Beck W, Engelhardt H. Chromatographia. 1992;33:313–316. [Google Scholar]
- 18.Song JZ, Huang DP, Tian SJ, Sun ZP. Electrophoresis. 1999;20:1850–1855. doi: 10.1002/(SICI)1522-2683(19990701)20:9<1850::AID-ELPS1850>3.0.CO;2-M. [DOI] [PubMed] [Google Scholar]
- 19.Chen CY, Morris MD. Applied Spectroscopy. 1988;42:515–518. [Google Scholar]
- 20.Walker PA, Morris MD. Journal of Chromatography A. 1998;805:269–275. doi: 10.1016/s0021-9673(97)01302-2. [DOI] [PubMed] [Google Scholar]
- 21.Chen CY, Morris MD. Journal of Chromatography. 1991;540:355–363. doi: 10.1016/s0021-9673(01)88822-1. [DOI] [PubMed] [Google Scholar]
- 22.Carrillo-Carrión C, Armenta S, Simonet BM, Valcárcel M, Lendl B. Anal Chem. 2011;83:9391–9398. doi: 10.1021/ac201821q. [DOI] [PubMed] [Google Scholar]
- 23.Dieringer JA, Wustholz KL, Masiello DJ, Camden JP, Kleinman SL, Schatz GC, Van Duyne RP. Journal of the American Chemical Society. 2009;131:849–854. doi: 10.1021/ja8080154. [DOI] [PubMed] [Google Scholar]
- 24.Stiles PL, Dieringer JA, Shah NC, Van Duyne RR. Annual Review of Analytical Chemistry. 2008;1:601–626. doi: 10.1146/annurev.anchem.1.031207.112814. [DOI] [PubMed] [Google Scholar]
- 25.Nie SM, Emery SR. Science. 1997;275:1102–1106. doi: 10.1126/science.275.5303.1102. [DOI] [PubMed] [Google Scholar]
- 26.Kneipp K, Kneipp H, Dasari IIRR, Feld MS. Chemical Reviews. 1999;99:2957–2976. doi: 10.1021/cr980133r. [DOI] [PubMed] [Google Scholar]
- 27.Kneipp K, Wang Y, Kneipp H, Perelman LT, Itzkan I, Dasari R, Feld MS. Physical Review Letters. 1997;78:1667–1670. doi: 10.1103/PhysRevLett.76.2444. [DOI] [PubMed] [Google Scholar]
- 28.Moskovits M. Reviews of Modern Physics. 1985;57:783–826. [Google Scholar]
- 29.Leopold N, Lendl B. Analytical and Bioanalytical Chemistry. 2010;396:2341–2348. doi: 10.1007/s00216-010-3468-3. [DOI] [PubMed] [Google Scholar]
- 30.Přikryl J, Klepárník K, Foret F. Journal of Chromatography A. 2012;1226:43–47. doi: 10.1016/j.chroma.2011.07.045. [DOI] [PubMed] [Google Scholar]
- 31.Negri P, Jacobs KT, Dada OO, Schultz ZD. Anal Chem. 2013;85:10159–10166. doi: 10.1021/ac401537k. [DOI] [PMC free article] [PubMed] [Google Scholar]
- 32.Negri P, Flaherty RJ, Dada OO, Schultz ZD. Chemical Communications. 2014;50:2707–2710. doi: 10.1039/c3cc49030k. [DOI] [PMC free article] [PubMed] [Google Scholar]
- 33.Brosnan JT. Iubmb Life. 2001;52:265–270. doi: 10.1080/152165401317291101. [DOI] [PubMed] [Google Scholar]
- 34.Suenaga R, Tomonaga S, Yamane H, Kurauchi I, Tsuneyoshi Y, Sato H, Denbow DM, Furuse M. Amino Acids. 2008;35:139–146. doi: 10.1007/s00726-007-0610-4. [DOI] [PubMed] [Google Scholar]
- 35.Wu GY, Bazer FW, Davis TA, Jaeger LA, Johnson GA, Kim SW, Knabe DA, Meininger CJ, Spencer TE, Yin YL. Livestock Science. 2007;112:8–22. [Google Scholar]
- 36.Curley D, Siiman O. Langmuir. 1988;4:1021–1032. [Google Scholar]
- 37.Wu GY. Amino Acids. 2009;37:1–17. doi: 10.1007/s00726-009-0269-0. [DOI] [PubMed] [Google Scholar]
- 38.Asiala SM, Schultz ZD. Analyst. 2011;136:4472–4479. doi: 10.1039/c1an15432j. [DOI] [PMC free article] [PubMed] [Google Scholar]
- 39.Krylov SN, Starke DA, Arriaga EA, Zhang Z, Chan NW, Palcic MM, Dovichi NJ. Anal Chem. 2000;72:872–877. doi: 10.1021/ac991096m. [DOI] [PubMed] [Google Scholar]
- 40.Chumanov GD, Efremov RG, Nabiev IR. Journal of Raman Spectroscopy. 1990;21:43–48. [Google Scholar]
- 41.Kim SK, Kim MS, Suh SW. Journal of Raman Spectroscopy. 1987;18:171–175. [Google Scholar]
- 42.Lee HI, Suh SW, Kim MS. Journal of Raman Spectroscopy. 1988;19:491–495. [Google Scholar]
- 43.Stewart S, Fredericks PM. Spectrochimica Acta Part a-Molecular and Biomolecular Spectroscopy. 1999;55:1641–1660. [Google Scholar]
- 44.Rava RP, Spiro TG. Journal of the American Chemical Society. 1984;106:4062–4064. [Google Scholar]
- 45.Smith E, Dent G. Modern Raman Spectroscopy: A Practical Approach. 2005 [Google Scholar]
- 46.Miura T, Takeuchi H, Harada I. Biochemistry. 1991;30:6074–6080. doi: 10.1021/bi00238a035. [DOI] [PubMed] [Google Scholar]
- 47.Wei F, Zhang DM, Halas NJ, Hartgerink JD. Journal of Physical Chemistry B. 2008;112:9158–9164. doi: 10.1021/jp8025732. [DOI] [PubMed] [Google Scholar]
- 48.Nabiev IR, Trakhanov SD, Efremov ES, Marinyuk VV, Lasorenkomanevich RM. Bioorganicheskaya Khimiya. 1981;7:941–945. [Google Scholar]
- 49.Suh JS, Moskovits M. Journal of the American Chemical Society. 1986;108:4711–4718. [Google Scholar]
- 50.Ortiz C, Zhang DM, Xie Y, Davisson VJ, Ben-Amotz D. Analytical Biochemistry. 2004;332:245–252. doi: 10.1016/j.ab.2004.06.013. [DOI] [PubMed] [Google Scholar]
- 51.Ravikumar B, Rajaram RK, Ramakrishnan V. Journal of Raman Spectroscopy. 2006;37:597–605. [Google Scholar]
- 52.Yu NT, Liu CS, Oshea DC. Journal of Molecular Biology. 1972;70:117–132. doi: 10.1016/0022-2836(72)90167-2. [DOI] [PubMed] [Google Scholar]
- 53.NBD, Colthup LH, Wiberly SE. Introduction to Infrared and Raman Spectroscopy. Academic Press; New York: 1990. [Google Scholar]
- 54.Siamwiza MN, Lord RC, Chen MC, Takamatsu T, Harada I, Matsuura H, Shimanouchi T. Biochemistry. 1975;14:4870–4876. doi: 10.1021/bi00693a014. [DOI] [PubMed] [Google Scholar]
- 55.Martusevicius S, Niaura G, Talaikyte Z, Razumas V. Vibrational Spectroscopy. 1996;10:271–280. [Google Scholar]
- 56.Rycenga M, McLellan JM, Xia YN. Chemical Physics Letters. 2008;463:166–171. doi: 10.1016/j.cplett.2008.08.062. [DOI] [PMC free article] [PubMed] [Google Scholar]
- 57.Watanabe T, Maeda H. Journal of Physical Chemistry. 1989;93:3258–3260. [Google Scholar]
- 58.FRF, Dollish WG, Bentley FF. Characteristic Raman Frequencies of Organic Compounds. Wiley; NY: 1974. [Google Scholar]
- 59.Herne TM, Ahern AM, Garrell RL. Journal of the American Chemical Society. 1991;113:846–854. [Google Scholar]
- 60.Walker PA, Morris MD, Burns MA, Johnson BN. Anal Chem. 1998;70:3766–3769. doi: 10.1021/ac980195h. [DOI] [PubMed] [Google Scholar]
- 61.Cheng YF, Dovichi NJ. Science. 1988;242:562–564. doi: 10.1126/science.3140381. [DOI] [PubMed] [Google Scholar]
- 62.Stuart DA, Yuen JM, Lyandres NSO, Yonzon CR, Glucksberg MR, Walsh JT, Van Duyne RP. Anal Chem. 2006;78:7211–7215. doi: 10.1021/ac061238u. [DOI] [PubMed] [Google Scholar]
- 63.Nabiev IR, Savchenko VA, Efremov ES. Journal of Raman Spectroscopy. 1983;14:375–379. [Google Scholar]
- 64.Nabiev IR, Chumanov GD. Biofizika. 1986;31:183–190. [PubMed] [Google Scholar]
- 65.Vidugiris GJA, Gudavicius AV, Razumas VJ, Kulys JJ. European Biophysics Journal with Biophysics Letters. 1989;17:19–23. doi: 10.1007/BF00257142. [DOI] [PubMed] [Google Scholar]
- 66.Podstawka E, Ozaki Y, Proniewicz LM. Applied Spectroscopy. 2004;58:570–580. doi: 10.1366/000370204774103408. [DOI] [PubMed] [Google Scholar]
- 67.Podstawka E, Ozaki Y, Proniewicz LM. Applied Spectroscopy. 2004;58:581–590. doi: 10.1366/000370204774103417. [DOI] [PubMed] [Google Scholar]
- 68.Podstawka E, Ozaki Y, Proniewicz LM. Applied Spectroscopy. 2005;59:1516–1526. doi: 10.1366/000370205775142520. [DOI] [PubMed] [Google Scholar]
Associated Data
This section collects any data citations, data availability statements, or supplementary materials included in this article.


