Abstract
Objective
To characterize membrane conductivity by applying mathematical modeling techniques and immunohistochemistry to localize and predict areas of the bowel where aquaporins may be associated with edema resolution/prevention associated with hypertonic saline. Intestinal edema induced by resuscitation and mesenteric venous hypertension impairs intestinal transit/contractility. Hypertonic saline decreases intestinal edema and improves transit. Aquaporins are water transport membrane proteins that may be up-regulated with edema and/or hypertonic saline.
Design
Laboratory study.
Setting
University research laboratory.
Subjects
Male Sprague Dawley rats, weighing 270 to 330 g.
Interventions
Rats were randomized to control (with and without hypertonic saline) and mesenteric venous hypertension with either 80 mL/kg normal saline (RESUS + VH + VEH) or 80 mL/kg with hypertonic saline (RESUS + VH + HTS). After 6 hrs, intestinal wet/dry ratios, urine output, peritoneal fluid, and intraluminal fluid were measured. Hydraulic conductivity was calculated from our previously known and published pressure-flow data. The cDNA microarray, Western blot, polymerase chain reaction, and immunohistochemistry studies were conducted for and candidate aquaporins and distribution in intestinal edema resolution.
Measurements and Main Results
Hypertonic saline decreased edema and increased urine, intraluminal, and peritoneal volume. RESUS + VH favors fluid flux into the interstitium. Hypertonic saline causes increased hydraulic conductivity at the seromuscular and mucosal surfaces at the same time limiting flow into the interstitium. This is associated with increased aquaporin 4 expression in the intestinal mucosa and submucosa.
Conclusions
Hypertonic saline mitigates intestinal edema development and promotes fluid redistribution secondary to increased membrane conductivity at the mucosal and seromuscular surfaces. This is associated with up-regulation of aquaporin 4 either gene expression and protein. Aquaporin 4 may be a useful therapeutic target for strategies to enhance edema resolution.
Keywords: ileus, hypertonic saline, edema, aquaporin, intestines, resuscitation
Although aggressive isotonic resuscitation is widely accepted as standard therapy for initial shock resuscitation, there are certain sequelae resulting from its use, such as significant increases in tissue edema in various organ systems including the intestines. Many investigators have described intestinal edema and have studied the resultant ileus (1, 2). Intestinal edema-associated ileus delays initiation of enteral feeding and leads to an increase in septic complications (3).
We have developed a model to simulate large-volume crystalloid resuscitation-induced intestinal edema and ileus, utilizing a combination of high-volume crystalloid resuscitation and mesenteric venous hypertension (to simulate abdominal packing) (4). Using this model, we have demonstrated that intestinal edema, in the absence of ischemia/reperfusion, results in decreased intestinal contractility and transit and increased intestinal permeability (4, 5). Edema also alters the mechanical properties of the intestine (6). Furthermore, we have shown that pretreatment and treatment with hypertonic saline (HTS) can improve intestinal edema, transit, and attenuate cystoskeletal signaling pathways initiated by edema (7, 8).
A family of membrane proteins, known as aquaporins, may play a role in the pathogenesis of tissue edema. The 13 known aquaporins belong to a family of water channels that selectively transport water and some small solutes, such as urea or glycerol (9). Aquaporins are involved in increasing membrane water conductivity by increasing water flux in response to osmotic gradients (10). Aquaporins have been implicated in various disease processes including cerebral and cardiac edema (11, 12). Additionally, aquaporins have been localized in the gastrointestinal tract and have been implicated in certain diarrhea-forming disease states (12-14).
We sought to examine how HTS resolved intestinal tissue edema by examining where the edema was redistributed. We hypothesized that tissue hydraulic conductivity as well as aquaporins would be altered with HTS administration.
MATERIALS AND METHODS
Intestinal Edema Model—Edema Prep
All procedures were approved by the University of Texas Animal Welfare Committee and were consistent with the National Institutes of Health Guide for the Care and Use of Laboratory Animals.
Male Sprague Dawley rats, weighing 270 g to 330 g, were fasted 12 hrs to 16 hrs before surgery with free access to water. The rats were anesthetized with isoflurane, and a fluid-filled external jugular vein catheter was inserted under aseptic conditions. A midline laparotomy was subsequently performed. The superior mesenteric vein was dissected free from its mesenteric attachments. The small bowel was not manipulated.
Rats (n = 32) were then randomized into four groups: a) control with (CONTROL + HTS) (n = 8) and without (CONTROL + VEH) (n = 8) 7.5% HTS; b) MV-HTN (mesenteric venous hypertension) with 80 mL/kg of 0.9% normal saline (RESUS + VH + VEH) (n = 8); c) MV-HTN with 80 mL/kg 0.9% of normal saline; and d) after 30 mins, 4 mL/kg of 7.5% HTS (RESUS + VH + HTS) (n = 8). This one-time dose of HTS has been studied extensively and was initially shown to improve hemodynamic parameters and survival in hemorrhagic shock models (15). The control surgery rats had the jugular vein catheter removed and the laparotomy wound closed. The remaining groups had induction of mesenteric venous hypertension (4, 6, 7, 16 –18). This was immediately followed by infusion of fluid (normal saline, HTS, or both) slowly over 5 mins. The laparotomy wound was then closed and the external jugular vein catheter was removed. Rats were killed 6 hrs after closure of abdomen and emergence from anesthesia.
Measurement of Urine Output
After recovery from anesthesia, rats were placed in isolated metabolic cages with free access to water, and urine output was measured over 6 hrs.
Measurement of Peritoneal Fluid
At the time of death, rats had the laparotomy wounds reopened. Peritoneal fluid volumes were measured, using a gauze sponge of known weight to absorb all of the fluid in the peritoneal cavity. The sponges were then reweighed and the difference in weight was used to determine the amount of fluid in the peritoneal cavity.
Measurement of Intraluminal Fluid
To determine intraluminal fluid, the intestine was suture ligated at the proximal duodenum and at the terminal ileum and weighed. Next, the intraluminal fluid and contents were flushed from the intestine and the bowel was milked dry. The bowel was reweighed; intraluminal fluid volume was calculated, using the difference in weight of the bowel before and after removal of intraluminal fluid.
Measurement of Intestinal Tissue Water
Tissue water was determined, using W/D ratios (4).
Calculation of Hydraulic Conductivity
A given semipermeable membrane displays unique characteristics with regard to fluid transport through it, which can be quantified by the hydraulic conductivity. In general, the hydraulic conductivity is given by (19): Lp = Jv/ ΔP where Lp is hydraulic conductivity; Jv is fluid flux or flow; ΔP is pressure gradient across the membrane.
The fluid flux is defined as the fluid flow across the membrane. The pressure gradient is given by: ΔP = Po-Pi where Po is pressure or stress outside the membrane; Pi is pressure within the membrane.
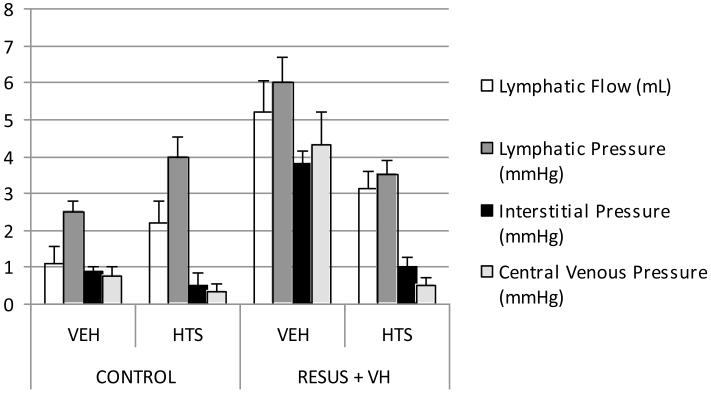
To understand if changes in membrane conductivity were responsible for the fluid shifts seen with HTS, we utilized our previous published data (7) regarding pressure-flow measurements/differentials in the lymphatic and venous systems and interstitium. These measurements were done on a separate set of rats following the same protocol for development of intestinal edema. The procedure is described briefly.
The mesenteric vein was ligated distally with a 4-0 silk tie and cannulated with PE-10 Silastic tubing. A mesenteric lymph vessel was cannulated with PE-10 Silastic tubing, adapted from a published technique (20). The interstitium was probed with a 30-gauge needle. The catheters and needle were attached to a pressure transducer and recorded on a data acquisition system (PowerLab 4, AD Instruments, Colorado Springs, CO) and calibrated for approximately 30 mins at which time measurements were taken. The animals were kept anesthetized throughout the experiment, and the laparotomy wound was kept open. The intraluminal and peritoneal pressures were assumed to be zero. The capillary pressure was estimated to reflect the venous pressure. The ΔP was determined to reflect the pressure differential across a given membrane. The fluid flux was determined by the tissue water (wet weight-dry weight) (fluid flux from capillary to interstitium), peritoneal fluid (fluid flux across seromuscular layer), lymphatic drainage (fluid flux from interstitium to lymphatics), and intraluminal fluid (fluid flux across mucosa).
Microarray and Polymerase Chain Reaction
Ribonucleic acid (RNA) extraction was performed, using the RNA Bee (Tel-Test, Friendswood, TX) kit for RNA isolation. Equal quantities of RNA from each animal within a group were combined to form a pooled sample. The pooled samples were then run on Agilent Technologies Rat Whole Genome 44K microarrays (Palo Alto, CA). Significant genes from the microarray were identified, using Significance Analysis of Microarray software. Secondary analysis was performed (Ingenuity Pathway Analysis software, Ingenuity Systems, Redwood City, CA; www.ingenuity.com). Quantitative polymerase chain reaction was used to verify microarray findings.
Western Blot Analysis
Western blot analysis was performed (5), utilizing an AQP4 primary (and appropriate secondary) antibody (sc-20812, dilution 1:200, Santa Cruz Biotechnology, Santa Cruz, CA). Densitometry was analyzed by image-analysis software (Optimas 6.1, Media Cybernetics, Silver Spring, MD) and expressed in arbitrary units.
Immunohistochemistry
Intestinal tissue was incubated with AQP4 (sc-32739, dilution 1:50, Santa Cruz Biotechniology). The tissue was then incubated with the appropriate secondary antibody (Santa Cruz Biotechnology) and tissue slides were prepared according to the manufacturer’s protocol. Deconvolution microscopy was then performed to determine aquaporin 4 distribution as determined by mean pixel count (CorelDraw, Corel, Mountain View, CA).
Statistical Analysis
All data are expressed as mean ± standard error of the mean. Statistical significance of differences among groups was determined by analysis of variance with Tukey analysis. A p < .05 was considered significant.
RESULTS
Urine Output
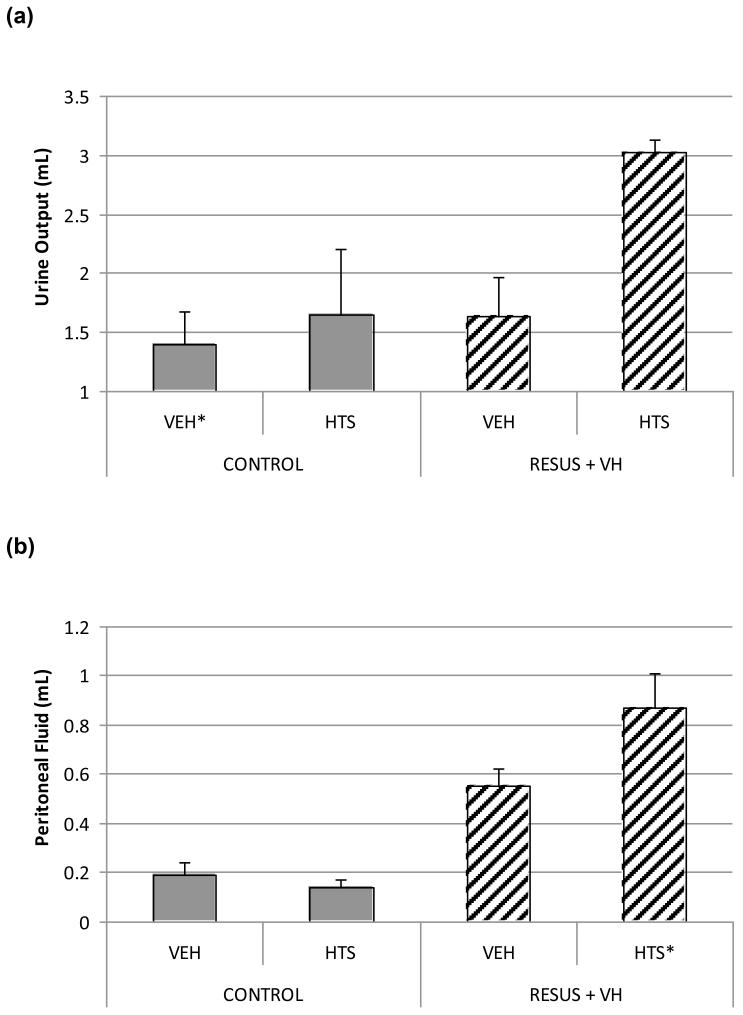
Urine output over 6 hrs was increased significantly in the RESUS + VH + HTS group (3.03 ± 0.10 mL) vs. CONTROL + VEH (1.40 ± 0.27 mL), RESUS + VH + VEH (1.64 ± 0.33 mL), and CONTROL + HTS (1.65 ± 0.44 mL) (Fig. 1A). There were no significant differences between the two CONTROL and RESUS + VH + HTS groups.
Figure 1.
Peritoneal Fluid
Peritoneal fluid volume was increased significantly in the RESUS + VH + HTS group (0.87 ± 0.14 mL) vs. CONTROL + VEH (0.19 ± 0.05 mL), CONTROL + HTS (0.14 ± 0.03 mL), and RESUS + VH + VEH (0.55 ± 0.07 mL) (Fig. 1B). There was also a significant difference between the RESUS + VH + VEH group vs. the two CONTROL groups. There were no significant differences between the two CONTROL groups.
Intraluminal Fluid
Intraluminal fluid volume was increased significantly in the RESUS + VH + HTS group (2.07 ± 0.4 mL) vs. CONTROL + VEH (0.82 ± 0.22 mL), CONTROL + HTS (0.67 ± 0.10 mL), and RESUS + VH + VEH (1.38 ± 0.18 mL) (Fig. 1C). There was also a significant difference between the RESUS + VH + VEH group vs. the two CONTROL groups (Fig. 1C). The CONTROL groups were not significantly different.
W/D Ratio
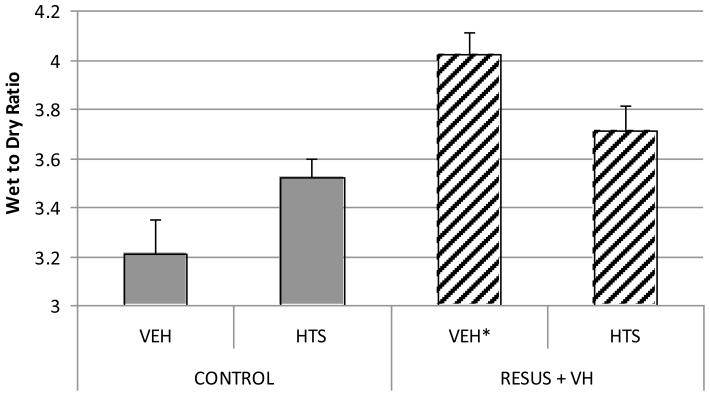
There is a significantly higher W/D ratio in the RESUS + VH + VEH group (4.02 ± 0.09) vs. CONTROL + VEH (3.21 ± 0.14) after 30 mins, demonstrating significant edema formation. At 6 hrs, there was a significantly higher W/D ratio in the RESUS + VH + VEH group (4.07 ± 0.15) vs. CONTROL + VEH (3.58 ± 0.05), CONTROL + HTS (3.52 ± 0.08), and RESUS + VH + HTS (3.71 ± 0.10). There were no significant differences between the two CONTROL and RESUS + VH + HTS groups.
Hydraulic Conductivity
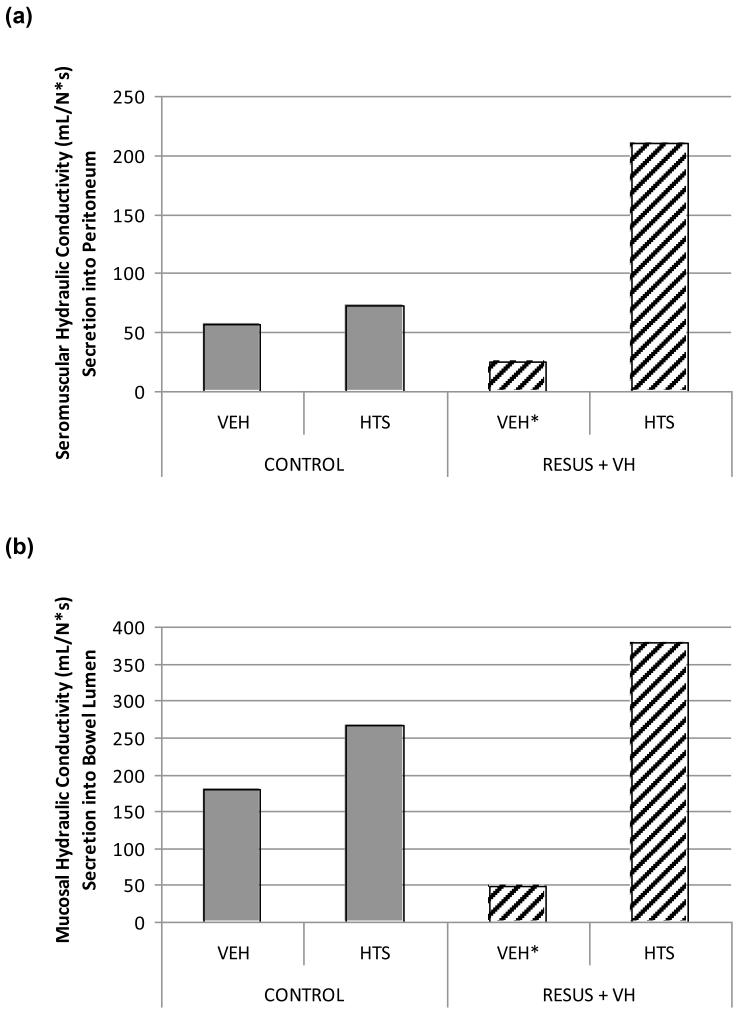
Hydraulic conductivity in the seromuscular layer was decreased significantly in the RESUS + VH + VEH group (25.2 ± 5E-3 mL/[N*s]) vs. CONTROL + VEH (56.9 ± 3E-3 mL/[N*s]), CONTROL + HTS (72.9 ± 7E-4 mL/[N*s]), and RESUS + VH + HTS (209.7 ± 6E-3 mL/[N*s]). There were significant differences between all groups (Fig. 2A).
Figure 2.
The hydraulic conductivity in the mucosa was decreased significantly in the RESUS + VH + VEH group (47.9 ± 1E2 mL/[N*s]) vs. CONTROL + VEH (180.9 ± 2E-2 mL/[N*s]), CONTROL + HTS (267.1 ± 4E-3 mL/[N*s]), and RESUS + VH + HTS (378.2 ± 2E-2 mL/ [N*s]). There were significant differences between all groups (Fig. 2B).
The hydraulic conductivity between the interstitium and the lymphatics was de-creased significantly in the RESUS + VH + VEH group (−1.63E3 ± 9E-3 mL/[N*s]) vs. CONTROL + VEH (−4.72E2 ± 2E-3 mL/ [N*s]), CONTROL + HTS (−4.33E2 ± VEH 8E-3 mL/[N*s]), and RESUS + VH + HTS (−8.68E2 ± 4E-3 mL/[N*s]). There were significant differences between all groups. The negative sign of the hydraulic conductivity indicates an increased theoretical fluid flow tendency from the lymphatics to the interstitium, manifested as a decrease in overall lymphatic flow/pressure. The central venous pressure (CVP) reflects the trend in lymphatic pressure (Figs. 2C and 3).
Figure 3.
The hydraulic conductivity between the afferent capillary and the interstitium was increased significantly in the RESUS + VH + VEH group (1.71E-1 ± 1E-7 mL/ [N*s]) vs. CONTROL + VEH (8.14 E-1 ± 5E-8 mL/[N*s]), CONTROL + HTS (−5.94E-1 ± 2E-7 mL/[N*s]), and RESUS + VH + HTS (−1.96E-1 ± 1E-7 mL/[N*s]). There were significant differences between all groups. The negative sign of the hydraulic conductivity in the two CONTROL and RESUS + VH + HTS groups indicate an increased fluid flow tendency from the interstitium to the capillary (Fig. 2D).
Microarray—Aquaporin Family and Aquaporin 4 RT-Polymerase Chain Reaction
The pattern for significant pathway expression is demonstrated in Table 1. A total of 263 genes were altered (>two-fold change) with administration of HTS in the edema model as compared with 54 genes altered with edema alone. As we were specifically interested in fluid shifts, we examined the microarray data for water transport proteins. Actin cytoskeletal signaling genes were up-regulated with HTS administration.
Table 1.
Significant pathways regulated with resuscitation and venous hypertension in the presence of VEH and HTS
| Microarray Analysis Significant Pathways (p < 0.05) | |
|---|---|
| RESUS + VH + VEH | RESUS + VH + HTS |
| Lysine degradation | Integrin signaling |
| TGF-B signaling | Chemokine signaling |
| Methane metabolism | Acute phase response signaling |
| Parkinson#x2019;s signaling | TR/RXR activation |
| Endoplasmic reticulum stress pathway | Fcy receptor mediated phagocytosis in macrophages and monocytes |
| Ascorbate and aldarate metabolism | Actin cytoskeleton signaling |
| Aryl hydrocarbon receptor signaling | Clatrin mediated endocytosis |
| Neurotrophin/TRK signaling | |
| Xenobiotic metabolism signaling | |
| Leukocyte extravasation signaling | |
| Ceramide signaling | |
| Hypertonic saline (HTS) affects cytoskeletal signaling pathways. | |
TGF, transforming growth factor
Aquaporins 1 through 9 gene expressions were examined via microarray analysis. Aquaporins 2, 4, 5, 8, and 9 displayed significant down-regulation in the RESUS + VH + VEH group compared with CONTROL + VEH. In contrast, HTS administration seemed to increase significantly expression of aquaporins 2, 4, 5, 8, and 9 in the CONTROL + HTS and RESUS + VH + HTS groups compared with RESUS + VH + VEH (Table 2). There was no significant expression of aquaporins 1, 3, 6, or 7 on microarray analysis.
Table 2.
Microarray results for aquaporins
| Ion Channel: Aquaporin Microarray Data | |||
|---|---|---|---|
| CONTROL + HTS | RESUS + VH + VEH | RESUS + VH + HTS | |
| Aquaporin 2 | 0.647 | −0.113 | 1.706 |
| Aquaporin 4 | 0.814 | −1.275 | 1.152 |
| Aquaporin 5 | 0.591 | −2.166 | 0.776 |
| Aquaporin 8 | 0.516 | −2.546 | −0.642 |
| Aquaporin 9 | 0.596 | −1.982 | 0.198 |
| In the quantitative results, there is significant down-regulation of ion channels (aquaporin) induced by RESUS + VH. | |||
HTS, hypertonic saline
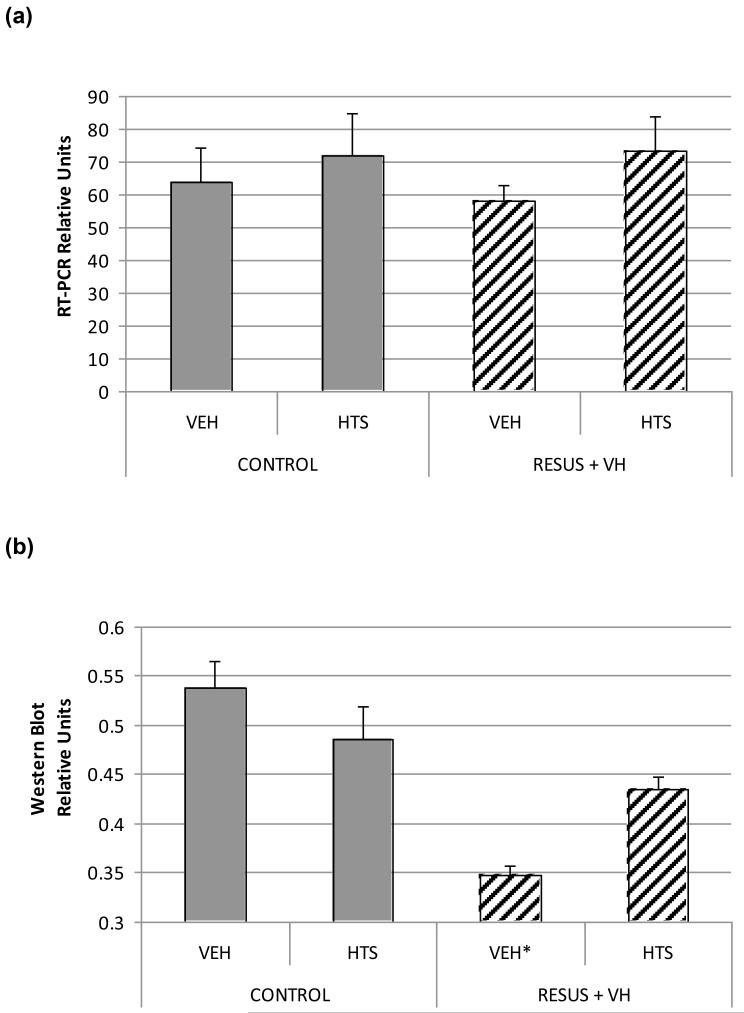
Quantitative polymerase chain reaction suggested increased aquaporin 4 expression in the CONTROL + HTS and RESUS + VH + HTS groups. However, the differences between groups was not statistically significant (p = .66).
Aquaporin 4 Western Blotting
Aquaporin 4 protein levels in intestinal tissue was significantly lower in the RESUS + VH + VEH group (0.35 ± 0.01) compared with CONTROL + VEH (0.54 ± 0.03), CONTROL + HTS (0.49 ± 0.03), and RESUS + VH + HTS (0.43 ±0.01) groups (Fig. 3). There were significant differences between the RESUS + VH + HTS group and the CONTROL + VEH groups. There were no significant differences between the CONTROL + HTS or RESUS + VH + HTS groups.
Aquaporin 4 Immunohistochemistry
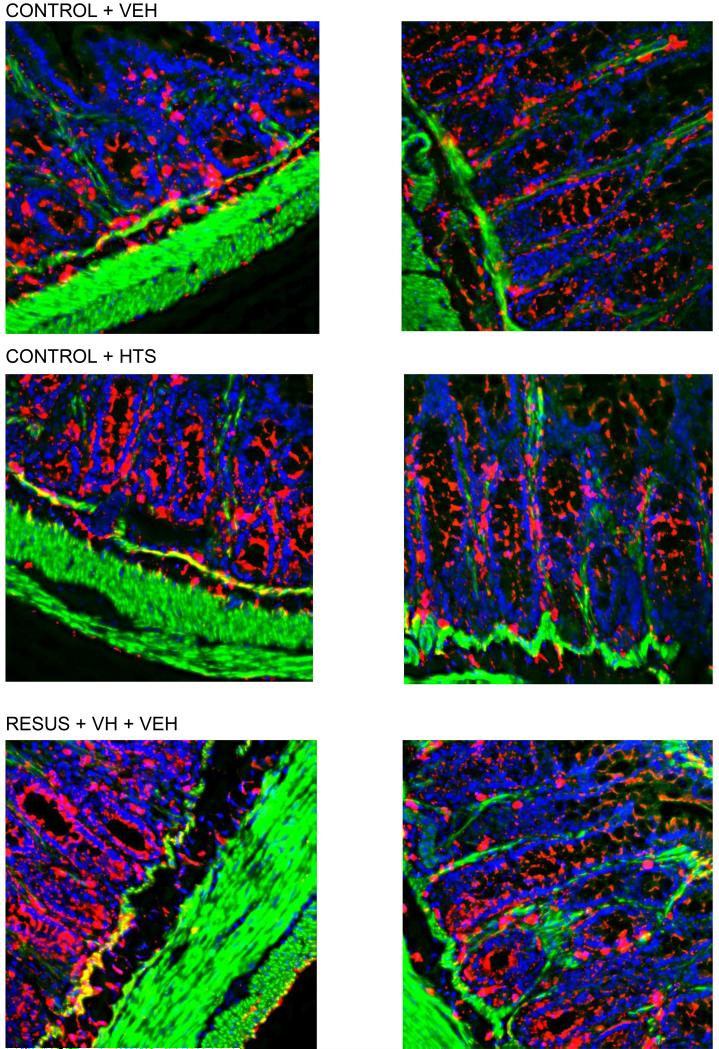
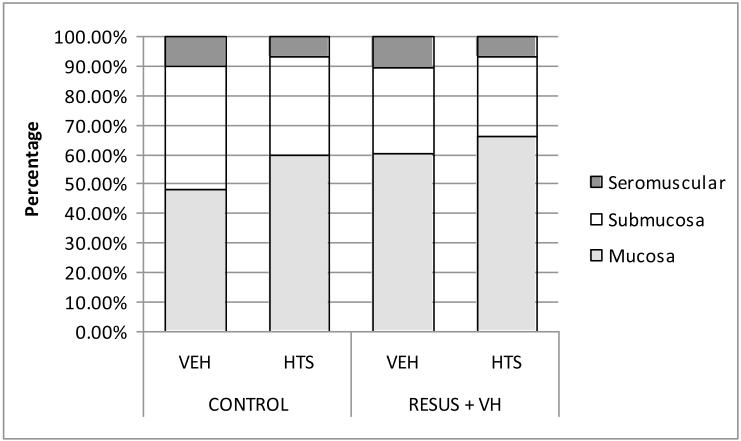
Aquaporin 4 seemed to be localized primarily to the basolateral mucosa and submucosa as determined by mean pixel count (Figs. 4 and 5). This distribution in intestinal tissue was unchanged between the four groups.
Figure 4.
Figure 5.
DISCUSSION
HTS prevents intestinal edema formation redistributes fluid from the interstitium to the intravascular, intraluminal, and peritoneal spaces. To explain the fluid redistribution induced by HTS, we correlated the findings with our previously published data regarding pressure-flow differentials in the interstitium, lymphatic and venous systems. Mathematical modeling of fluid dynamics allows for the study of membrane characteristics, such as conductivity, by examining fluid flux and pressure across a given membrane.
Our results are limited by several factors. We assumed that capillary pressures reflected venous pressures. As the major pressure reduction is across the arterioles, and valves are not present across the capillaries/venules, the pressure differential between the capillaries and veins should be minor, as demonstrated by previous studies (21).
We measured lymphatic pressure as “stop flow” pressure; thus, lymphatic pumping against fixed resistance may have led to overestimation of the unobstructed pressures. Furthermore, because the lymphatic outflow was at zero pressure and not CVP, the interplay of pumping and the true lymphatic pressure to CVP gradient was not assessed. Whether this affected our results significantly is unknown; however, these factors were constant across all experimental groups. This model enhances significantly microvascular fluid flux hydrostatically by raising venous (and therefore capillary) pressures; the resulting fluid flux increases interstitial pressure. Under these circumstances (“downhill” axial pressure gradient), we and others have shown that lymphatics function primarily as dilated conduits and have little pumping behavior (7, 22–29). For this reason, we believe the estimation of lymphatic pressure was reasonable. Setting the lymphatic outflow pressure to atmospheric (cannula resistance considered negligible) may have enhanced lymph flow (and, in turn, edema resolution) in the RESUS + VH + VEH group only; the CVP was 4 mm Hg in the RESUS + VH + VEH group and approximately 1 mm Hg in all other groups. If the outflow pressure was set to 4 mm Hg, this would have served to enhance edema accumulation in this group and add further differences between groups. Additionally, the modeled system and localization of aquaporins were consistent with the observed redistribution of fluid after HTS administration.
We utilized two sets of animals for the pressure and fluid flux measurements, respectively. Both experimental protocols were identical. Both sets of animals developed significant edema at 30 mins; in the set of animals used for fluid flux determination, there was a significantly higher W/D ratio in the RESUS + VH + VEH (4.02 ± 0.09) vs. CONTROL + VEH (3.21 ± 0.14) after 30 mins.
Changes in conductivity occur rapidly; we have demonstrated that edema and activation of signaling pathways, such as STAT-3, occur as soon as 30 mins after experimentation (26). In addition, rapid decreases in lymphatic pressure and CVP and lymphatic flow are seen with HTS (7).
As high-volume crystalloid resuscitation is associated with development of brain and lung edema, we measured and compared brain and lung W/D ratios. In our model, there were no statistically significant differences in W/D ratios between the CONTROL and RESUS + VH groups (data not shown). This is not entirely unexpected, as there was no direct injury to these organ systems.
HTS has been associated, in some studies, with electrolyte disturbances, notably hyperchloremia and acidosis. The published data, however, is inconsistent and may reflect the transient nature of electrolyte changes seen with HTS (27). In our model, at 6 hrs, although there are some statistical differences, there are no clinically significant differences in pH or chloride in the CONTROL (7.34 –7.43, 103–107) or RESUS + VH groups (7.33–7.35, 105–112). HTS did have a consistent effect on either serum pH or chloride. However, in certain patients, alternative resuscitation strategies (i.e., Monoafo hypertonic lactated saline) may be indicated.
HTS administration favors fluid flux out of the intestine, presumably by altering the hydraulic conductivity at the mucosal and the seromuscular layers of the intestine. These changes favor fluid flux into the bowel lumen and peritoneal cavity. The decreases in pressure and changes in conductivity may be due to an overall increased effective microvascular exchange surface area, allowing for more rapid and efficient fluid flux from the interstitium.
Large-volume crystalloid resuscitation and mesenteric venous hypertension may serve to alter conductivity of the microcirculation including the capillaries, which may be important in the development interstitial edema (28). The interstitium is not a static matrix that absorbs excess fluid but represents a dynamic entity that changes conductivity in response to stressors. Our data suggest that HTS offers a means to manipulate the hydraulic conductivity of the bowel to enhance edema resolution.
As we were interested in a mechanistic explanation for fluid shifts, we specifically examined the microarray data for plasma membrane water transport proteins. It is important to note the significance of actin cytoskeletal signaling with administration of HTS. We have shown previously that there are changes in stress fiber formation and F/G actin ratios with administration of HTS (18). This may affect the activity of aquaporin channels. Aquaporins 2, 4, 5, 8, and 9 were differentially regulated in intestinal edema and after HTS administration. Based on the known functions and locations of these aquaporins, only aquaporin 4 was noted to involve primarily the small intestine as well as involve edema formation and resolution (11, 12, 29). Western blotting demonstrated that aquaporin 4 protein levels are decreased significantly in intestinal edema and augmented with HTS administration.
Although protein levels of aquaporin 4 are increased with HTS relative to edema animals, this provides little information into the mechanism of edema formation and resolution. Cellular membrane hydraulic conductivity may be driven at certain interfaces by aquaporins. Although the complete mechanism of action of HTS is unclear, we propose that HTS initiates cytoskeletal signaling pathways (18) that may lead to a subsequent relative increase in aquaporin 4 activity as well as changes in the hydraulic conductivity of the bowel, with intestinal edema resolution.
The mechanism responsible for the increased bowel conductivity afforded by aquaporin 4 may be similar to that which is thought to govern capillary permeability. Alterations in microvascular oncotic and hydrostatic pressures lead to microvascular filtration and subsequent interstitial edema (30). Net filtration is affected by effective surface area as well as the characteristics of the pores or channels that allow for fluid shifts. HTS, theoretically, may increase the filtration through or permeability of the aquaporin 4 channel by increasing the quality and/or quantity of effective pores or conduits that allow for fluid shifts. An increase in activity may be seen without a concurrent increase in expression. Immunohistochemistry data suggest that aquaporin 4 may play a role at the mucosal and submucosal interfaces, and may partly explain the increased intraluminal fluid seen with the concurrent administration of HTS.
The data presented are important because intestinal edema can be a quantifiable therapeutic target to be considered when designing new resuscitative strategies. In addition, these data suggest a new mechanism for the resolution of acute intestinal edema and provide insight into therapeutic modalities to curtail ileus formation. Pharmacologic manipulation of aquaporin 4 may represent a potential therapeutic target.
Figure 6.
Figure 7.
Acknowledgments
This study was supported, in part, by Grants 5KO8 GM00675, T32 GM08792, P50 GM38529, P30 DK56338, RO1 HL36115, and KO1 DK 070758 from the National Institutes of Health and Grant CCU620069 from the Centers for Disease Control and Prevention.
Footnotes
The authors have not disclosed any potential conflicts of interest.
REFERENCES
- 1.Barden SP, Thompson WD, Ravdin IS, et al. The influence of the serum protein on the motility of the small intestine. Surg Gynecol Obstet. 1938;66:819–821. [Google Scholar]
- 2.Ravdin IS. Hypoproteinemia and its relation to surgical problems. Ann Surg. 1940;112:576–583. doi: 10.1097/00000658-194010000-00010. [DOI] [PMC free article] [PubMed] [Google Scholar]
- 3.Moore FA, Feliciano DV, Andrassy RJ, et al. Early enteral feeding, compared with parenteral, reduces postoperative septic complications. The results of a meta-analysis. Ann Surg. 1992;216:172–183. doi: 10.1097/00000658-199208000-00008. [DOI] [PMC free article] [PubMed] [Google Scholar]
- 4.Moore-Olufemi SD, Xue H, Attuwaybi BO, et al. Resuscitation-induced gut edema and intestinal dysfunction. J Trauma. 2005;58:264–270. doi: 10.1097/01.ta.0000133571.64393.d2. [DOI] [PubMed] [Google Scholar]
- 5.Uray KS, Laine GA, Xue H, et al. Intestinal edema decreases intestinal contractile activ-ity via decreased myosin light chain phosphorylation. Crit Care Med. 2006;34:2630–2637. doi: 10.1097/01.CCM.0000239195.06781.8C. [DOI] [PubMed] [Google Scholar]
- 6.Radhakrishnan RS, Xue H, Weisbrodt N, et al. Resuscitation-induced intestinal edema decreases the stiffness and residual stress of the intestine. Shock. 2005;24:165–170. doi: 10.1097/01.shk.0000168873.45283.4c. [DOI] [PubMed] [Google Scholar]
- 7.Cox CS, Jr, Radhakrishnan R, Villarrubia L, et al. Hypertonic saline modulation of intestinal tissue stress and fluid balance. Shock. 2008;29:598–602. doi: 10.1097/SHK.0b013e318157eba7. [DOI] [PubMed] [Google Scholar]
- 8.Radhakrishnan RS, Xue H, Moore-Olufemi SD, et al. Hypertonic saline resuscitation prevents hydrostatically induced intestinal edema and ileus. Crit Care Med. 2006;34:1713–1718. doi: 10.1097/01.CCM.0000218811.39686.3D. [DOI] [PubMed] [Google Scholar]
- 9.Matsuzaki T, Tajika Y, Ablimit A, et al. Aquaporins in the digestive system. Med Electron Microsc. 2004;37:71–80. doi: 10.1007/s00795-004-0246-3. [DOI] [PubMed] [Google Scholar]
- 10.King LS, Kozono D, Agre P. From structure to disease: the evolving tale of aquaporin biology. Nat Rev Mol Cell Biol. 2004;5:687–698. doi: 10.1038/nrm1469. [DOI] [PubMed] [Google Scholar]
- 11.Bloch O, Manley GT. The role of aquaporin-4 in cerebral water transport and edema. Neurosurg Focus. 2007;22:E3. doi: 10.3171/foc.2007.22.5.4. [DOI] [PubMed] [Google Scholar]
- 12.Butler TL, Au CG, Yang B, et al. Cardiac aquaporin expression in humans, rats, and mice. Am J Physiol Heart Circ Physiol. 2006;291:H705–H713. doi: 10.1152/ajpheart.00090.2006. [DOI] [PubMed] [Google Scholar]
- 13.Hamabata T, Liu C, Takeda Y. Positive and negative regulation of water channel aqua-porins in human small intestine by cholera toxin. Microb Pathog. 2002;32:273–277. doi: 10.1006/mpat.2002.0502. [DOI] [PubMed] [Google Scholar]
- 14.Wang JP, Hou XH. Expression of aquaporin 8 in colonic epithelium with diarrhoea-predominant irritable bowel syndrome. Chin Med J (Engl) 2007;120:313–316. [PubMed] [Google Scholar]
- 15.Yamamoto T, Kuramoto H, Kadowaki M. Downregulation in aquaporin 4 and aquaporin 8 expression of the colon associated with the induction of allergic diarrhea in a mouse model of food allergy. Life Sci. 2007;81:115–120. doi: 10.1016/j.lfs.2007.04.036. [DOI] [PubMed] [Google Scholar]
- 16.Velasco IT, Pontieri V, Rocha e Silva M, Jr, et al. Hyperosmotic NaCl and severe hemorrhagic shock. Am J Physiol. 1980;239:H664–H673. doi: 10.1152/ajpheart.1980.239.5.H664. [DOI] [PubMed] [Google Scholar]
- 17.Moore-Olufemi SD, Xue H, Allen SJ, et al. Inhibition of intestinal transit by resuscitation-induced gut edema is reversed by L-NIL. J Surg Res. 2005;129:1–5. doi: 10.1016/j.jss.2005.04.041. [DOI] [PubMed] [Google Scholar]
- 18.Radhakrishnan RS, Radhakrishnan HR, Xue H, et al. Hypertonic saline reverses stiffness in a Sprague-Dawley rat model of acute intestinal edema, leading to improved intestinal function. Crit Care Med. 2007;35:538–543. doi: 10.1097/01.CCM.0000254330.39804.9C. [DOI] [PubMed] [Google Scholar]
- 19.Knapowski J. A method for measurements of hydraulic conductivity of biological membranes in vitro. J Physiol Pharmacol. 1997;48:97–109. [PubMed] [Google Scholar]
- 20.Bollman JL, Cain JC, Grindlay JH. Techniques for the collection of lymph from the liver, small intestine, or thoracic duct of the rat. J Lab Clin Med. 1948;33:1349–1352. [PubMed] [Google Scholar]
- 21.Davis MJ, Gore RW. Capillary pressures in rat intestinal muscle and mucosal villi during venous pressure elevation. Am J Physiol. 1985;249:H174–H187. doi: 10.1152/ajpheart.1985.249.1.H174. [DOI] [PubMed] [Google Scholar]
- 22.Meisner JK, Stewart RH, Laine GA, et al. Lymphatic vessels transition to state of summation above a critical contraction frequency. Am J Physiol Regul Integr Comp Physiol. 2007;293:R200–R208. doi: 10.1152/ajpregu.00468.2006. [DOI] [PubMed] [Google Scholar]
- 23.Quick CM, Venugopal AM, Dongaonkar RM, et al. First-order approximation for the pressure-flow relationship of spontaneously contracting lymphangions. Am J Physiol Heart Circ Physiol. 2008;294:H2144–H2149. doi: 10.1152/ajpheart.00781.2007. [DOI] [PubMed] [Google Scholar]
- 24.Quick CM, Venugopal AM, Gashev AA, et al. Intrinsic pump-conduit behavior of lymphangions. Am J Physiol Regul Integr Comp Physiol. 2007;292:R1510–R1518. doi: 10.1152/ajpregu.00258.2006. [DOI] [PubMed] [Google Scholar]
- 25.Venugopal AM, Stewart RH, Laine GA, et al. Lymphangion coordination minimally affects mean flow in lymphatic vessels. Am J Physiol Heart Circ Physiol. 2007;293:H1183–H1189. doi: 10.1152/ajpheart.01340.2006. [DOI] [PubMed] [Google Scholar]
- 26.Uray KS, Laine GA, Xue H, et al. Edemainduced intestinal dysfunction is mediated by STAT3 activation. Shock. 2007;28:239–244. doi: 10.1097/shk.0b013e318033eaae. [DOI] [PubMed] [Google Scholar]
- 27.Moon PF, Kramer GC. Hypertonic salinedextran resuscitation from hemorrhagic shock induces transient mixed acidosis. Crit Care Med. 1995;23:323–331. doi: 10.1097/00003246-199502000-00019. [DOI] [PubMed] [Google Scholar]
- 28.Granger DN, Kvietys PR, Wilborn WH, et al. Mechanism of glucagon-induced intestinal secretion. Am J Physiol. 1980;239:G30–G38. doi: 10.1152/ajpgi.1980.239.1.G30. [DOI] [PubMed] [Google Scholar]
- 29.Zhao J, Moore AN, Clifton GL, et al. Sulforaphane enhances aquaporin-4 expression and decreases cerebral edema following traumatic brain injury. J Neurosci Res. 2005;82:499–506. doi: 10.1002/jnr.20649. [DOI] [PubMed] [Google Scholar]
- 30.Staub NC, Taylor AE. Edema. Raven Press; New York: 1984. [Google Scholar]


