

Abstract
Phenotypic differences between closely related species are thought to arise primarily from changes in gene expression due to mutations in cis-regulatory sequences (enhancers). However, it has remained unclear how frequently mutations alter enhancer activity or create functional enhancers de novo. Here we use STARR-seq, a recently developed quantitative enhancer assay, to determine genome-wide enhancer activity profiles for five Drosophila species in the constant trans-regulatory environment of Drosophila melanogaster S2 cells. We find that the functions of a large fraction of D. melanogaster enhancers are conserved for their orthologous sequences owing to selection and stabilizing turnover of transcription factor motifs. Moreover, hundreds of enhancers have been gained since the D. melanogaster–Drosophila yakuba split about 11 million years ago without apparent adaptive selection and can contribute to changes in gene expression in vivo. Our finding that enhancer activity is often deeply conserved and frequently gained provides functional insights into regulatory evolution.
Ever since Darwin’s model of evolution became widely accepted, scientists have been intrigued by the question of how random mutations could have led to the phenotypic differences between species. It is commonly thought that mutations in cis-regulatory sequences are responsible for changes in gene expression and phenotype, especially among closely related species1–4. Individual examples of phenotypic differences caused by sequence changes indeed exist in insects (for examples, see refs. 5–7) and vertebrates (for example, see ref. 8). However, it has remained unclear how often mutations alter enhancer activity and, in particular, how frequently they can create functional enhancers de novo from non-functional sequences. Conservation and divergence of enhancer function have been studied across genomes by indirect means (for example, via regulator binding or chromatin marks9–12) rather than directly because no method existed to measure enhancer activity and strength across entire genomes. Thus, genome-wide estimates of conservation, divergence or gain of enhancer function remained elusive. Here we use STARR-seq (self-transcribing active regulatory region sequencing), a recently developed quantitative enhancer assay13, to determine enhancer activity profiles for the entire genomes of five Drosophila species14,15 in the constant trans-regulatory environment of D. melanogaster S2 cells. We find that a large fraction of sequences orthologous to D. melanogaster enhancers are also active, indicating functional conservation of enhancer activity. We also find that hundreds of sequences have gained activity compared to their inactive orthologs within short evolutionary timespans and without apparent adaptive selection. The differences in enhancer activity we observe between different species can contribute to changes in gene expression in vivo. Our finding that enhancer activity is often deeply conserved and frequently gained provides functional insights into regulatory evolution and its molecular mechanisms, which are of fundamental importance for understanding evolution.
RESULTS
High conservation of D. melanogaster enhancer function
To study the evolution of enhancer sequences and their function (activity and strength) across the genomes of closely related species, we performed STARR-seq with the genomic DNA of five Drosophila species (D. melanogaster, D. yakuba, Drosophila ananassae, Drosophila pseudoobscura and Drosophila willistoni) in D. melanogaster S2 cells, a widely used Drosophila cell line. These species span an evolutionary distance of 30–40 million years and a range of neutral sequence divergence equivalent to a large part of the vertebrate phylogeny14,15. Notably, by determining the enhancer activities for the genomes of all five species in a single cell type, we can ensure that differences in activity are due to sequence changes (in cis) rather than changes in the cellular trans-regulatory environment16. Excluding such trans effects was also a main goal in previous studies that assessed differences in gene expression or regulator binding and chromatin marks (for example, see refs. 17,18). We mapped the reads from paired-end sequencing of the input and STARR-seq samples to the genome of each species and translated them to D. melanogaster coordinates for further analysis (Fig. 1a). For each of the species, STARR-seq results were highly reproducible, with Pearson correlation coefficients (PCCs) of >0.9 between biological replicates (Supplementary Figs. 1 and 2).
Figure 1.
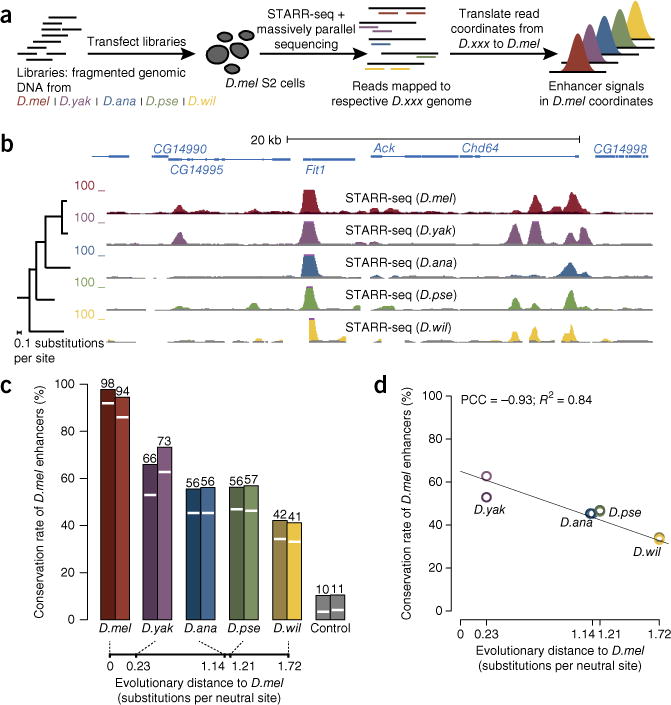
Functional conservation of D. melanogaster S2 cell enhancers. (a) Schematic overview of STARR-seq enhancer screens for the genomes from different Drosophila species (D.mel, D. melanogaster; D.yak, D. yakuba; D.ana, D. ananassae; D.pse, D. pseudoobscura; D.wil, D. willistoni; D.xxx, any Drosophila species) in a single cell type (here D. melanogaster S2 cells). (b) UCSC Genome Browser screenshot depicting a 30-kb genomic locus with STARR-seq tracks for each species (inputs in gray; y axes depict normalized fragment counts). (c) Functional conservation rates of D. melanogaster enhancers in the four other Drosophila species (white lines, P ≤ 0.001; bar heights, P ≤ 0.05; n = 2,325 enhancers). Background conservation levels were assessed using shifted genomic coordinates as controls. For D. melanogaster, conservation rates between biological replicates are shown (n = 2,139 and 2,361 enhancers; see supplementary Fig. 1 for replicates in the other species and supplementary Fig. 3 for the separate analysis of open and closed enhancers). The evolutionary distances of each species from D. melanogaster are indicated (bottom). (d) Conservation rates from c (stringent cutoff of P ≤ 0.001) versus the pairwise evolutionary distance of each species to D. melanogaster (darker and lighter colors depict replicates 1 and 2, respectively).
We will refer to enhancer activity that is shared by orthologous sequences as ‘functional conservation’, independent of the similarity of the sequences (that is, independent of ‘sequence conservation’). This definition can, for example, account for the conservation of enhancer function by dissimilar sequences, which has been observed frequently for enhancers (for examples, see refs. 19–21). We found that the 2,325 D. melanogaster enhancers (enrichment of ≥3-fold and P value ≤ 0.001; false discovery rate (FDR) < 0.1%; Supplementary Table 1 and Supplementary Data Set 1) were highly functionally conserved (enrichment P ≤ 0.001; Fig. 1b): 58% of the D. melanogaster enhancers were functionally conserved in D. yakuba and 46% were conserved in D. ananassae and D. pseudoobscura, which are at evolutionary distances from D. melanogaster comparable to the distances between human and mouse and between human and chicken, respectively14. Even in D. willistoni, which is evolutionarily more distant from D. melanogaster than lizard is from human, 34% of the D. melanogaster enhancers were functionally conserved (compared to 4% of control sequences; Fig. 1c). Using more sensitive settings that took all detectable enhancer activities (enrichment P ≤ 0.05) into account22, between 42% (D. willistoni) and 70% (D. yakuba) of the D. melanogaster enhancers were functional across species (Fig. 1c).
Overall, the conservation rate was strongly correlated with evolutionary distance as measured by the number of substitutions at neutral sites14, suggesting that the evolution of enhancer function might follow a molecular clock, with the activity of about 4% of the enhancers being lost every 10 million years (Fig. 1d).
STARR-seq measures enhancer activity for sequences that in their endogenous genomic context can be ‘open’ (located in DNase I–hypersensitive regions) or ‘closed’ (ref. 13). Whereas closed enhancers function in reporter assays and are specifically labeled by the general enhancer mark monomethylation of histone H3 at lysine 4 (H3K4me1), they are not accessible to DNase I and lie in broad regions of repressive trimethylation at lysine 27 of histone H3 (H3K27me3), suggesting that their genomic loci are silenced at the chromatin level13. We wanted to compare the functional conservation of open and closed enhancers—enhancers that in vivo are likely active or silenced, respectively. Interestingly, whereas open and closed enhancers were about equally well reproducible in independent biological replicates, closed enhancers were functionally conserved only about half as frequently (Supplementary Fig. 3). This finding suggests that the activity of open enhancers in S2 cells is preserved during evolution, whereas the silenced endogenous state of closed enhancers presumably means that their enhancer function in S2 cells cannot be efficiently selected for (even if the sequences maintained other putative functions). This hypothesis argues that the frequently observed conservation of enhancer function over large evolutionary distances (for examples, see refs. 19,20,23,24) likely stems from specific stabilizing selection, presumably acting to maintain functional sequence elements.
Extending enhancer conservation to gene loci
In addition to positional conservation of enhancers at orthologous positions, we also found examples of apparent enhancer activity turnover and compensatory activity changes within specific gene loci. For example, the D. melanogaster pyramus (pyr) gene contained an enhancer in its first intron ~3.3 kb downstream of the transcription start site (TSS). In contrast, the orthologous gene locus in all other species contained an intergenic enhancer ~1.5 kb upstream of the TSS, while the D. yakuba sequence orthologous to the functional D. melanogaster enhancer was only weakly active in S2 cells and the sequences for the other species were entirely inactive (Fig. 2a). Overall, the fraction of enhancers that were shared by orthologous gene loci and might contribute to gene expression yet were not positionally aligned increased from ~22% in D. yakuba to ~46% in D. willistoni (Fig. 2b and Supplementary Fig. 4). The enhancers that appeared to functionally complement each other had similar motif compositions, as expected for enhancers with similar or equivalent functions (Fig. 2c). This finding suggests that enhancer turnover and compensatory changes are common and substantially contribute to the evolution of transcriptional regulation, consistent with reports based on individual gene loci, transcription factor binding and enhancer-associated chromatin features9–12,25.
Figure 2.
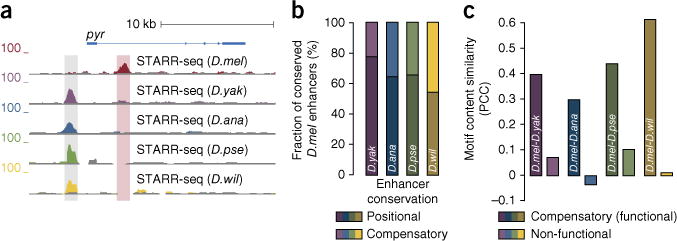
Compensatory enhancers stabilize total enhancer strengths for gene loci. (a) D. melanogaster lost a deeply conserved enhancer upstream of the pyr gene (shaded in gray) but gained an intronic enhancer in the same gene locus (shaded in red; UCSC Genome Browser screenshot; details as in Fig. 1b). (b) The fraction of compensatory versus positional enhancer conservation increases with evolutionary distance. Shown are the relative contributions of positional (bottom) and compensatory (top) enhancer conservation for all pairwise comparisons of D. melanogaster with each of the other species (for absolute contributions, see supplementary Fig. 4). (c) Motif similarity of compensatory enhancers. Pairs of putative compensatory enhancers have motif content that is more similar than their respective non-functional orthologous sequences (measured by PCC for motif enrichment; numbers of compensatory enhancer pairs considered (left to right): 28, 37, 74 and 69).
Specific selection of transcription factor sequence motifs
Consistent with previous studies on individual enhancers19–21, pairs of orthologous enhancers that were equally strong (<1.5-fold difference in activity) showed no substantial increase in overall sequence similarity compared to enhancers with diverged (lost) function (4–6% difference in sequence identity between medians) (Fig. 3a). In contrast, when considering only positions that corresponded to binding motifs for Serpent (Srp), a transcription factor that is important for S2 cell morphology and growth26, differences were up to twofold greater between the two classes of enhancers (6–12% difference in sequence identity; Fig. 3b), a substantial difference that we did not observe for binding motifs for the Buttonhead (Btd) transcription factor, which is not expressed in S2 cells (Supplementary Fig. 5). This finding links functional conservation of enhancer activity to the sequence conservation of transcription factor motifs rather than the overall enhancer and suggests a means to identify transcription factor motifs that are important in S2 cells. When we scored all known transcription factor motifs by their increased conservation in functionally conserved enhancers, motifs for mesodermal transcription factors such as Srp and Mef2 scored highly, suggesting that transcription factors with highly scoring motifs might be active in S2 cells. Indeed, eight of the ten highest scoring motifs corresponded to transcription factors that are expressed in S2 cells (reads per kilobase per million (RPKM) ≥ 1; Fig. 3c and Supplementary Table 2). Overall, such increased motif conservation was observed frequently for transcription factors expressed in S2 cells (RPKM ≥ 1) but not for non-expressed transcription factors or shuffled control motifs (≥2.9-fold difference; Fig. 3d).
Figure 3.
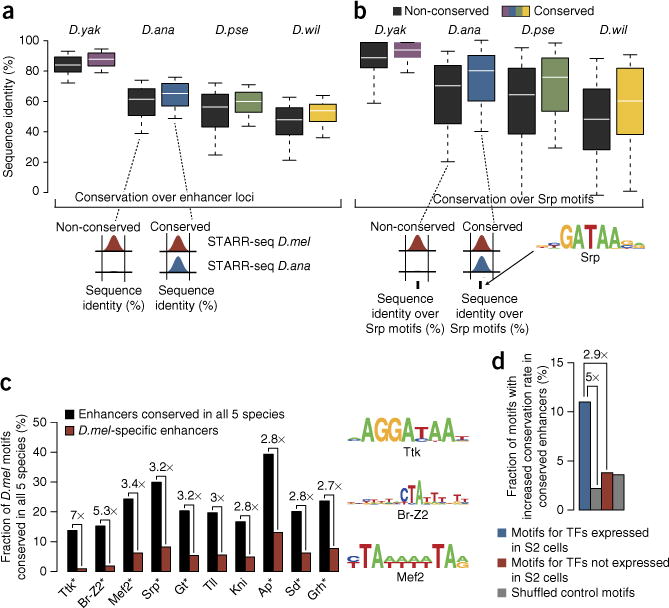
Motif conservation by positional sequence constraints. (a) Pairwise sequence identity for functionally non-conserved (black) and conserved (colored) enhancers along the entire 501-bp D. melanogaster enhancer sequences (boxes depict the median and interquartile range, and whiskers depict the 10th and 90th percentiles). (b) Sequence identity as in a but restricted to positions within the 501-bp enhancer sequences that match motifs for the Srp transcription factor. The number of enhancers examined was (left to right) 214, 338, 413 and 196 in a and 361, 216, 366 and 174 in b. (For equivalent analyses of 101-bp core enhancer regions and the corresponding analyses for an unrelated transcription factor motif, see supplementary Fig. 5). (c) Transcription factor motif conservation in functionally conserved versus non-conserved (D. melanogaster–specific) enhancers. Shown are the ten transcription factors for which motif conservation in functionally conserved enhancers was most strongly increased (numbers on top indicate fold increase; all increases are significant, P ≤ 0.05); eight of these are expressed in S2 cells (an asterisk indicates RPKM ≥ 1; supplementary table 2). (d) Transcription factors (TFs) that are expressed in S2 cells more frequently show increased motif conservation than transcription factors that are not expressed or shuffled control motifs (cutoff P ≤ 0.01; n (left to right) = 91, 91, 160 and 160 motifs).
Compensatory changes stabilize regulatory output
In addition to conservation of transcription factor motifs at orthologous (aligned) positions, enhancers showed substantial motif turnover, and motif losses were compensated by motif gains at non-orthologous positions (for an example, see ref. 21). The fraction of compensatory motifs among all motifs shared by orthologous enhancers with equal strengths increased from ~4% between D. melanogaster and D. yakuba to 32% between D. melanogaster and D. willistoni (Fig. 4a) and substantially contributed to maintaining a similar number of motifs (Fig. 4a,b and Supplementary Fig. 6). Indeed, 48% of all enhancers that had an identical number of Srp motifs in D. melanogaster and D. willistoni showed motif turnover and the presence of compensatory motifs. The fractions of compensatory motifs were consistent with estimates based on individual enhancer loci, genome sequence alignments and/or transcription factor binding across species (for examples, see refs. 9,10,12,27,28).
Figure 4.
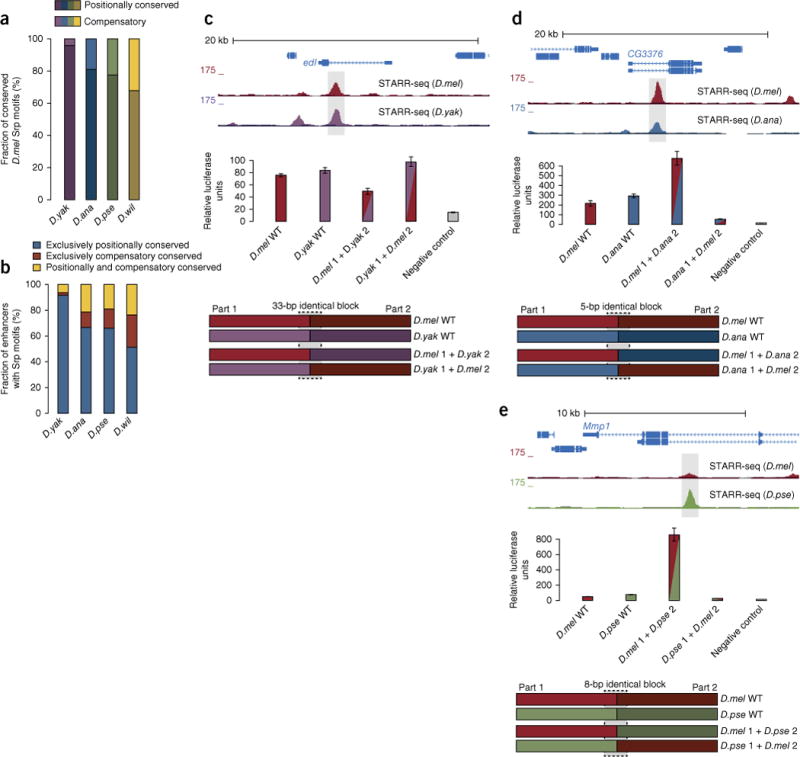
Compensatory motif turnover in functionally conserved enhancers. (a) Fraction of compensatory motif conservation (top) by turnover compared to positional motif conservation (bottom) for motifs of the Srp transcription factor. (b) Fraction of functionally conserved enhancers with the same number of Srp motifs between species for which all motifs are positionally conserved, all motifs are conserved within the enhancer sequence but not at identical positions (compensatory), or some motifs are positionally conserved and others are compensatory. (For absolute conservation rates, see supplementary Fig. 6.) (c) UCSC Genome Browser screenshot for a D. melanogaster enhancer in the ETS-domain lacking (edl) intron that is functionally conserved in D. yakuba (top; candidate enhancers are shaded in gray) and corresponding wild-type and hybrid enhancer constructs (bottom; details as in Fig. 1b). Highlighted is a sequence block that is identical in both species and allowed a seamless transition between the two halves in the hybrids. Results are shown for luciferase assays of corresponding wild-type (WT) and hybrid enhancer constructs (middle). Negative control refers to a non-enhancer sequence as in ref. 13. (d, e) Hybrid enhancer tests as in c for two additional enhancers in D. melanogaster and D. ananassae (d) and D. melanogaster and D. pseudoobscura (e). All wild-type enhancers show similar STARR-seq and luciferase activities, whereas the activities of the hybrids deviate substantially from wild-type levels and from each other. Error bars show s.d. from three biological replicates; relative luciferase units were normalized to Renilla luciferase signal.
We experimentally assessed the role of motif turnover and compensatory motifs for the maintenance of enhancer function during evolution using hybrid enhancers21,28. For this analysis, we fused one-half of a D. melanogaster enhancer to the other half of the orthologous enhancer from another Drosophila species and vice versa, joining the two sequences seamlessly via sequence stretches that were identical in the two species (Fig. 4c–e). If all functionally relevant sequence features were exclusively conserved at orthologous positions, wild-type enhancers and both hybrid enhancers should all have the same activity. In contrast, the hybrid enhancers would have different activities if motifs that were lost from one half of an enhancer were compensated for by motifs gained in the other half21,28. Indeed, for all three D. melanogaster enhancers and their orthologous enhancers from D. yakuba, D. ananassae or D. pseudoobscura, respectively, we observed that the hybrid enhancers had very different activities in luciferase assays, in contrast to the wild-type enhancers for which the activities were similar (Fig. 4c–e). This finding illustrates the key role of compensatory motif turnover in the functional conservation of enhancer activity, even at close evolutionary distances.
Frequent enhancer gains between closely related species
We next defined enhancers in each species separately by thresholding the respective STARR-seq enrichment values (enrichment ≥ 3-fold and P ≤ 0.001; FDR < 0.1%). This analysis identified a comparable number of enhancers in each species (D. melanogaster, 2,325; D. yakuba, 2,293; D. ananassae, 2,096; D. pseudoobscura, 3,469; D. willistoni, 2,860; Supplementary Table 1 and Supplementary Data Set 1) with a similar genomic distribution (Supplementary Fig. 2). We mapped the binary activity status (0 or 1) of each of the 8,180 non-redundant enhancer regions found in at least 1 species to the phylogenetic tree for these species (Supplementary Fig. 7a) and inferred evolutionary enhancer gain and loss events by parsimony (Online Methods and Supplementary Fig. 7b). This analysis identified a substantial number of enhancer gains in each of the species, especially in the evolutionarily distant D. pseudoobscura (1,248 gains) and D. willistoni (1,216 gains) (Fig. 5a,b).
Figure 5.
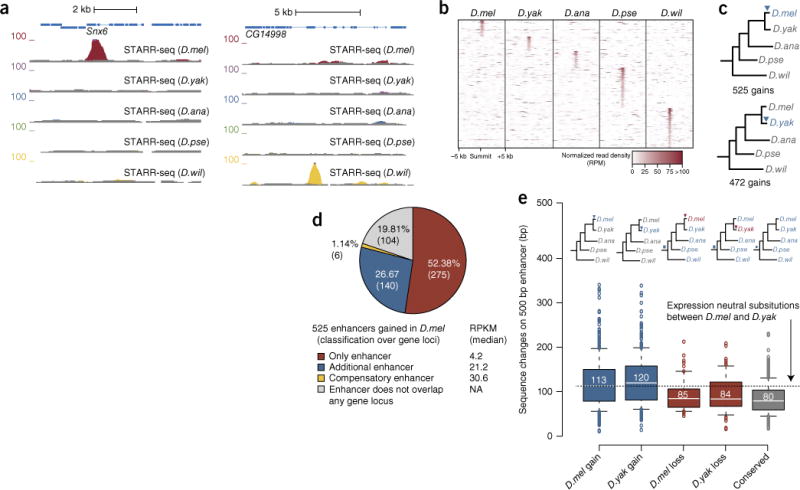
Species-specific gained enhancers and associated sequence changes. (a) UCSC Genome Browser screenshots with a gained enhancer in D. melanogaster (left) and D. willistoni (right; details as in Fig. 1b). (b) Heat map centered on the enhancer summit positions of species-specific enhancers that show read fragment densities at orthogonal positions across all five screened species. The distant D. pseudoobscura and D. willistoni species in particular contribute a substantial number of species-specific enhancers. RPM, reads per million. (c) Enhancers gained in D. melanogaster or D. yakuba. Shown are the number of gains and the branch in which the gains occurred (blue triangles on phylogenetic trees). (d) Classification of newly gained enhancers that are specific to D. melanogaster. NA, not applicable. (e) Sequence changes between D. melanogaster and D. yakuba across enhancers gained in D. melanogaster or D. yakuba (blue) versus ancient enhancers lost specifically in either D. melanogaster or D. yakuba (red) or deeply conserved ancient enhancers (gray). The dashed line indicates the expected number of sequence changes based on estimates from fourfold-degenerate sites in protein-coding sequences14. Boxes depict the median and interquartile range, and whiskers depict the 10th and 90th percentiles; outliers are shown individually. The number of enhancers examined (from left to right) was 525, 472, 69, 84 and 370.
Even since the recent split between D. melanogaster and D. yakuba about 11 million years ago, 525 and 472 enhancers were gained in these species, respectively (Fig. 5c), for which the orthologous sequences in all other species were not active. Of the enhancers gained in D. melanogaster, 140 were next to genes with other, evolutionarily older enhancers, 6 appeared to compensate for the D. melanogaster–specific loss of an ancestral enhancer, and 275 were the only enhancers in the vicinity of 261 genes (Fig. 5d). The majority of the gained enhancers in D. melanogaster and D. yakuba (70%; 365/525 and 331/472, respectively) arose de novo from non-functional sequences and did not constitute relative gains in enhancer activity between species, as none of the orthologous sequences were detectably active, even at a more sensitive cutoff (P ≤ 0.05). The same was true for enhancers gained in D. pseudoobscura and D. willistoni (919/1,248 = 74% and 903/1,216 = 74% de novo gains, respectively). This finding excludes the possibility that enhancer gains arose from thresholding issues22 and were more quantitative in nature, potentially related to changes in the trans-regulatory environments of the respective species in vivo (for example, see ref. 29).
Enhancers gained in D. melanogaster had 113 nucleotide differences on average (along the 501-bp enhancer regions; 22.5%) compared to their inactive orthologous sequences in D. yakuba. Similarly, D. yakuba–specific enhancers differed from their orthologous sequences in D. melanogaster by 120 nucleotides (24%) on average (Fig. 5e and Supplementary Fig. 8). These numbers are comparable to the frequency of sequence mutations at fourfold-degenerate sites in aligned protein-coding regions14. For comparison, there was a difference of 80 nucleotides (16%) for enhancers that functioned in all five species and a difference of 85 nucleotides (17%) for enhancers that lost activity specifically in D. melanogaster (84 nucleotides for losses in D. yakuba). These observations suggest that hundreds of sequences can gain enhancer activity during only about 10 million years of evolution. More than half of all enhancers gained in D. melanogaster (265 or 50.5%) were next to genes that are expressed in S2 cells, as determined by RNA sequencing (RNA-seq), and might thus contribute to the expression of these genes. This was especially true for the 149 gained enhancers that were the only enhancers in the vicinity of 143 expressed genes, including Snx6, Hira and roq (Supplementary Fig. 9).
Evolution of OSC enhancers and in vivo gene expression
To study the relationship between the evolution of enhancers and gene expression, we chose ovarian somatic cells (OSCs), which have only recently been derived from adult ovaries and for which a close in vivo counterpart (ovarian follicle cells) exists30. OSCs retained marker gene expression and other functional aspects30, including the function of OSC enhancers in vivo13.
We performed STARR-seq in D. melanogaster OSCs with genomic DNA from D. melanogaster, D. yakuba and D. ananassae, which we treated as an outgroup in the identification of enhancer gains in D. melanogaster and D. yakuba (Supplementary Figs. 10 and 11a–c, Supplementary Table 1 and Supplementary Data Set 1). Similar to the results in S2 cells, this analysis identified a high degree of functional conservation for D. melanogaster OSC enhancers, ranging from 69% in D. yakuba to 46% in D. ananassae (Fig. 6a), and confirmed the substantial difference in functional conservation for open and closed enhancers (Supplementary Fig. 11d,e). We found that 1,012 enhancers were specific to D. melanogaster, a number comparable to the 890 D. melanogaster–specific enhancers we identified in S2 cells when we evaluated S2 cell data across the same three species.
Figure 6.
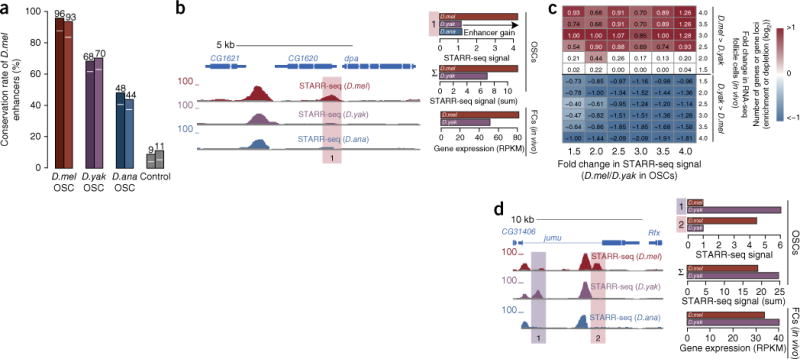
Evolution of enhancer activity in OSCs and gene expression in follicle cells in vivo. (a) Functional conservation rates of D. melanogaster OSC enhancers (as in Fig. 1c; n = 3,342 enhancers; n = 3,077 and 3,313 enhancers for D. melanogaster replicates; see also supplementary Fig. 11d,e). (b) A D. melanogaster–specific OSC enhancer gain correlates with higher gene expression in D. melanogaster follicle cells in vivo. Shown is a screenshot (details as in Fig. 1b) of the CG1620 locus with a D. melanogaster–specific enhancer gain (1; orange) and bar plots that display OSC enhancer activity (STARR-seq signal) at the position of the gained enhancer (top), the sum of OSC enhancer activities for the CG1620 gene locus (middle) and the expression of CG1620 in D. melanogaster and D. yakuba follicle cells (FCs) in vivo (bottom). (c) Changes in OSC enhancer activities and follicle cell in vivo gene expression between D. melanogaster and D. yakuba correlate globally. Genes that are more highly expressed in D. melanogaster (toward the top) also have higher OSC enhancer activities in D. melanogaster on average (their enrichment among genes with ≥1.5- to ≥4-fold higher enhancer activities in D. melanogaster is coded in shades of red). In contrast, genes that are more highly expressed in D. yakuba (toward the bottom) are depleted among genes with high D. melanogaster OSC enhancer activities (shaded in blue). Fold-enrichment values (log2) are depicted in each matrix cell, and cells with enrichments that are not significant (binomial P ≤ 0.05) are set to white (supplementary Fig. 12). (d) A pair of compensatory OSC enhancers in D. melanogaster and D. yakuba stabilizes total enhancer activity, in agreement with similar in vivo gene expression in both species (screenshot as in b). The activities of OSC enhancers in the jumu locus (purple and red shading) change substantially between D. melanogaster and D. yakuba (top), but total OSC enhancer activity for the orthologous loci is balanced (middle), which agrees with similar jumu expression levels in D. melanogaster and D. yakuba follicle cells in vivo (bottom).
Next, we performed RNA-seq on ovarian follicle cells31 isolated from D. melanogaster and D. yakuba adult females (Supplementary Tables 3 and 4). Gene expression levels were very similar in both species (PCC = 0.89), consistent with the high conservation of gene expression reported for fly embryos32 and mammals11.
The CG1620 locus contains a D. melanogaster–specific OSC enhancer gain, which increased the overall enhancer activity of the gene locus in OSCs by 1.6-fold in D. melanogaster compared to D. yakuba, matching the 1.6-fold increase in expression of CG1620 in D. melanogaster compared to D. yakuba follicle cells as measured by RNA-seq (Fig. 6b). Overall, the expression of 38 genes with enhancer activities that were at least 2-fold higher in D. melanogaster was also upregulated by at least 2-fold in D. melanogaster, and the expression of 16 genes was even upregulated by 4-fold or more, significantly more than expected (binomial P = 0.032 and 0.002, respectively). Moreover, differences in OSC enhancer activity and in vivo gene expression levels between D. melanogaster and D. yakuba follicle cells agreed on average across a wide range of cutoffs (Fig. 6c and Supplementary Fig. 12), suggesting that the differences in enhancer activity we observed can more generally cause differences in gene expression between closely related species.
We also observed clear examples of compensatory enhancer evolution around several genes, including jumeau (jumu). In the jumu locus, a D. melanogaster–specific enhancer and a D. yakuba–specific enhancer appeared to compensate for each other to balance the overall enhancer activity of the locus in OSCs (Fig. 6d), in agreement with the gene expression levels for jumu in follicle cells of both species. Overall, 291 of 492 gene loci (59%) with unchanged enhancer activity in OSCs (<1.5-fold difference) showed unchanged gene expression (<1.5-fold difference) in follicle cells (for 401 genes (82%), expression changed by <2.0-fold). Among these gene loci, 21% (61/291) showed compensatory changes, with individual enhancer activities differing by more than 4-fold between the 2 species (Fig. 6c and Supplementary Fig. 12).
These results suggest that the enhancer gains and quantitative differences in enhancer activity we observed using STARR-seq can underlie differences in gene expression between species in vivo. They also emphasize the relevance of compensatory enhancer evolution for the stabilization of gene expression levels that we and others11,32 find to be highly conserved.
DISCUSSION
We assessed the extent of functional enhancer conservation across an entire animal genome, identifying frequent and deep functional conservation. Enhancer strength evolves according to a molecular clock, with quantitative changes linearly related to sequence divergence (Supplementary Fig. 13) but with largely overlapping distributions of sequence identity for functionally conserved or divergent enhancers, as estimated across the genome (Supplementary Fig. 14).
To our surprise, even within only 10 million years of evolution, hundreds of non-functional sequences appeared to have acquired enhancer activity. This de novo emergence of function can be attributed solely to cis-regulatory mutations, as we assayed all enhancer activities in the constant trans-regulatory environment of individual cell types. This situation might resemble the initial step of regulatory evolution, before cellular trans-regulatory environments change more globally16.
Interestingly, the frequencies of sequence changes between gained enhancers and non-functional sequences were similar to those at fourfold-degenerate sites14 (Fig. 4e and Supplementary Figs. 8 and 11f,g), which are often used to estimate mutation frequencies for neutrally evolving sequences14,15 (also note, however, ref. 33). Even though individual transcription factor binding sites could be under selection that is not apparent when comparing longer sequences, it is interesting to speculate that neutrally evolving sequences might frequently gain enhancer activity, a hypothesis consistent with the observation that even random DNA sequences can be active in enhancer assays34. As such gains can influence gene expression (Fig. 6), our combined results suggest how randomly occurring sequence changes might create variability in gene expression and potentially phenotype, which in turn might be selected for during evolution and ultimately lead to differences between species1.
The high frequency of enhancer gains in single cell types and their near additivity across the two cell types studied (Supplementary Fig. 15) suggest that, across the many cell types of an animal, hundreds to thousands of enhancer activities might arise within short evolutionary timespans. These numbers estimated in insect genomes are likely substantially higher in the much larger mammalian genomes. With their ability to alter gene expression and potentially influence cellular functions and phenotypes even in closely related species, cis-regulatory mutations and changes in enhancer activities should be powerful drivers of evolution1.
METHODS
Methods and any associated references are available in the online version of the paper.
ONLINE METHODS
STARR-seq screens
STARR-seq was performed in two biological replicates (independent transfections) per species as described previously13, with the following exceptions. (i) Input DNA for library cloning for the respective species-specific screens was the genomic DNA of D. yakuba, D. ananassae, D. pseudoobscura and D. willistoni, which we obtained from the Drosophila Species Stock Center (DSSC) at the University of California, San Diego (for D. melanogaster, we used the data from ref. 13). (ii) We transfected 1.6 × 10⁹ S2 cells and OSCs per biological replicate. (iii) First-strand cDNA synthesis was performed in 30–60 reactions with the STARR-seq RT primer (Supplementary Table 5). (iv) Illumina sequencing was performed on an Illumina HiSeq 2000 machine using multiplexing according to the manufacturer’s instructions. The STARR-seq library cloning construct is available subject to a Material Transfer Agreement (MTA).
Luciferase reporter assays
Luciferase assays were conducted as described previously13, and constructs are available subject to an MTA.
Hybrid enhancer constructs for luciferase reporter assays
We selected three pairs of orthologous enhancers from D. melanogaster and D. yakuba, D. ananassae or D. pseudoobscura that had comparable pairwise enhancer activities and a central stretch of identical sequence (IDS) that allowed a seamless transition from the sequence of one species (first half of the hybrid) to the sequence for the other species (second half of the hybrid). For each such pair, we cloned the two orthologous wild-type sequences and two complementary hybrid constructs of the forms half 1 (species 1)–IDS–half 2 (species 2) and half 1 (species 2)–IDS–half 2 (species 1), also illustrated in Figure 4c–e. Fusion of the two halves was carried out by Gibson assembly35, using NEB Gibson Assembly Master Mix (E2611S) according to the manufacturer’s instructions. Each of the halves was amplified by PCR (incubation at 98 °C for 45 s followed by 35 cycles of 98 °C for 15 s, 65 °C for 30 s and 72 °C for 30 s) with 50 ng of genomic DNA for the respective species as template, using KAPA Hifi Hot-Start Ready Mix (KAPA Biosystems, KK2602). The homology arms needed for Gibson assembly were introduced by PCR with appropriate PCR primers (Supplementary Table 5): to each half 1, a 20-nt extension homologous to the 5′ end of half 2 of the orthologous enhancer was added at the 3′ end, and, to each half 2, a 20-nt extension homologous to the 3′ end of half 1 of the orthologous enhancer was added at the 5′ end. Wild-type sequences were PCR amplified using the forward primer for half 1 and the reverse primer for half 2 from the same species as described above, with the exception that a longer elongation time was used (72 °C for 60 s). Luciferase vector construction for hybrid and wild-type PCR products was carried out as described previously13.
RNA-seq from enriched Drosophila follicle cells
Samples highly enriched in follicle cells from D. melanogaster (OregonR) and D. yakuba (WT Liberia; obtained from DSSC) were prepared as described previously31. Fly strains were maintained under standard fly culture procedures, but D. yakuba were given a moist substrate in bottles to facilitate pupation. PolyA-selected mRNA was subjected to a custom mRNA-seq library construction method as described in ref. 36 and sequenced on an Illumina HiSeq 2000 machine as 50-bp single-end reads.
STARR-seq read mapping
Paired-end STARR-seq and input reads from all STARR-seq screens for the Drosophila species (D. yakuba, D. ananassae, D. pseudoobscura and D. willistoni) were trimmed to 36 bp and mapped to the respective genome assembly (droYak2, droAna3, dp4 and droWil1) using Bowtie37 0.12.9 as in ref. 13. Paired-end STARR-seq and input reads for D. melanogaster were obtained from our previous screens13 and processed the same way. As the trimmed forward and reverse reads correspond to the 5′ and 3′ ends of the respective DNA fragments, their respective genomic locations indicate the identity and length of each fragment (about 500 bp on average). We collapsed the mapped paired-end data into unique fragments (on the basis of identical chromosome, start, end and strand information) to remove biases from PCR duplicates as before13. We additionally introduced a heuristic approach (redundancy filter) to remove clustered paired-end reads that manual inspection showed were due to sequence artifacts such as homopolymer runs. For this approach, we grouped paired-end reads that had identical start positions for the forward read into clusters. For each of these clusters, we retained the longest paired-end read and discarded paired-end reads within the same cluster for which the reverse reads had ≤2 sequence differences within read positions 2–11. We then repeated the same filtering for groups defined on the basis of identical end positions for the reverse read.
Translating fragment coordinates to the dm3 assembly
To have all data in common reference genome coordinates, the genomic coordinates for all fragments obtained from mapping the paired-end data to the genomes of the respective species (paired-end sequencing allows the determination of identity and length for each fragment) were translated into dm3 coordinates using the UCSC liftOver tool38. Only fragments that were uniquely liftable to dm3 and that had a final lifted length of 10–200% of the original fragment length were considered for further analysis. Depending on the species and deep sequencing library, between 70 and 93% of all fragments could be lifted to dm3 (Supplementary Table 1).
Density profiles of translated fragments
Density profiles of fragments translated to the dm3 assembly were computed with the BEDTools suite39. All profiles were normalized to 1 million mapped fragments (FPM, fragments per million).
Enhancer peak calling and false discovery rate
We called peaks from the STARR-seq data as before13 with the following cutoff settings: P ≤ 0.001 and ≥3-fold enrichment over input. FDRs for STARR-seq peaks were computed as in ref. 13.
Assignment of enhancer peaks to genes
By default, peaks were uniquely assigned to the gene with the closest TSS to the peak summit. For gene-centric analyses (for example, compensatory peak changes), we assigned all peaks to extended gene loci. We defined gene loci as regions between 15 kb upstream of annotated genes to at most 5 kb downstream but not across neighboring genes. Two genes could share the same intergenic region, but overlapping genes and genes that were fully contained within another gene were excluded. All peaks that were located within these unique gene loci were assigned to the respective genes. Peaks that were assigned to two different genes (for example, overlapping intergenic regions) were reassigned to the gene with the closest TSS, resulting in unique peak-to-gene-locus assignment.
Genomic distributions of enhancers
Enhancer summit positions for peak calls in each of the five species were intersected with a set of uniquely assigned genomic regions (for example, coding sequences and introns) on the basis of D. melanogaster genome annotation from FlyBase r5.31 (ref. 40). Both the fraction of enhancer summits distributed over the genomic regions and enrichment or depletion over the expectation based on region size were computed.
Heat maps of enhancer enrichment
Heat maps were based on normalized read density profiles from the STARR-seq screen for each of the five species and were centered on enhancer summit positions. As exact positions could vary for conserved enhancers in the different species, the summit position in the first species along with the phylogenic tree starting with D. melanogaster was kept.
Conservation rates of enhancers across replicates and species
Conservation rates of enhancers (STARR-seq peaks)—either between replicates or species—were computed by evaluating STARR-seq enrichments at summit positions (independent of the fixed lengths of the delineated enhancers). We called enhancers in a first set ‘conserved’ in a second set if STARR-seq enrichment in the second set was significant with hypergeometric P ≤ 0.001 (or P ≤ 0.05 for relaxed settings, as indicated in the text and figure legends). Conservation rates within one species were based on two biological replicates and evaluated replicate 1 versus replicate 2 and vice versa. The rates of conserved peaks with regard to D. melanogaster peaks were based on the combined D. melanogaster replicates evaluated separately against replicate 1 and 2 in each Drosophila species. As controls, we randomly distributed D. melanogaster replicate 1 peaks across the genome (shifted their coordinates to random genomic positions) while preserving the overall peak number in each of the different genomic regions (for example, introns and intergenic regions). We then assessed conservation against the original D. melanogaster replicate 1 peaks with the protocol above and the same respective P-value cutoffs (0.001 and 0.05). We repeated the same procedure for the D. melanogaster replicate 2 peaks. We also assessed all conservation rates for open and closed D. melanogaster enhancers in S2 cells and OSCs separately, using the definition of open versus closed enhancers from ref. 13.
Alignments of enhancer regions
Alignments of all enhancer sequences in the five species were extracted from Multiz 15-way insect alignments obtained from UCSC14,15,41. Some analysis required a stringent set of well-aligned sequences. For such analysis, we considered only regions for which the alignments had no undefined nucleotides (Ns) and had orthologous non-gapped 5′ and 3′ ends.
Motif analysis and compensatory motif changes
We extracted alignments of enhancer regions and used a position weight matrix (PWM) for the transcription factors Srp42 and Btd43 to scan for occurrences within each of the sequences independently using MAST44. We used a PWM matching cutoff of 4−5 = 9.8 × 10⁻⁴. Coordinates of Srp matches within individual sequences of the alignment were translated into alignment coordinates to differentiate between positionally conserved and compensatory motifs. To test for transcription factor motifs that showed preferential conservation in functionally conserved enhancers, we assessed the fraction of motif matches that were conserved at orthologous genomic positions across all five species (according to UCSC whole-genome alignments) in functionally fully conserved enhancers versus D. melanogaster–specific enhancers for all Drosophila transcription factor motifs from ref. 45. For each transcription factor motif, we calculated the increased conservation rate (fold difference corrected to the 95% confidence interval) and binomial P values, which we converted to FDRs to correct for multiple testing. Control motifs were generated by shuffling the columns (motif positions) for the motif PWMs. We also counted the fraction of motifs that showed significant preferential conservation in functionally conserved enhancers (P ≤ 0.01) for transcription factors that are expressed in S2 cells (RPKM ≥ 1) and transcription factors that are not expressed in S2 cells and for the respective shuffled control motifs.
Sequence conservation of enhancers and motifs
To estimate pairwise sequence identity between orthologous STARR-seq enhancers, pairwise alignments of the D. melanogaster enhancer sequence with the sequence for the other species were extracted from a whole-genome multispecies alignment obtained from UCSC. Conservation was computed as the fraction of identical nucleotides over the length of the D. melanogaster enhancer sequence or only over Srp and Btd motif matches within the enhancer sequence.
Compensatory enhancer changes
To compute positional and compensatory enhancer conservation, unique gene loci were defined and the number of all enhancers falling into these regions was determined in each of the five species independently. Each D. melanogaster enhancer (≥3-fold enrichment and P < 0.001) was then uniquely assigned to a single enhancer for a Drosophila species (P < 0.001) in a 1:1 manner to prevent double counting. Afterward, enhancers were classified as positionally conserved if the distance to the peak summit was less than 250 bp. Enhancers that overlapped the same gene locus but that were not positionally conserved were defined as showing compensatory conservation.
Motif similarity of compensatory enhancers
For D. melanogaster and each of the other species in turn, we identified putatively compensatory enhancer pairs as two enhancers assigned to the same gene, one of which was found only in D. melanogaster and the other of which was found only in the other species (D. yakuba, D. ananassae, D. pseudoobscura or D. willistoni). We further selected active enhancers with aligned orthologous (yet inactive according to STARR-seq) sequences that allowed unique read mapping by requiring that they had 100% input coverage. This excluded alternative explanations such as alignment gaps or errors and ensured that the orthologously aligned sequence was present yet inactive, presumably owing to specific sequence changes. For D. melanogaster and each of the other species in turn, we then computed motif enrichment vectors for each pair of active sequences and the corresponding orthologous inactive sequences, using the transcription factor motifs that were informative for S2 enhancers (enriched at P ≤ 0.05), and compared the concatenated vectors by PCC.
Non-redundant enhancer loci
Enhancer loci for all five species were combined to create a set of non-overlapping (non-redundant) enhancer loci. First, we called enhancers in each species as regions with significantly enriched STARR-seq signal (P ≤ 0.001). We then intersected the enhancer loci for all species and kept only loci that had a strong enhancer (P ≤ 0.001 and ≥3-fold enrichment) in at least one species. As summit positions for these non-redundant enhancers, we used the summit of each isolated peak and the summit of the peak in the species closest to D. melanogaster for each group of mutually overlapping peaks. We then assessed STARR-seq enrichment at these non-redundant peak summit positions or, for overlapping peaks, at the peak summit position in the respective species. This approach allowed a balancing out of variation in the positions of maximal enhancer enrichment.
Enhancer gains and losses
Using the combined data set of non-redundant enhancer loci, putative gain and loss events were mapped to the phylogenetic tree (Supplementary Fig. 7). Enhancers that were exclusively found in only one species were classified as confident gain events (Fig. 5c and Supplementary Fig. 7). For analysis only, D. melanogaster or D. yakuba were taken into account. Confident loss events, as shown in Figure 5c, required the enhancer to be conserved in four of five species (either not in D. melanogaster or D. yakuba).
Follicle cell RNA-seq data analysis
We mapped the RNA-seq reads for D. melanogaster and D. yakuba follicle cells to respective genomic sequences using Bowtie and translated the droYak2 genomic coordinates into dm3 coordinates so that the analysis could benefit from the quality of the D. melanogaster genome annotations. To assess gene expression for both species, we intersected read coordinates with the coordinates of FlyBase gene models (FlyBase version FB2010_08 (dmel_r5.31)) and calculated D. melanogaster and D. yakuba RPKM values for each gene from the gene’s combined exon length, the number of reads mapping to these exons and the total number of reads per species.
Correlation between enhancer activity and gene expression
We assigned the OSC enhancers to unique, non-overlapping gene loci and computed the sum of enhancer activities (STARR-seq enrichments) for each gene locus for each gene in D. melanogaster and D. yakuba. We then compared the changes in enhancer activity between D. melanogaster and D. yakuba with the changes in the RPKM expression values in D. melanogaster and D. yakuba follicle cells for genes that had an enhancer in at least one of the species, were expressed in at least one of the species (not necessarily the same species; i.e., these two filters were applied independently to avoid an ascertainment bias) and were expressed in OSCs. We then counted the number of genes with different changes in enhancer activity and gene expression between D. melanogaster and D. yakuba at cutoffs between ≥1.5-fold and ≥4-fold. We finally assessed the relative enrichment (fold enrichment and binomial P value) of genes in each enhancer activity and gene expression category by comparing genes with higher expression in D. melanogaster to those with higher expression in D. yakuba at each cutoff.
Gene expression levels in S2 cells and OSCs
We used the gene expression levels in D. melanogaster S2 cells and OSCs determined by RNA-seq in ref. 13.
Computations on genomic features and coordinate intersection
All computational analysis and intersections of genomic features or coordinates were performed with the BEDTools suite39.
Statistics
All statistical analyses were performed using R46.
Supplementary Material
Acknowledgments
We thank the Drosophila Species Stock Center (DSSC) at the University of California, San Diego for genomic DNA, I. Sinitsyn and Ł.M. Boryń for help with library cloning, M. Rath, K. Schernhuber and O. Frank for help with experiments, J.O. Yáñez-Cuna and M.A. Zabidi for help with data analysis, and S. Westermann, L. Cochella, I. Crisostomo, J. Brennecke, J. Knoblich, U. Technau, K. Tessmar-Raible and F. Raible for comments on the manuscript. Deep sequencing was performed at the CSF (Campus Science Support Facilities) Next-Generation Sequencing Unit and the Brandeis Genomics Core Facility (laboratory of M. Rosbash). C.D.A. is supported by a European Research Council (ERC) Starting Grant (242922) awarded to A.S. This work was partly supported by the Austrian Science Fund (FWF), F4303-B09. The work of N.C.L. was supported by the Searle Scholars foundation and the US National Institutes of Health (HD057298). Basic research at IMP is supported by Boehringer Ingelheim.
Footnotes
URLs. Study data are available at http://stark.imp.ac.at/data/arnold_gerlach_nature_genetics_2014/.
Accession codes. All deep sequencing data reported are available at http://www.starklab.org/ and have been deposited in the Gene Expression Omnibus (GEO) database under accessions GSE40739 and GSE48251.
Note: Any Supplementary Information and Source Data files are available in the online version of the paper.
AUTHOR CONTRIBUTIONS
C.D.A. and A.S. conceived the project. C.D.A., D.S. and M.P. performed the experiments. J.A.M., Y.A.S. and N.C.L. generated the follicle cell RNA-seq data. D.G. and A.S. conducted all computational experiments and bioinformatics analyses. C.D.A., D.G. and A.S. wrote the manuscript.
COMPETING FINANCIAL INTERESTS
The authors declare no competing financial interests.
Reprints and permissions information is available online at http://www.nature.com/reprints/index.html.
References
- 1.Carroll SB. Evo-devo and an expanding evolutionary synthesis: a genetic theory of morphological evolution. Cell. 2008;134:25–36. doi: 10.1016/j.cell.2008.06.030. [DOI] [PubMed] [Google Scholar]
- 2.King MC, Wilson AC. Evolution at two levels in humans and chimpanzees. Science. 1975;188:107–116. doi: 10.1126/science.1090005. [DOI] [PubMed] [Google Scholar]
- 3.Wittkopp PJ, Kalay G. Cis-regulatory elements: molecular mechanisms and evolutionary processes underlying divergence. Nat Rev Genet. 2012;13:59–69. doi: 10.1038/nrg3095. [DOI] [PubMed] [Google Scholar]
- 4.Wray GA. The evolutionary significance of cis-regulatory mutations. Nat Rev Genet. 2007;8:206–216. doi: 10.1038/nrg2063. [DOI] [PubMed] [Google Scholar]
- 5.Gompel N, Prud’homme B, Wittkopp PJ, Kassner VA, Carroll SB. Chance caught on the wing: cis-regulatory evolution and the origin of pigment patterns in Drosophila. Nature. 2005;433:481–487. doi: 10.1038/nature03235. [DOI] [PubMed] [Google Scholar]
- 6.Prud’homme B, et al. Repeated morphological evolution through cis-regulatory changes in a pleiotropic gene. Nature. 2006;440:1050–1053. doi: 10.1038/nature04597. [DOI] [PubMed] [Google Scholar]
- 7.Frankel N, et al. Morphological evolution caused by many subtle-effect substitutions in regulatory DNA. Nature. 2011;474:598–603. doi: 10.1038/nature10200. [DOI] [PMC free article] [PubMed] [Google Scholar]
- 8.Prabhakar S, et al. Human-specific gain of function in a developmental enhancer. Science. 2008;321:1346–1350. doi: 10.1126/science.1159974. [DOI] [PMC free article] [PubMed] [Google Scholar]
- 9.Borneman AR, et al. Divergence of transcription factor binding sites across related yeast species. Science. 2007;317:815–819. doi: 10.1126/science.1140748. [DOI] [PubMed] [Google Scholar]
- 10.He Q, et al. High conservation of transcription factor binding and evidence for combinatorial regulation across six Drosophila species. Nat Genet. 2011;43:414–420. doi: 10.1038/ng.808. [DOI] [PubMed] [Google Scholar]
- 11.Odom DT, et al. Tissue-specific transcriptional regulation has diverged significantly between human and mouse. Nat Genet. 2007;39:730–732. doi: 10.1038/ng2047. [DOI] [PMC free article] [PubMed] [Google Scholar]
- 12.Schmidt D, et al. Five-vertebrate ChIP-seq reveals the evolutionary dynamics of transcription factor binding. Science. 2010;328:1036–1040. doi: 10.1126/science.1186176. [DOI] [PMC free article] [PubMed] [Google Scholar]
- 13.Arnold CD, et al. Genome-wide quantitative enhancer activity maps identified by STARR-seq. Science. 2013;339:1074–1077. doi: 10.1126/science.1232542. [DOI] [PubMed] [Google Scholar]
- 14.Stark A, et al. Discovery of functional elements in 12 Drosophila genomes using evolutionary signatures. Nature. 2007;450:219–232. doi: 10.1038/nature06340. [DOI] [PMC free article] [PubMed] [Google Scholar]
- 15.Drosophila 12 Genomes Consortium. Evolution of genes and genomes on the Drosophila phylogeny. Nature. 2007;450:203–218. doi: 10.1038/nature06341. [DOI] [PubMed] [Google Scholar]
- 16.Arendt D. The evolution of cell types in animals: emerging principles from molecular studies. Nat Rev Genet. 2008;9:868–882. doi: 10.1038/nrg2416. [DOI] [PubMed] [Google Scholar]
- 17.Wittkopp PJ, Haerum BK, Clark AG. Evolutionary changes in cis and trans gene regulation. Nature. 2004;430:85–88. doi: 10.1038/nature02698. [DOI] [PubMed] [Google Scholar]
- 18.Wilson MD, et al. Species-specific transcription in mice carrying human chromosome 21. Science. 2008;322:434–438. doi: 10.1126/science.1160930. [DOI] [PMC free article] [PubMed] [Google Scholar]
- 19.Hare EE, Peterson BK, Iyer VN, Meier R, Eisen MB. Sepsid even-skipped enhancers are functionally conserved in Drosophila despite lack of sequence conservation. PLoS Genet. 2008;4:e1000106. doi: 10.1371/journal.pgen.1000106. [DOI] [PMC free article] [PubMed] [Google Scholar]
- 20.Fisher S, Grice EA, Vinton RM, Bessling SL, McCallion AS. Conservation of RET regulatory function from human to zebrafish without sequence similarity. Science. 2006;312:276–279. doi: 10.1126/science.1124070. [DOI] [PubMed] [Google Scholar]
- 21.Ludwig MZ, Bergman C, Patel NH, Kreitman M. Evidence for stabilizing selection in a eukaryotic enhancer element. Nature. 2000;403:564–567. doi: 10.1038/35000615. [DOI] [PubMed] [Google Scholar]
- 22.Bardet AF, He Q, Zeitlinger J, Stark A. A computational pipeline for comparative ChIP-seq analyses. Nat Protoc. 2012;7:45–61. doi: 10.1038/nprot.2011.420. [DOI] [PubMed] [Google Scholar]
- 23.Ho MCW, et al. Functional evolution of cis-regulatory modules at a homeotic gene in Drosophila. PLoS Genet. 2009;5:e1000709. doi: 10.1371/journal.pgen.1000709. [DOI] [PMC free article] [PubMed] [Google Scholar]
- 24.Ludwig MZ, et al. Functional evolution of a cis-regulatory module. PLoS Biol. 2005;3:e93. doi: 10.1371/journal.pbio.0030093. [DOI] [PMC free article] [PubMed] [Google Scholar]
- 25.Kalay G, Wittkopp PJ. Nomadic enhancers: tissue-specific cis-regulatory elements of yellow have divergent genomic positions among Drosophila species. PLoS Genet. 2010;6:e1001222. doi: 10.1371/journal.pgen.1001222. [DOI] [PMC free article] [PubMed] [Google Scholar]
- 26.Rämet M, Manfruelli P, Pearson A, Mathey-Prevot B, Ezekowitz RAB. Functional genomic analysis of phagocytosis and identification of a Drosophila receptor for E. coli Nature. 2002;416:644–648. doi: 10.1038/nature735. [DOI] [PubMed] [Google Scholar]
- 27.Moses AM, et al. Large-scale turnover of functional transcription factor binding sites in Drosophila. PLoS Comput Biol. 2006;2:e130. doi: 10.1371/journal.pcbi.0020130. [DOI] [PMC free article] [PubMed] [Google Scholar]
- 28.Swanson CI, Schwimmer DB, Barolo S. Rapid evolutionary rewiring of a structurally constrained eye enhancer. Curr Biol. 2011;21:1186–1196. doi: 10.1016/j.cub.2011.05.056. [DOI] [PMC free article] [PubMed] [Google Scholar]
- 29.Crocker J, Tamori Y, Erives A. Evolution acts on enhancer organization to fine-tune gradient threshold readouts. PLoS Biol. 2008;6:e263. doi: 10.1371/journal.pbio.0060263. [DOI] [PMC free article] [PubMed] [Google Scholar]
- 30.Saito K, et al. A regulatory circuit for piwi by the large Maf gene traffic jam in Drosophila. Nature. 2009;461:1296–1299. doi: 10.1038/nature08501. [DOI] [PubMed] [Google Scholar]
- 31.Matts JA, Sytnikova Y, Chirn GW, Igloi GL, Lau NC. Small RNA library construction from minute biological samples. Methods Mol Biol. 2014;1093:123–136. doi: 10.1007/978-1-62703-694-8_10. [DOI] [PMC free article] [PubMed] [Google Scholar]
- 32.Paris M, et al. Extensive divergence of transcription factor binding in Drosophila embryos with highly conserved gene expression. PLoS Genet. 2013;9:e1003748. doi: 10.1371/journal.pgen.1003748. [DOI] [PMC free article] [PubMed] [Google Scholar]
- 33.Lawrie DS, Messer PW, Hershberg R, Petrov DA. Strong purifying selection at synonymous sites in D. melanogaster PLoS Genet. 2013;9:e1003527. doi: 10.1371/journal.pgen.1003527. [DOI] [PMC free article] [PubMed] [Google Scholar]
- 34.White MA, Myers CA, Corbo JC, Cohen BA. Massively parallel in vivo enhancer assay reveals that highly local features determine the cis-regulatory function of ChIP-seq peaks. Proc Natl Acad Sci USA. 2013;110:11952–11957. doi: 10.1073/pnas.1307449110. [DOI] [PMC free article] [PubMed] [Google Scholar]
- 35.Gibson DG, et al. Enzymatic assembly of DNA molecules up to several hundred kilobases. Nat Methods. 2009;6:343–345. doi: 10.1038/nmeth.1318. [DOI] [PubMed] [Google Scholar]
- 36.Pennington KL, Marr SK, Chirn GW, Marr MT. Holo-TFIID controls the magnitude of a transcription burst and fine-tuning of transcription. Proc Natl Acad Sci USA. 2013;110:7678–7683. doi: 10.1073/pnas.1221712110. [DOI] [PMC free article] [PubMed] [Google Scholar]
- 37.Langmead B, Trapnell C, Pop M, Salzberg SL. Ultrafast and memory-efficient alignment of short DNA sequences to the human genome. Genome Biol. 2009;10:R25. doi: 10.1186/gb-2009-10-3-r25. [DOI] [PMC free article] [PubMed] [Google Scholar]
- 38.Hinrichs AS, et al. The UCSC Genome Browser Database: update 2006. Nucleic Acids Res. 2006;34:D590–D598. doi: 10.1093/nar/gkj144. [DOI] [PMC free article] [PubMed] [Google Scholar]
- 39.Quinlan AR, Hall IM. BEDTools: a flexible suite of utilities for comparing genomic features. Bioinformatics. 2010;26:841–842. doi: 10.1093/bioinformatics/btq033. [DOI] [PMC free article] [PubMed] [Google Scholar]
- 40.McQuilton P, St Pierre SE, Thurmond J, FlyBase Consortium FlyBase 101–the basics of navigating FlyBase. Nucleic Acids Res. 2012;40:D706–D714. doi: 10.1093/nar/gkr1030. [DOI] [PMC free article] [PubMed] [Google Scholar]
- 41.Meyer LR, et al. The UCSC Genome Browser database: extensions and updates 2013. Nucleic Acids Res. 2013;41:D64–D69. doi: 10.1093/nar/gks1048. [DOI] [PMC free article] [PubMed] [Google Scholar]
- 42.Down TA, Bergman CM, Su J, Hubbard TJP. Large-scale discovery of promoter motifs in Drosophila melanogaster. PLoS Comput Biol. 2007;3:e7. doi: 10.1371/journal.pcbi.0030007. [DOI] [PMC free article] [PubMed] [Google Scholar]
- 43.Bryne JC, et al. JASPAR, the open access database of transcription factor–binding profiles: new content and tools in the 2008 update. Nucleic Acids Res. 2008;36:D102–D106. doi: 10.1093/nar/gkm955. [DOI] [PMC free article] [PubMed] [Google Scholar]
- 44.Bailey TL, Gribskov M. Combining evidence using p-values: application to sequence homology searches. Bioinformatics. 1998;14:48–54. doi: 10.1093/bioinformatics/14.1.48. [DOI] [PubMed] [Google Scholar]
- 45.Yáñez-Cuna JO, Dinh HQ, Kvon EZ, Shlyueva D, Stark A. Uncovering cis-regulatory sequence requirements for context-specific transcription factor binding. Genome Res. 2012;22:2018–2030. doi: 10.1101/gr.132811.111. [DOI] [PMC free article] [PubMed] [Google Scholar]
- 46.R Development Core Team. R: A Language and Environment for Statistical Computing. R Foundation for Statistical Computing; Vienna: 2010. [Google Scholar]
Associated Data
This section collects any data citations, data availability statements, or supplementary materials included in this article.