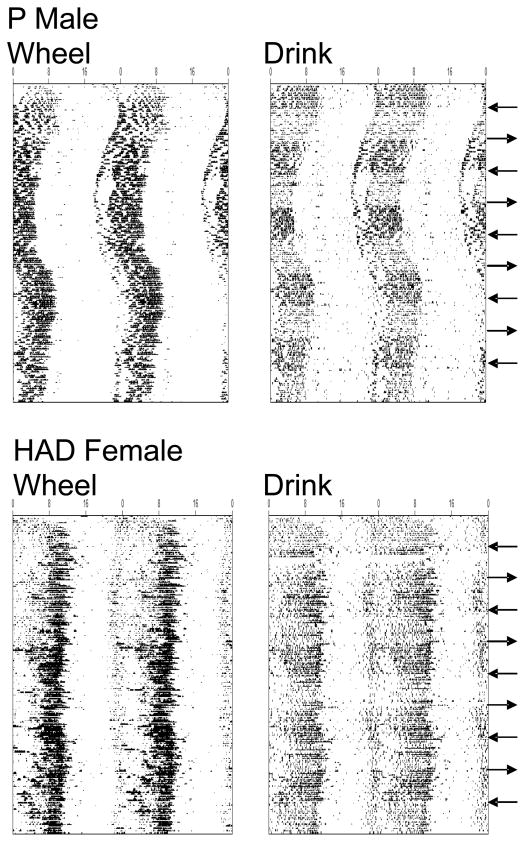
Figure 1.
Representative raster-style circadian actograms displaying wheel-running (“Wheel”, left) and licking (“Drink”, right) patterns for one male P rat (top) and one female HAD rat (bottom). Both animals were maintained under intermittent ethanol access, and arrows located along the right-hand y-axis indicate the beginning (leftward-pointing) or end (rightward-pointing) of 15-day ethanol access periods. Records are double-plotted on a 48-h time base (x-axis) and consecutive days are represented from top to bottom along the y-axis. A symbol is plotted for every 10-min time bin, with symbol height proportionate to the amount of running or licking occurring in that bin.

