

Abstract
Acetaminophen (APAP)-induced acute liver failure (ALF) remains a major clinical problem. Although a majority of patients recovers after severe liver injury, a subpopulation of patients proceeds to ALF. Bile acids are generated in the liver and accumulate in blood during liver injury, and as such, have been proposed as biomarkers for liver injury and dysfunction. The goal of this study was to determine whether individual bile acid levels could determine outcome in patients with APAP-induced ALF (AALF). Serum bile acid levels were measured in AALF patients using mass spectrometry. Bile acid levels were elevated 5–80-fold above control values in injured patients on day 1 after the overdose and decreased over the course of hospital stay. Interestingly, glycodeoxycholic acid (GDCA) was significantly increased in non-surviving AALF patients compared with survivors. GDCA values obtained at peak alanine aminotransferase (ALT) and from day 1 of admission indicated GDCA could predict survival in these patients by receiver-operating characteristic analysis (AUC = 0.70 for day 1, AUC = 0.68 for peak ALT). Of note, AALF patients also had significantly higher levels of serum bile acids than patients with active cholestatic liver injury. These data suggest measurements of GDCA in this patient cohort modestly predicted outcome and may serve as a prognostic biomarker. Furthermore, accumulation of bile acids in serum or plasma may be a result of liver cell dysfunction and not cholestasis, suggesting elevation of circulating bile acid levels may be a consequence and not a cause of liver injury.
Keywords: acetaminophen, bile acid, serum biomarker, cholestasis, acute liver failure, hepatotoxicity
Acetaminophen (APAP)-induced acute liver failure (AALF) is a major cause of morbidity in Western countries (Lee, 2012). Accurate prediction of the course and outcome of injury in AALF is an important clinical challenge. Previous work from our laboratory and others has confirmed serum biomarkers such as HMGB1, cytokeratin 18, mitochondrial DNA, nuclear DNA fragments, and glutamate dehydrogenase can serve as both mechanistic (Antoine et al., 2012; McGill et al., 2012, 2014a) and prognostic biomarkers (Antoine et al., 2012, 2013; McGill et al., 2014b; Schomaker et al., 2013) that can accurately predict the course of injury. Advanced metrics such as the King’s College Criteria (Rutherford et al., 2012) and the model for end-stage liver disease (MELD) score (Schmidt and Larsen, 2007) are currently used to assess potential outcome; however, novel biomarkers have been proposed that might enhance the accuracy and speed of the determination of the course of injury (Antoine et al., 2012, 2013; McGill et al., 2014a; McGill and Jaeschke, 2014; Rutherford et al., 2012; Weerasinghe et al., 2014).
A number of mechanisms behind APAP-induced liver injury in rodents have been elucidated. Activation of APAP to the electrophile N-acetyl-p-benzoquinone imine by cytochrome P450s results in protein binding, mitochondrial dysfunction, and oxidative stress (Jaeschke et al., 2012) which results in RIP1- and RIP3-dependent programmed necrosis (Ramachandran et al., 2013, Zhang et al., 2014). Due to cellular rupture during necrosis, numerous cellular products are released that can be detected in serum of mice with active liver injury (Antoine et al., 2012; McGill et al., 2012). Some of the products termed damage associated molecular patterns have been proposed as novel serum biomarkers that can provide information about the mechanisms of injury in human patients. For APAP-induced liver injury, a number of the same events that occur in mice have been confirmed in man, including release of HMGB1, mitochondrial DNA, and glutamate dehydrogenase (Antoine et al., 2012; McGill et al., 2012, 2014b). In addition to the release of cellular products by the liver, AALF results in multiorgan dysfunction and the accumulation of byproducts of this dysfunction. Many of these byproducts, such as elevations in serum creatinine, are components of essential prognostic scores in current use, such as the MELD score (Schmidt and Larsen, 2007).
Bile acids are critical mediators of metabolism and dietary fat intake that are synthesized in the liver (Chiang, 2013). Although there are numerous bile acid species present in mammals, the most abundant in mice and man are the primary bile acids, cholic acid (CA) and chenodeoxycholic acid (CDCA), and their amino acid conjugate species (Trottier et al., 2011, 2012). In addition, gut bacteria carry out mono-dehydroxylation reactions that result in accumulation of deoxycholic acid (DCA) from CA. Although a majority of bile acids have a similar structure, liquid chromatography coupled to mass spectrometry (LC-MS) has provided a validated method to analyze individual bile acids in serum and liver (Alnouti et al., 2008; Zhang et al., 2012) or bile (Alnouti et al., 2008). Under conditions of cholestasis (Trottier et al., 2011; Woolbright et al., 2014b; Zhang et al., 2012), or under conditions of massive liver injury (Péan et al., 2013) bile acids accumulate in the serum due to perturbations in enterohepatic flow. In mice and rats given toxic doses of APAP, total and specific serum bile acid levels increase (Luo et al., 2014; Yamazaki et al., 2013). Although “total” serum bile acid levels typically increase to similar degrees, altered concentrations of “specific, individual” bile acids present in serum after liver injury could serve as predictors of the course of drug- induced liver injury (Luo et al., 2014; Yamazaki et al., 2013).
The goal of this study was to measure individual bile acid levels in the serum of ALF patients and to determine whether any differences were present that would allow for the prediction of progression of injury. Herein, we confirm that not only are total and individual bile acid levels substantially elevated in APAP-induced ALF patients, but there is preferential accumulation of glycodeoxycholic acid (GDCA) in non-surviving patients. Furthermore, we demonstrate that total and individual serum bile acid levels accumulate to a greater degree in ALF patients than in patients with cholestatic liver injury (CLI), indicating bile acid accumulation is not a function of cholestasis, but rather liver dysfunction.
MATERIALS AND METHODS
APAP-induced acute liver injury patients
Patient samples and data for all studies were acquired under informed consent and approved by Institutional Review Boards (IRBs) and adhere to the 1975 Declaration of Helsinki. To assess the time courses of circulating bile acid concentrations after APAP overdose, plasma samples were obtained from APAP overdose patients at the University of Kansas Hospital in Kansas City, Kansas and the Banner Good Samaritan Medical Center in Phoenix, Arizona (Table 1). The diagnosis of APAP overdose was made by a physician based on standard clinical criteria (reported history of APAP overdose, detectable serum APAP, and/or aminotransferase level of ≥1500 IU/l). Patients were excluded from the study if they had evidence of liver injury from some other causes, eg, viral hepatitis. Blood samples were collected in heparinized tubes at the time of study admission and every 24 h thereafter until patient death or discharge. The whole blood was centrifuged (1000 g, 10 min) to obtain plasma and aliquots were stored at −80°C for later analysis. Samples were also collected from healthy volunteers at the University of Kansas Medical Center. Volunteers were recruited as control patients over a number of days and at different time points during the course of the study. Informed written consent was obtained from each patient or next of kin. Time from admission to hospital to first drawn blood sample was generally less than 1 day for this patient population.
TABLE 1.
Volunteers and Acetaminophen Overdose Patients
| Vol | AALI Patients |
AALF Patients |
|||
|---|---|---|---|---|---|
| Norm LT | Abnorm LT | S | NS | ||
| N | 6 | 9 | 13 | 31 | 31 |
| Age (median, range) | 33, 23–51 | 26, 18–56 | 33, 19–48 | 34, 18–61 | 33, 21–80 |
| Sex (% female) | 66 | 60 | 85 | 81 | 74 |
| Peak ALT (U/l) (mean ± SE) | 25 ± 3 | 46 ± 9 | 4973 ± 838 | 4838 ± 708 | 5720 ± 753 |
| Peak bilia (mg/dl) (mean ± SE) | — | 1.0 ± 0.2 | 5.6 ± 1.3 | 7.3 ± 0.9 | 8.2 ± 0.8 |
| Peak PTa (s) (mean ± SE) | — | 15.7 ± 0.5 | 53.4 ± 9.4 | 31.5 ± 2.5 | 51.5 ± 4.5 |
Volunteers, Vol; acetaminophen-induced acute liver injury, AALI; acetaminophen-induced acute liver failure, AALF; S, survivors; NS, non-survivors; liver transaminases, LT.
aWhen available. Alanine aminotransferase, ALT; prothrombin time, PT; bilirubin, Bili.
AALF patients
To compare patients who did and did not survive, serum samples from AALF patients were obtained through the Acute Liver Failure Study Group network (Table 1). Serum samples were balanced for the number of survivors and non-survivors. The diagnosis of APAP overdose was made by on-site investigators using standard criteria, as described above. Patients were excluded from the study if they had evidence of liver injury from some other causes, eg, viral hepatitis. In other respects, typical ALF criteria were applied: elevated INR (≥1.5), hepatic encephalopathy, and liver failure within 26 weeks of illness onset without evidence of other liver diseases. Samples were centrifuged on-site to obtain serum and stored at −80°C. Only samples from patients with evidence of tissue necrosis (peak in-study alanine aminotransferase [ALT] ≥ 1000 U/l) were used for our measurements. Informed written consent was obtained from next of kin. Time from admission to hospital to first drawn blood sample has been previously reported (McGill et al., 2014b).
CLI patients
For the cholestatic patients, patients admitted to the University of Kansas Hospital were enrolled in an IRB approved protocol. Informed written consent was obtained from each patient. The inclusion criteria for the study included subjects undergoing planned endoscopic retrograde cholangiopancreatography (ERCP) for medical diagnosis and potential treatment of cholestasis. Patients with viral hepatitis, or any form of well-defined intrahepatic cholestasis, or autoimmune hepatitis, were excluded from this group. This group was pared down via etiology, and only patients with extrahepatic cholestasis or presumed extrahepatic cholestasis prior to ERCP were included in this study. Etiologies included gallstones, biliary stricture, obstructive jaundice, and pancreatitis. Diseases with autoimmune hepatitis features such as primary biliary cirrhosis or primary sclerosing cholangitis were excluded. Patients were split into two groups: the uninjured group (UI) were patients defined as having ALT < 40 U/l and alkaline phosphatase (ALP) < 110 U/l and the CLI group which were defined as patients with ALT > 40 U/l and ALP > 110 U/l and clinically diagnosed cholestasis as evidenced by ERCP (Table 2).
TABLE 2.
Cholestatic Patients
| UI | CLI | |
|---|---|---|
| N | 11 | 23 |
| Age (median, range) | 64, 39–83 | 57, 33–79 |
| Sex (% female) | 45 | 43 |
| ALT (U/l) (mean ± SE) | 20 ± 2 | 227 ± 40 |
| ALP (U/l) (mean ± SE) | 61 ± 9 | 465 ± 87 |
| Bili (mg/dl) (mean ± SE) | 0.8 ± 0.1 | 5.6 ± 1.5 |
Alanine aminotransferase, ALT; alkaline phosphatase, ALP; bilirubin, Bili; uninjured patients, UI; cholestatic liver injury, CLI.
Clinical data
Prothrombin time, serum ALT, serum ALP, and serum bilirubin were measured in clinical laboratories at the participating hospitals using standard clinical methods.
Bile acid analysis
Serum and plasma bile acids were measured using a method adapted from Alnouti et al. (2008) and Zhang et al. (2012). Serum and plasma samples were prepared using a methanol extraction procedure to facilitate the removal of serum proteins by centrifugation. This was done by mixing 20 µl of serum with 80 µl of methanol spiked with internal standard and briefly vortexing, then centrifuging at 14 000 × g for 10 min. The supernatant was extracted and used for measurements. Bile acids in these extracts (5 μl injection) were then separated using a Waters (Waters, Milford, Massachusetts) Acquity ultra-performance liquid chromatograph (UPLC) equipped with a Waters Acquity BEH C18 column (1.7 μm, 130 Å, 2.1 mm × 100 mm) equipped with a Waters BEH C18 VanGuard pre-column (1.7 μm, 130 Å, 2.1 mm × 5 mm). The UPLC eluent was analyzed using a Waters Synapt HDMS quadrupole/ion-mobility/time-of-flight hybrid mass spectrometer equipped with an electrospray probe. Chromatography was performed at a flow rate of 0.3 ml/min using the following gradient program: mobile phase A (0.1% formic acid in water) was given at 0.3 ml/min 98% for 3.5 min (with the first 3 min directed to waste) prior to initiation of a linear gradient lasting 17.5 min that terminated at 98% mobile phase B (0.1% formic acid in acetonitrile). This was followed by a 2-min soak at 98% mobile phase B whereupon the mobile phase was returned to 98% over 2 min and equilibrated at these conditions for 5 min more. The mass spectrometer was operated in negative mode over a mass range of 100–1000 m/z with V-optics (normal dynamic range) enabled. The cone and capillary voltages set to 35 V and 3.0 kV, respectively. The source and desolvation temperatures were set at 120°C and 350°C, respectively, while nitrogen was supplied as the cone (50 l/h) and desolvation gases (700 l/h). MS1 data were collected at an acquisition rate of one scan per second with Lock-spray correction (2 pg/µl leucine enkephalin, 20 μl/min, 5 s frequency, 10 scan average). Absolute quantification was accomplished by comparing against a standard curve of six different concentrations of each bile acid. Concentrations of bile acid standards used were 100 ng/ml, 500 ng/ml, 2 µg/ml, 5 µg/ml, 10 µg/ml, and 25 µg/ml to create the standard curve. Bile acid concentrations falling below a 100 ng/ml threshold were listed as n.d. or not determinable.
Statistics
Normality was assessed using the Shapiro-Wilk test and all patient data were found to be non-normal. Differences between groups were tested for significance using the Mann-Whitney U test. Time course data were assessed using one-way ANOVA on ranks with Dunn’s post hoc test against control values. Receiver operating characteristic (ROC) curve analysis was performed in SigmaPlot 12.5 (Systat Software, San Jose, California). Logistic regression and calculation of odds ratios (ORs) were performed using SAS 9.4 (SAS Institute Inc., Cary, NC). In all cases, P < 0.05 was considered statistically significant.
RESULTS
Plasma bile acid levels were first measured in a time course of patients hospitalized for acute APAP-induced acute liver injury (AALI) (Patient information in Table 1). Total plasma bile acid levels increased significantly versus both control volunteer patients and APAP overdose patients with normal liver transaminases (NLTs) (Figure 1A). Total plasma bile acid peaked around day 1, and levels fell slowly over the first 6 days, but remained elevated over control values, indicating persistent liver dysfunction in these patients, consistent with elevated bilirubin levels (Table 1, Figure 1A). Eleven total bile acids (TBAs) were determined in each patient (Supplementary Table 1): lithocholic acid (LCA), ursodeoxycholic acid (UDCA), CDCA, DCA, cholic acid (CA), taurocholic acid (TCA), glycochenodeoxycholic acid (GCDCA), taurochenodeoxycholic acid (TCDCA), glycocholic acid (GCA), GDCA, and taurodeoxycholic acid (TDCA), plus TBA levels. This study focused primarily on the glycine and taurine amidated conjugates of CA, CDCA, and DCA. These bile acids represent 95%–99% of the bile acid pool in systemic circulation during liver injury, and are the only bile acids that accumulate to micromolar concentrations in serum (Trottier et al., 2011, 2012). As a large majority of studies currently done on bile acids focus on the administration of micromolar concentrations, as this is where major biological effects begin to occur, we focused on these six bile acids, assuming that these would be biologically most relevant. GCDCA, TCDCA, GCA, TCA, GDCA, and TDCA were all elevated when compared with control patients or patients with APAP overdose but NLTs at every time point measured over the first 4 days (Figure 1B and 1C). GCA accumulated to the greatest degree, and in line with TBA data, a majority of the bile acid concentrations peaked at day 1 or day 2, which was around the time of peak ALT. Peak levels of the six bile acids were between 2 and 25 µg/ml. This sustained increase in bile acid levels suggested bile acids may serve as novel biomarkers of liver dysfunction and liver injury during AALF and could potentially be predictive of the course of injury.
FIG. 1.
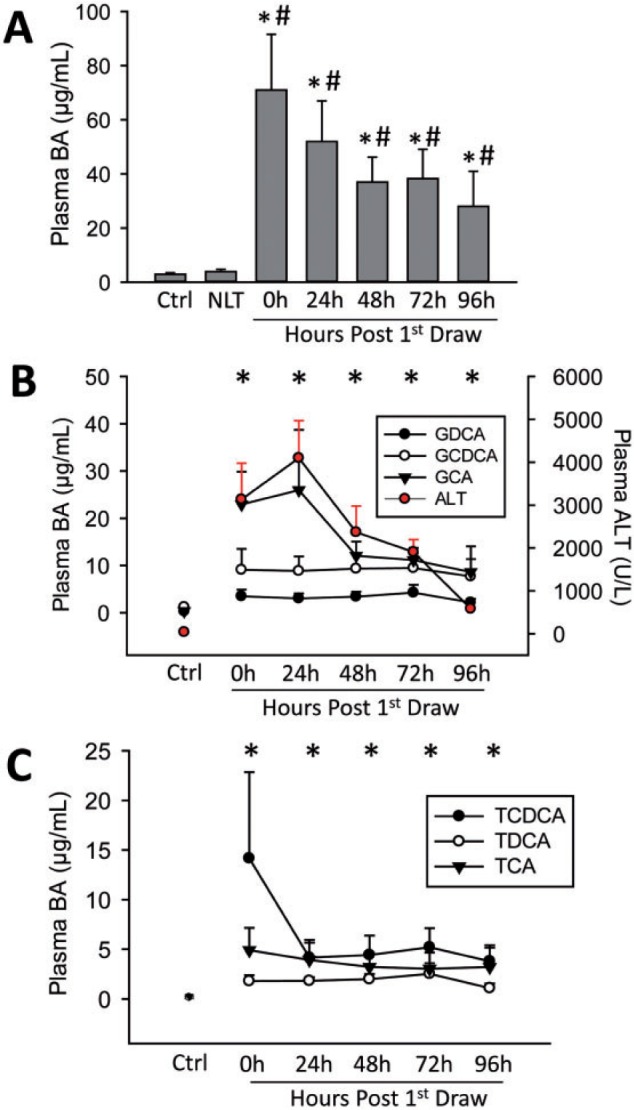
Plasma bile acid levels were measured in patients with acetaminophen (APAP)-induced liver injury, control patients (Ctrl), and in patients with APAP overdose but normal liver transaminases (NLT). Total bile acid (TBA) values (A) were defined as the combined concentrations of TDCA, GDCA, GCDCA, TCDCA, TCA, GCA, CA, CDCA, UDCA, LCA, CA, and TLCA. A time course was established post first blood draw for individual glycine conjugated bile acids with plasma ALT time course for the overdose patient group (B), and individual bile acid levels for taurine conjugated bile acids (C). Control patients n = 6, normal LT and 24–96 h patients n = 9–12, day 6 patients n = 3. In A, *P < 0.05 versus control; #P < 0.05 versus NLT patients. In B and C, *P < 0.05 compared with control for all bile acids at that time point.
Serum bile acids were next measured in a well-defined patient group with AALF, a separate population with advanced drug-induced liver failure (Patient information in Table 1) to determine whether individual bile acid concentrations could accurately predict patient outcome. Values were measured in samples from each patient at the day of study admission and in the samples collected nearest to the time of peak ALT to normalize data to time and course of injury. Serum concentrations of TCA, GCA, GCDCA, TCDCA, TDCA, and GDCA were substantially elevated in the AALF patient groups compared with healthy volunteers (Figure 2A). Although a majority of the bile acids showed no difference between groups, GDCA was significantly higher in non-surviving patients (Figure 2B). ROC analysis was performed to assess the ability of each individual bile acid to predict outcome either near the time of peak ALT or on day 1 (Tables 3 and 4). Although a majority of the bile acids showed no predictive value, ROC analysis indicated serum GDCA could modestly predict death (AUC: 0.70 on day of study admission, P < 0.05), although the AUC for the curve was below currently established metrics (Figure 2C and Tables 3 and 4). Importantly, ALT was not significantly different between the survivors and non-survivors, and ALT did not predict outcome. Of note, the generally more toxic glycine amidated conjugate of each of the primary bile acids, as well as DCA, increased more than the corresponding taurine conjugate, indicating a more hydrophobic bile acid pool (Figures 2A and 2D). We also saw predictive value from ALP at time of admission (Supplementary Figure 1), which may further suggest that biliary dysfunction is a contributor to injury during AALF; however, there was no predictive value for bilirubin at time of admission or bilirubin at peak ALT (Supplementary Figure 1). These data indicate serum GDCA has potential value as a prognostic indicator in the clinical setting. The optimal cutoff value for prediction of death with GDCA from the ROC curve analysis in our study was 9.6 µg/ml (Sens.: 0.581, Spec.: 0.833).
FIG. 2.

Individual serum bile acid levels were measured in control patients and in patients with APAP-induced ALF at peak ALT time for each patient (A), which were grouped into survivors (S) and non-survivors (NS). GDCA was found to be significantly increased in non-survivors (B) and was associated with a moderate predictive value by ROC analysis (C). Glycine conjugates and taurine conjugates of each bile acid were totaled and averaged for each patient (D). N for each group is indicated in Table 1. *P < 0.05 versus matched pair.
TABLE 3.
Bile Acids and Outcome, Study Admission Samples
| Bile Acid | AUC | P Value, AUC | Sens (95% CI) at 90% Spec | Spec (95% CI) at 90% Sens | OR (95% CI) | P Value, OR |
|---|---|---|---|---|---|---|
| ALT | 0.581 | >0.05 | 1.000 (1.00–1.00) | >0.05 | ||
| Peak MELD | 0.762 | 0.001 | 0.320 (0.150–0.535) | 0.429 (0.245–0.628) | 1.104 (1.033–1.180) | 0.004 |
| LCAa | ND | ND | ND | ND | ||
| UDCA | 0.486 | >0.05 | 1.711 (0.451–6.489) | >0.05 | ||
| CDCAa | ND | ND | ND | ND | ||
| DCA | 0.621 | >0.05 | 1.705 (0.977–2.977) | >0.05 | ||
| CA | 0.537 | >0.05 | 2.045 (0.629–6.650) | >0.05 | ||
| TCA | 0.597 | >0.05 | 1.01 (0.925–1.103) | >0.05 | ||
| GCDCA | 0.532 | >0.05 | 1.000 (0.962–1.040) | >0.05 | ||
| GDCA | 0.702 | 0.004 | 0.419 (0.246–0.609) | 0.200 (0.077–0.386) | 1.137 (1.031–1.254) | 0.006 |
| GCA | 0.432 | >0.05 | 0.996 (0.970–1.021) | >0.05 | ||
| TDCA | 0.561 | >0.05 | 1.079 (0.836–1.394) | >0.05 | ||
| TCDCA | 0.471 | >0.05 | 0.983 (0.914–1.057) | >0.05 | ||
| TBA | 0.577 | >0.05 | 1.002 (0.991–1.014) | >0.05 |
aNot detectable in most samples. Not determined, ND; model for end-stage liver disease, MELD; odds ratio, OR; area under the curve, AUC; total bile acids, TBA; bile acids defined in text.
TABLE 4.
Bile Acids and Outcome, Peak ALT Samples
| Bile Acid | AUC | P Value, AUC | Sens (95% CI) at 90% Spec | Spec (95% CI) at 90% Sens | OR (95% CI) | P Value, OR |
|---|---|---|---|---|---|---|
| ALT | 0.614 | >0.05 | 1.000 | >0.05 | ||
| Peak MELD | 0.762 | 0.001 | 0.320, 0.150–0.535 | 0.429, 0.245–0.628 | 1.104 (1.033–1.180) | 0.004 |
| LCAa | ND | ND | ND | ND | ||
| UDCAb | 0.527 | >0.05 | 0.476 (0.008–29.167) | >0.05 | ||
| CDCAa | ND | ND | ND | ND | ||
| DCA | 0.609 | >0.05 | 1.621 (0.911–2.884) | >0.05 | ||
| CA | 0.519 | >0.05 | 1.817 (0.496–6.653) | >0.05 | ||
| TCA | 0.596 | >0.05 | 1.01 (0.926–1.101) | >0.05 | ||
| GCDCA | 0.536 | >0.05 | 1.001 (0.963–1.041) | >0.05 | ||
| GDCA | 0.681 | 0.010 | 0.355, 0.192–0.546 | 0.065, 0.008–0.167 | 1.125 (1.018–1.244) | 0.005 |
| GCA | 0.445 | >0.05 | 0.993 (0.966–1.021) | >0.05 | ||
| TDCA | 0.544 | >0.05 | 1.037 (0.821–1.310) | >0.05 | ||
| TCDCA | 0.469 | >0.05 | 0.981 (0.914–1.053) | >0.05 | ||
| TBA | 0.565 | >0.05 | 1.001 (0.990–1.013) | >0.05 |
aNot detectable in most samples.
bOne outlier (>7 SD from mean) was excluded; this changed the sign of the logistic regression coefficient, but did not change the results of AUC or OR significance tests. Not determined, ND; model for end-stage liver disease, MELD; odds ratio, OR; area under the curve, AUC; total bile acids, TBA; bile acids defined in text.
Given the substantial increase in bile acids in the AALF patients, we wanted to compare these values to a traditional model of increased serum bile acid levels. Serum bile acid concentrations were measured in cholestatic patients with very mild to serious CLI (patient data in Table 2). Cholestasis resulted in a significant increase in the same set of serum bile acids as measured previously in patients with APAP-induced liver injury versus either control patients or patients with benign biliary dysfunction (Figure 3A). Surprisingly though, serum bile acid values in cholestatic patients rose to peak levels between 500 ng/ml (TDCA) and 6 µg/ml (GCDCA), substantially lower than the AALF patient values. Total serum bile acid levels were directly compared between the AALF patients and the cholestatic patients (Figure 3B). TBA levels were significantly increased in the ALF patients versus both uninjured and injured cholestatic patients. These values mirrored relative ALT values for the two groups (Figure 3C), suggesting that the increase in serum bile acids may be related to the degree of liver injury, which directly leads to liver dysfunction.
FIG. 3.

Serum bile acid levels were measured in control patients, as well as patients with cholestatic liver injury (CLI) or benign mild biliary dysfunction (UI). A, Individual bile acid levels in UI and CLI patients compared with controls. *P < 0.05 (compared with matched pair). B, TBA levels and (C) ALT activities of patients with cholestasis (UI, CLI) or APAP overdose (S, survivors; NS, non-survivors) at the time of peak ALT levels. *P < 0.05 (compared with UI patient group). #P < 0.05 (compared with CLI patient group). N for each group is indicated in Table 2.
DISCUSSION
Bile Acids as Prognostic Serum Biomarkers in AALF
A number of recent papers have focused on release of intracellular components to assess both translational mechanisms (McGill et al., 2012, 2014a) and potential prognostic biomarkers (Antoine et al., 2012, 2013; McGill et al., 2012, 2014b; Weerasinghe et al., 2014). More traditional metrics, such as the MELD score, typically include levels of circulating markers of liver function such as bilirubin levels (Schmidt and Larsen, 2007). As bile acid enterohepatic circulation is contingent upon active secretion by functional hepatocytes, we hypothesized that individual circulating bile acid levels might be predictive of future survival in APAP overdose patients. Of note, plasma levels of multiple individual bile acids and TBA levels rose significantly above control levels in patients with AALI, whereas patients without increases in transaminases had values similar to control patient levels of circulating bile acids. These findings suggest that the increase in serum bile acids may be a consequence of liver injury and dysfunction. The bile acid levels remained elevated over the first 6 days of the patient course, indicating serum bile acid levels may have prognostic value even in patients that have been hospitalized for longer periods. Leveraging the ALF Study Group sample population, we were able to show GDCA levels rose significantly higher in the non-surviving AALF patients than in patients that survived APAP overdose, despite similar ALT values between groups. Although total serum bile acids were not different between groups at either peak ALT or day 1 of admission between the surviving and non-surviving AALF patients, GDCA values were increased significantly in the non-surviving patients. Although the mechanism behind why this specific bile acid is elevated in non-surviving patients was not addressed in this article, this difference in a single bile acid draws attention to the value of examining the entire bile acid spectrum, rather than simply measuring TBA levels. Furthermore, ROC analysis indicates that GDCA retrospectively predicted survival in this cohort of patients with AALF using either peak ALT values or day of admission values, although the predictive value was modest on its own. Thus, while it is unlikely GDCA can outperform current prognostic metrics, measurements of GDCA can be done rapidly, so future work assessing the potential of GDCA to be used as part of a battery of tests, or as a component of a larger scoring system to assess progression to transplantation or death may be warranted.
Although female non-survivors still had significantly higher GDCA values than their surviving counterparts, this effect was lost in the male group. This was likely due to the much lower number of males in the study as the populations were 70%–80% female in both survivors and non-survivors. Although not statistically evaluated for every bile acid, this was largely conserved across the bile acid species that were tested with female patients being highly similar to results from both sexes together, and male patients being only slightly higher.
Serum Bile Acid Levels as a Marker of General Liver Injury and Function
Previous research indicating that bile acids accumulate in the serum after APAP overdose in rats has also noted serum bile acid increases in multiple other models of liver injury (Luo et al., 2014; Yamazaki et al., 2013). Circulation of bile acids is dependent on active transport of bile acids from hepatocytes into the biliary tracts by canalicular transporters. This process is highly susceptible to perturbation, as even minor liver damage can cause increases in serum bile acids (Yamazaki et al., 2013), suggesting bile acids are a highly sensitive marker for liver injury and liver dysfunction. Total serum bile acid levels have been proposed as prognostic criteria either by themselves or as a battery before (Hoekstra et al., 2012; Shlomai et al., 2013); however, increased interest has developed recently in the analysis of specific bile acids that compose a portion of this milieu as UPLC or HPLC/MS methods have been developed that allow for the rapid detection of multiple bile acids simultaneously in serum (Alnouti et al., 2008). As serum bile acid levels are also elevated and associated with disease progression in NASH patients (Bechmann et al., 2013), studies assessing individual bile acids in populations such as these may yield novel prognostic markers that can differentiate between benign and advanced forms of disease. More research is necessary on other etiologies of liver disease to determine whether individual bile acids such as GDCA or others directly correlate with disease progression and outcome.
Increased Serum Bile Acid Levels as a Source of Injury In vivo
An increase in circulating bile acid levels during liver injury is established in multiple models of injury in addition to APAP overdose (Bechmann et al., 2013; Luo et al., 2014; Péan et al., 2013; Yamazaki et al., 2013). In this study, we surprisingly found that serum bile acid levels were significantly increased up to 5-fold higher in AALF patients versus patients with CLI. This included significant increases in bile acids such as GCDCA that are commonly thought to be a direct cause of CLI in man (González et al., 2011; Malhi et al., 2011; Woolbright and Jaeschke, 2012).
This raises the question whether systemic increases in bile acid levels can be a direct cause of liver injury, or whether they are just an indicator of liver dysfunction. The current study supports the conclusion that increases in serum bile acid levels during liver injury do not directly cause cell death. The role of bile acids in liver injury has been most studied with regard to their role in CLI. Serum or plasma concentrations of hydrophobic toxic bile acids have been suggested to be a major mediator of injury during cholestasis (Jang et al., 2012), NASH (Bechmann et al., 2013), and regeneration during massive liver injury via partial hepatectomy (Péan et al., 2013). Although the predominant hypothesis in the field of CLI is that the accumulation of bile acids in serum and liver, directly results in cell death (Guicciardi et al., 2013), recent work has cast some doubt on this hypothesis (Trottier et al., 2011; Woolbright et al., 2013; Zhang et al., 2012). Concentrations of approximately 40 µM GCDCA are known to cause apoptosis of rat hepatocytes in vitro (Spivey et al., 1993). This led to the hypothesis that accumulation of low levels of bile salts such as GCDCA results in apoptosis that drives CLI (reviewed in Guicciardi et al., 2013). Data in the current study dispute this idea. Concentrations of all bile acids in human cholestatic patients were significantly below 40 µM in this study, indicating it is unlikely hepatocytes are exposed to such high concentrations of toxic bile acids at the basolateral surface during cholestasis (Figure 3). In fact, AALF patients had serum GCDCA concentrations of almost 25 µM, over 4 times the concentrations of approximately 6 µM in cholestatic patients. Despite these significant elevations in toxic bile acids, AALI is known to be an almost entirely necrotic pathology in human patients (Antoine et al., 2012; McGill et al., 2012) and human hepatocytes (Xie et al., 2014), and the mechanism of APAP-induced liver injury is not generally thought to involve increases in bile acid levels. In fact, in rodents, bile acids serve a protective role as depletion of bile acids by cholestyramine enhances injury, whereas feeding CA enhances regeneration by sustaining glutathione levels (Bhushan et al., 2013), which is known to be protective (Ni et al., 2012). Moreover, human hepatocytes are apparently resistant to bile acid-induced apoptosis, as doses used to cause injury in vitro to primary human hepatocytes are typically 10-fold higher than those used to cause injury in rodent hepatocytes (Galle et al., 1990; Gonzalez et al., 2011; Spivey et al., 1993). Acutely, it requires in vitro administration of concentrations of toxic bile acids similar to biliary concentrations before human or mouse hepatocytes undergo necrosis, with little evidence for apoptotic cell death (Woolbright et al., 2014a). Thus, it seems unlikely that serum concentrations of bile acids contribute “as a direct cause of CLI,” or in any other disease with a mild increase in serum bile acid levels. Rather, if intrahepatic bile acid accumulation is the major cause of injury during cholestasis, the source of the bile acid accumulation must be due to either rupture of the biliary tracts where bile acids are present in millimolar quantities, or direct inhibition of bile acid export from hepatocytes for toxic concentrations to reach these levels (Jemnitz et al., 2010; Padda et al., 2011; Woolbright et al., 2014a). As such, increases in serum bile acid levels in man during CLI (as well as other forms of liver injury) are likely an effect of liver injury and dysfunction, but not a cause, and do not directly result in cell death. Although increased serum bile acid levels may affect pathology in some models, serum bile acid concentrations alone are likely insufficient to directly cause injury in vivo.
Summary and Conclusions
Our data indicate that serum or plasma concentrations of individual bile acids hold some potential as biomarkers of liver injury and dysfunction, and moreover, GDCA may be a viable prognostic indicator of the course of APAP toxicity, especially if combined with other prognostic indicators. Furthermore, these data suggest a re-evaluation of serum bile acids as a source of pathology, as their role during liver injury may be far more complex. In conclusion, further studies may be warranted on the use of GDCA as a prognostic biomarker for AALF outcome clinically either alone or as part of a suite of tests.
SUPPLEMENTARY DATA
Supplementary data are available online at http://toxsci.oxfordjournals.org/.
FUNDING
The National Institute of Diabetes and Digestive and Kidney Diseases (NIDDK) grant U-01—58369 (to W.M.L. and the ALF Study Group). The data and samples reported here were supplied by the NIDDK Central Repositories. This manuscript does not necessarily reflect the opinions or views of the NIDDK Central Repositories, or the NIDDK. The National Institutes of Health (R01 DK070195 and R01 AA12916 to H.J.), and The National Center for Research Resources (5P20RR021940-07) and the National Institute of General Medical Sciences (8 P20 GM103549-07) of the National Institutes of Health; A CTSA grant from NCATS awarded to the University of Kansas Medical Center for Frontiers: The Heartland Institute for Clinical and Translational Research No. UL1TR000001 (formerly No. UL1RR033179). The contents are solely the responsibility of the authors and do not necessarily represent the official views of the NIH or NCATS. Additional support came from the “Training Program in Environmental Toxicology” T32 ES007079-26A2 (to B.L.W. and M.R.M.) from the National Institute of Environmental Health Sciences.
Supplementary Material
ACKNOWLEDGMENTS
The authors thank Dr. Steven A. Weinman, Brian Bridges, and the University of Kansas Medical Center Liver Bank for their assistance in procurement of the cholestasis samples. The authors declare no competing financial interest.
REFERENCES
- Alnouti Y., Csanaky I. L., Klaassen C. D. (2008). Quantitative-profiling of bile acids and their conjugates in mouse liver, bile, plasma, and urine using LC-MS/MS. J. Chromatogr. B Analyt. Technol. Biomed. Life Sci. 873, 209–217. [DOI] [PMC free article] [PubMed] [Google Scholar]
- Antoine D. J., Jenkins R. E., Dear J. W., Williams D. P., McGill M. R., Sharpe M. R., Craig D. G., Simpson K. J., Jaeschke H., Park B. K. (2012). Molecular forms of HMGB1 and keratin-18 as mechanistic biomarkers for mode of cell death and prognosis during clinical acetaminophen hepatotoxicity. J. Hepatol. 56, 1070–1079. [DOI] [PMC free article] [PubMed] [Google Scholar] [Retracted]
- Antoine D. J., Dear J. W., Lewis P. S., Platt V., Coyle J., Masson M., Thanacoody R. H., Gray A. J., Webb D. J., Moggs J. G., et al. (2013). Mechanistic biomarkers provide early and sensitive detection of acetaminophen-induced acute liver injury at first presentation to hospital. Hepatology 58, 777–787. [DOI] [PMC free article] [PubMed] [Google Scholar]
- Bechmann L. P., Kocabayoglu P., Sowa J. P., Sydor S., Best J., Schlattjan M., Beilfuss A., Schmitt J., Hannivoort R. A., Kilicarslan A., et al. (2013). Free fatty acids repress small heterodimer partner (SHP) activation and adiponectin counteracts bile acid-induced liver injury in superobese patients with nonalcoholic steatohepatitis. Hepatology 57, 1394–1406. [DOI] [PubMed] [Google Scholar]
- Bhushan B., Borude P., Edwards G., Walesky C., Cleveland J., Li F., Ma X., Apte U. (2013). Role of bile acids in liver injury and regeneration following acetaminophen overdose. Am. J. Pathol. 183, 1518–1526. [DOI] [PMC free article] [PubMed] [Google Scholar]
- Chiang J. Y. (2013). Bile acid metabolism and signaling. Compr. Physiol. 3, 1191–1212. [DOI] [PMC free article] [PubMed] [Google Scholar]
- Galle P. R., Theilmann L., Raedsch R., Otto G., Stiehl A. (1990). Ursodeoxycholate reduces hepatotoxicity of bile salts in primary human hepatocytes. Hepatology 12, 486–491. [DOI] [PubMed] [Google Scholar]
- González R., Cruz A., Ferrín G., López-Cillero P., Fernández-Rodríguez R., Briceño J., Gómez M. A., Rufián S., Mata Mde L., Martínez-Ruiz A., et al. (2011). Nitric oxide mimics transcriptional and post-translational regulation during α-tocopherol cytoprotection against glycochenodeoxycholate-induced cell death in hepatocytes. J. Hepatol. 55, 133–144. [DOI] [PubMed] [Google Scholar]
- Guicciardi M. E., Malhi H., Mott J. L., Gores G. J. (2013). Apoptosis and necrosis in the liver. Compr. Physiol. 3, 977–1010. [DOI] [PMC free article] [PubMed] [Google Scholar]
- Hoekstra L. T., van Lienden K. P., Schaap F. G., Chamuleau R. A., Bennink R. J., van Gulik T. M. (2012). Can plasma bile salt, triglycerides, and apoA-V levels predict liver regeneration? World J. Surg. 36, 2901–2908. [DOI] [PubMed] [Google Scholar]
- Jaeschke H., McGill M. R., Ramachandran A. (2012). Oxidant stress, mitochondria, and cell death mechanisms in drug-induced liver injury: lessons learned from acetaminophen hepatotoxicity. Drug Metab. Rev. 44, 88–106. [DOI] [PMC free article] [PubMed] [Google Scholar]
- Jang J. H., Rickenbacher A., Humar B., Weber A., Raptis D. A., Lehmann K., Stieger B., Moritz W., Soll C., Georgiev P., et al. (2012). Serotonin protects mouse liver from cholestatic injury by decreasing bile salt pool after bile duct ligation. Hepatology 56, 209–218. [DOI] [PubMed] [Google Scholar]
- Jemnitz K., Veres Z., Vereczkey L. (2010). Contribution of high basolateral bile salt efflux to the lack of hepatotoxicity in rat in response to drugs inducing cholestasis in human. Toxicol. Sci. 115, 80–88. [DOI] [PubMed] [Google Scholar]
- Lee W. M. (2012). Liver: determining prognosis in acute liver failure. Nat. Rev. Gastroenterol. Hepatol. 9, 192–194. [DOI] [PubMed] [Google Scholar]
- Luo L., Schomaker S., Houle C., Aubrecht J., Colangelo J. L. (2014). Evaluation of serum bile acid profiles as biomarkers of liver injury in rodents. Toxicol. Sci. 137, 12–25. [DOI] [PubMed] [Google Scholar]
- Malhi H., Guicciardi M. E., Gores G. J. (2011). Hepatocyte death: a clear and present danger. Physiol. Rev. 90, 1165–1194. [DOI] [PMC free article] [PubMed] [Google Scholar]
- McGill M. R., Jaeschke H. (2014). Mechanistic biomarkers in acetaminophen-induced hepatotoxicity and acute liver failure: from preclinical models to patients. Expert Opin. Drug Metab. Toxicol. 10, 1005–1017. [DOI] [PMC free article] [PubMed] [Google Scholar]
- McGill M. R., Cao M., Svetlov A., Sharpe M. R., Williams C. D., Curry S. C., Farhood A., Jaeschke H., Svetlov S. I. (2014a). Argininosuccinate synthetase as a plasma biomarker of liver injury after acetaminophen overdose in rodents and humans. Biomarkers 19, 222–230. [DOI] [PMC free article] [PubMed] [Google Scholar]
- McGill M. R., Sharpe M. R., Williams C. D., Taha M., Curry S. C., Jaeschke H. (2012). The mechanism underlying acetaminophen-induced hepatotoxicity in humans and mice involves mitochondrial damage and nuclear DNA fragmentation. J. Clin. Invest. 122, 1574–1583. [DOI] [PMC free article] [PubMed] [Google Scholar]
- McGill M. R., Staggs V. S., Sharpe M. R., Lee W. M., Jaeschke H., and the Acute Liver Failure Study Group. (2014b). Serum mitochondrial biomarkers and damage-associated molecular patterns are higher in acetaminophen overdose patients with poor outcome. Hepatology. Advance Access published Jun 13. doi: 10.1002/hep.27265. [DOI] [PMC free article] [PubMed] [Google Scholar]
- Ni H. M., Boggess N., McGill M. R., Lebofsky M., Borude P., Apte U., Jaeschke H., Ding W. X. (2012). Liver-specific loss of Atg5 causes persistent activation of Nrf2 and protects against acetaminophen-induced liver injury. Toxicol. Sci. 127, 438–450. [DOI] [PMC free article] [PubMed] [Google Scholar]
- Padda M. S., Sanchez M., Akhtar A. J., Boyer J. L. (2011). Drug-induced cholestasis. Hepatology 53, 1377–1387. [DOI] [PMC free article] [PubMed] [Google Scholar]
- Péan N., Doignon I., Garcin I., Besnard A., Julien B., Liu B., Branchereau S., Spraul A., Guettier C., Humbert L., et al. (2013). The receptor TGR5 protects the liver from bile acid overload during liver regeneration in mice. Hepatology 58, 1451–1460. [DOI] [PubMed] [Google Scholar]
- Ramachandran A., McGill M. R., Xie Y., Ni H. M., Ding W. X., Jaeschke H. (2013). Receptor interacting protein kinase 3 is a critical early mediator of acetaminophen-induced hepatocyte necrosis in mice. Hepatology 58, 2099–2108. [DOI] [PMC free article] [PubMed] [Google Scholar]
- Rutherford A., King L. Y., Hynan L. S., Vedvyas C., Lin W., Lee W. M., Chung R. T., the Acute Liver Failure Study Group. (2012). Development of an accurate index for predicting outcomes of patients with acute liver failure. Gastroenterology 143, 1237–1243. [DOI] [PMC free article] [PubMed] [Google Scholar]
- Schmidt L. E., Larsen F. S. (2007). MELD score as a predictor of liver failure and death in patients with acetaminophen-induced liver injury. Hepatology 45, 789–796. [DOI] [PubMed] [Google Scholar]
- Schomaker S., Warner R., Bock J., Johnson K., Potter D., Van Winkle J., Aubrecht J. (2013). Assessment of emerging biomarkers of liver injury in human subjects. Toxicol. Sci. 132, 276–283. [DOI] [PubMed] [Google Scholar]
- Shlomai A., Halfon P., Goldiner I., Zelber-Sagi S., Halpern Z., Oren R., Bruck R. (2013). Serum bile acid levels as a predictor for the severity of liver fibrosis in patients with chronic hepatitis C. J. Viral Hepat. 20, 95–102. [DOI] [PubMed] [Google Scholar]
- Spivey J. R., Bronk S. F., Gores G. J. (1993). Glycochenodeoxycholate-induced lethal hepatocellular injury in rat hepatocytes. Role of ATP depletion and cytosolic free calcium. J. Clin. Invest. 92, 17–24. [DOI] [PMC free article] [PubMed] [Google Scholar]
- Trottier J., Białek A., Caron P., Straka R. J., Heathcote J., Milkiewicz P., Barbier O. (2012). Metabolomic profiling of 17 bile acids in serum from patients with primary biliary cirrhosis and primary sclerosing cholangitis: a pilot study. Dig. Liver Dis. 44, 303–310. [DOI] [PubMed] [Google Scholar]
- Trottier J., Białek A., Caron P., Straka R. J., Milkiewicz P., Barbier O. (2011). Profiling circulating and urinary bile acids in patients with biliary obstruction before and after biliary stenting. PLoS One 6, e22094. [DOI] [PMC free article] [PubMed] [Google Scholar]
- Weerasinghe S. V., Jang Y. J., Fontana R. J., Omary M. B. (2014). Carbamoyl phosphate synthetase-1 is a rapid turnover biomarker in mouse and human acute liver injury. Am. J. Physiol. Gastrointest. Liver Physiol. 307, G355–G364. [DOI] [PMC free article] [PubMed] [Google Scholar]
- Woolbright B. L., Antoine D. J., Jenkins R. E., Bajt M. L., Park B. K., Jaeschke H. (2013). Plasma biomarkers of liver injury and inflammation demonstrate a lack of apoptosis during obstructive cholestasis in mice. Toxicol. Appl. Pharmacol. 273, 524–531. [DOI] [PMC free article] [PubMed] [Google Scholar]
- Woolbright B. L., Jaeschke H. (2012). Novel insight into mechanisms of cholestatic liver injury. World J. Gastroenterol. 18, 4985–4993. [DOI] [PMC free article] [PubMed] [Google Scholar]
- Woolbright B. L., Li F., Gholami P., Dorko K., Kumer S., Schmitt T., Forster T., Olyaee M., Hagenbuch B., Jaeschke H. (2014a). Human pathophysiological concentrations of bile salts induce necrosis in primary human hepatocytes. FASEB J. 28(Suppl.), 398.1 (Abstract). [Google Scholar]
- Woolbright B. L., Li F., Xie Y., Farhood A., Fickert P., Trauner M., Jaeschke H. (2014b). Lithocholic acid feeding results in direct hepato-toxicity independent of neutrophil function in mice. Toxicol. Lett. 228, 56–66. [DOI] [PMC free article] [PubMed] [Google Scholar]
- Xie Y., McGill M. R., Dorko K., Kumer S. C., Schmitt T. M., Forster J., Jaeschke H. (2014). Mechanisms of acetaminophen-induced cell death in primary human hepatocytes. Toxicol. Appl. Pharmacol. 279, 266–274. [DOI] [PMC free article] [PubMed] [Google Scholar]
- Yamazaki M., Miyake M., Sato H., Masutomi N., Tsutsui N., Adam K. P., Alexander D. C., Lawton K. A., Milburn M. V., Ryals J. A., et al. (2013). Perturbation of bile acid homeostasis is an early pathogenesis event of drug induced liver injury in rats. Toxicol. Appl. Pharmacol. 268, 79–89. [DOI] [PubMed] [Google Scholar]
- Zhang Y. F., He W., Zhang C., Liu X. J., Lu Y., Wang H., Zhang Z. H., Chen X., Xu D. X. (2014). Role of receptor interacting protein (RIP)1 on apoptosis-inducing factor-mediated necroptosis during acetaminophen-evoked acute liver failure in mice. Toxicol. Lett. 225, 445–453. [DOI] [PubMed] [Google Scholar]
- Zhang Y., Hong J. Y., Rockwell C. E., Copple B. L., Jaeschke H., Klaassen C. D. (2012). Effect of bile duct ligation on bile acid composition in mouse serum and liver. Liver Int. 32, 58–69. [DOI] [PMC free article] [PubMed] [Google Scholar]
Associated Data
This section collects any data citations, data availability statements, or supplementary materials included in this article.