Abstract
A new cryomacroscope prototype—a visualization device for the in situ analysis of cryopreserved biological samples—is presented in the current study. In order to visualize samples larger than the field of view of the optical setup, a scanning mechanism is integrated into the system, which represents a key improvement over previous cryomacroscope prototypes. Another key feature of the new design is in its compatibility with available top-loading controlled-rate cooling chambers, which eliminates the need for a dedicated cooling mechanism. The objective for the current development is to create means to generate a single digital movie of an experimental investigation, with all relevant data overlaid. The visualization capabilities of the scanning cryomacroscope are demonstrated in the current study on the cryoprotective agent dimethyl sulfoxide and the cryoprotective cocktail DP6. Demonstrated effects include glass formation, various regimes of crystallization, thermal contraction, and fracture formation.
Keywords: Cryomacroscopy, Visualization, Vitrification, Crystallization, Fracturing
1. Introduction
Controlling ice formation is key to the success of cryopreservation—the preservation of tissues at very low temperatures. While the kinetics of water ice crystallization has been intensively investigated, another level of complexity is introduced to the analysis when crystallization occurs in a biological system [1–3]. While it is well established that the specific sites for ice nucleation and patterns of crystal growth are dependent upon the thermal history, the outcome of ice formation is essentially the same—it triggers a sequence of events leading to cell death [3]. A common method to control ice formation is the application of cryoprotective agents (CPAs) [4,5], which, in turn, may introduce toxicity effects [6]. Balancing the competing needs to minimize ice formation (decreased tendency with the increasing CPA concentration) and to reduce toxicity represents a main trust area in the study of cryobiology.
Crystallization is only one devastating effect in cryopreservation, where the structural integrity of the cryopreserved material may be compromised by thermally driven mechanical forces, resulting in the so-called effect of thermo-mechanical stress (interchangeable with thermal stress in the current manuscript) [7]. The driving mechanism of thermal stress is the intrinsic property of thermal expansion, which represents a tendency of the material to change its volume as a result of temperature changes. Thermal expansion may be driven solely by molecular effects in any given phase of state [8,9], may result from phase transition (for example, pure water changes volume by about 9% upon freezing), or may result from glass transition effects [10,11]. Nonetheless, it is not the thermal expansion per se but the constraint of thermal expansion that gives rise to thermal stress [12,13].
At the cellular level, thermal stress originated from crystal growth may affect the integrity of the cell membrane. However, it is often difficult to distinguish the contribution of thermal stress to cell death from other potentially harmful effects associated with mass transport and toxicity [2]. Hence, the study of cell survival post cryogenic exposure is most frequently diagnostic in nature, using statistical tools to correlate cell survival with specific thermal histories, often not effectively differentiating between the relative magnitudes of those harmful effects.
Thermal stress at the tissue and organ level may introduce additional destructive effects, with fracture formation as the most dramatic outcome [14]. Even a single facture may prevent organ recovery post cryogenic storage due to damage to the neural network, vascular system, or ducts [15]. However, fracture formation is not the only potentially devastating outcome of thermal stress, whereas effects commonly modeled as yield strain, plasticity, and even hydrostatic pressure may also play critical roles [7].
An alternative approach to conventional cryopreservation is known as vitrification, where crystallization is suppressed by rapid cooling of a highly viscous solution (vitreous means glassy in Latin) [16–19]. While vitrification can potentially suppress the harmful effects associated with crystallization, the inherent toxicity of the high CPA concentration required to facilitate vitrification represents a new challenge. Furthermore, the high cooling rates required to facilitate vitrification can potentially increase the probability to structural damage due to thermal stress.
When deviating from ideal conditions for vitrification, crystals may grow to sizes conducive to cell injury either during cooling or during rewarming, depending on the particular thermal history. Rewarming-phase nucleation followed by crystal grow is known as devitrification, whereas crystal growth from nuclei already formed during cooling is known as recrystallization. It is often difficult to conclude whether a particular observation is the result of devitrification or recrystallization and the alternative inclusive term of rewarming-phase crystallization (RPC) may be used [20]. Either way, the tendencies for ice to nucleate and for crystals to growth are not simply dependent upon the instantaneous conditions, but also upon the history of the specimen, making the process path-dependent [7]. The likelihood of structural damage is also inherently path-dependent, with fracturing events at the onset of rewarming due to residual stresses as an example [21–23].
At the cellular level, visualization of physical events such as crystallization, devitrification, recrystallization, and fracture formation is commonly done with the cryomicroscope [24–30]. Consistent with concurrent efforts to scale-up cryopreservation to bulky specimens and organs, an urgent need to develop a complementary device to visualize physical events in large specimens has arisen, with the first prototype termed the cryomacroscope [20]. The uses of the cryomicroscope and the cryomacroscope are complementary while their applications for the benefit of cryopreservation are conceptually different. In cryomicroscopy, representative micro-slices are exposed to conditions similar to those that would prevail in a large-scale specimen at selected points, such that a complete picture of the process can be piecewise assembled. In cryomacroscopy, the large-scale specimen is analyzed as a whole—in situ.
The need for cryomacroscopy studies originates from conflicting results obtained in thin-layers and large volumes under apparently similar conditions. These differences are relating to the thermal history distribution, inhomogeneity in large specimens, variation in surface-area-to-volume ratio, and variations in constraints imposed by solid walls (cover-slips in cryomicroscopy and containers or bags in cryomacroscopy). Such differences may affect the preferred sites of nucleation, the frequency of its appearance, the rate of crystal growth, the distribution of mechanical stress, and sites of stress concentration in the sample, making crystallization and mechanical stress coupled phenomena.
Other than cryomacroscopy, the only practical way to visually evaluate vitrification, crystallization, and fracturing events during cryopreservation of large specimens is by sporadically interrupting the cryogenic protocol and using ordinary photography [31]. With the path-dependency of the cryopreservation protocol, and given its extreme sensitivity to the cooling and rewarming rates, ordinary photography may prove impractical under most circumstances. Either way, when crystallization and/or fracturing become very intense, volumetric evaluation of the vitrified specimen may be limited to surface observations. Being a complementary tool for the analysis of cryopreservation, cryomacroscopy can be integrated with viability and functionality studies to gain a better understanding of volumetric effects even when visualization capabilities are hampered, as reviewed below in the context of the evolution of cryomacroscopy.
The evolution of cryomacroscopy has resulted in three prototypes referred to as Types I through III for simplicity in presentation. Cryomacroscope I has been developed to study vitrification processes in a varying sample volume contained in a 15 mL vial [20,22,32]. In Type I, a passive cooling mechanism was used by applying liquid nitrogen-immersed thermal-resistance sleeves of variable thicknesses. The history of events during the cryogenic protocol was recorded with a HyperHAD monochrome camera on VHS tapes with visualization capabilities aimed at the scale range of 50 μm to 2 cm. The thermal history of the same protocol was recorded with a thermocouple, and analysis of experiments necessitated simultaneous analysis of video tape and thermal history recordings. Results of Type I studies demonstrated—for the first time—that micro fractures in the glassy state may serve as nucleation sites for devitrification. Frequently in related studies, fractures formed only during the rewarming phase, which may be perceived as counter-intuitive. This observation was compared with solid mechanics simulations, showing that thermal stress may continue to build-up during rewarming. Cryomacroscope I was demonstrated as a critical tool for the observations of rewarming-phase fracturing and RPC. Results of this study were further used to investigate mechanical stresses induced by the contraction of the container wall [22].
Advanced studies on Type I aimed at investigating the reasonable boundaries of cryopreservation via vitrification on a rabbit carotid artery model, with the applications of the CPA cocktail VS55 [33]. These studies were focused at correlating physical events of crystallization and fracture formation with functional recovery of blood vessel rings and segments. Results of these studies demonstrated that the vessel’s mechanical function was preserved at marginal cooling rates to facilitate vitrification, with a high contractile response of about 80% relative to the fresh specimen [34]. These results further indicated localized events of ice crystallization around the temperature sensor (thermocouple) and at the cannulated ends of the blood vessel at marginal cooling rates, which correlated well with post-thawing contractility results. This correlation was facilitated by the cryomacroscope.
A second cryomacroscope prototype (Type II) has been developed to study solid-mechanics effects in thin films [35]. In particular, Cryomacroscope II was designed to measure the strain to fracture (the relative elongation at the onset of fracturing), the repeatability of fracturing events, patterns of fracture formation, and the effects of tissue specimens on stress concentration in a large vitrified domain [36]. The main differences between Types I and II are in the specimen setup and cooling mechanism; while Type I was designed to mimic a common cryopreservation protocol in a vial, Type II was design to investigate specific conditions relevant to solid mechanics modeling. The thin-film model was chosen for Type II as it simplifies the corresponding solid mechanics analyses, while taking advantage of measurable substrate-induced forces.
A third cryomacroscope prototype (Type III) has been currently presented to investigate physical events associated with vitrification in the presence of synthetic ice modulators (SIMs) [37]. The main improvement in Type III over Type I is the cooling mechanism: while Type I used a tailor-made passive cooling mechanism, Type III is designed to replace the lid of a commercially available top-loading controlled-rate cooler. Type III further benefits from an improved high-speed camera and illumination via fiber optics. Developed results in [37] indicate improved suppression of crystallization with the application of SIMs and unexpected precipitation of solutes during rewarming. Both Type I and Type III are designed to visualize physical events with a stationary camera in a similar arrangement to the cryomicroscope setup, which represents a challenge for the study of large size samples—larger than the field of view of the optical system.
A new cryomacroscope prototype is proposed in the current study—the scanning cryomacroscope, with the purpose of viewing specimens larger than the field of view of the camera. Similar to Type III, the new setup is design to be an add-on device to a commercially available controlled-rate cooler. The current study presents the new design and demonstrates typical physical events.
2. Experimental Apparatus
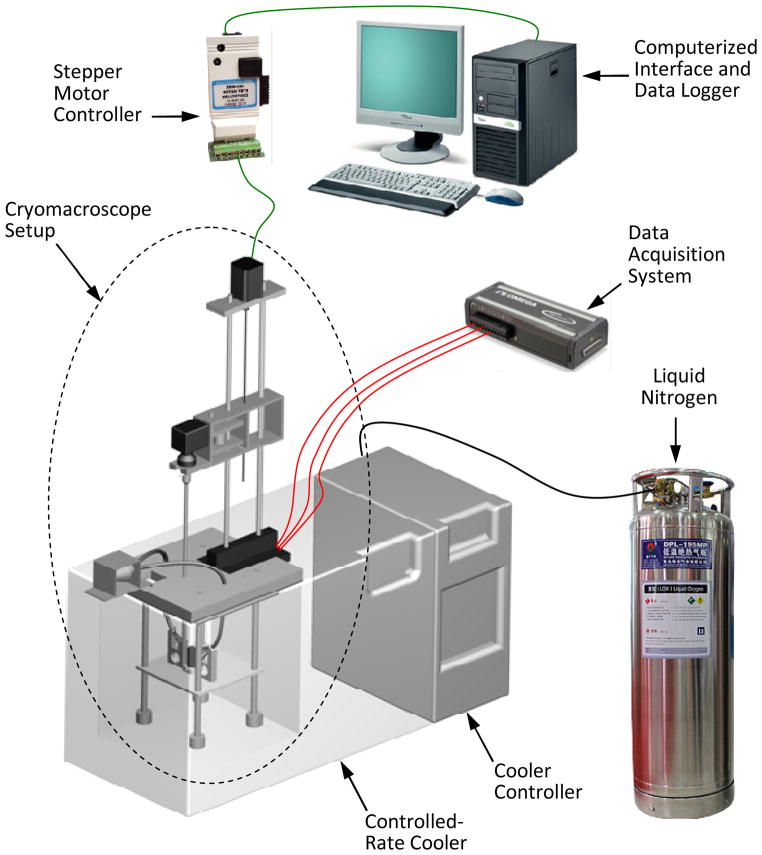
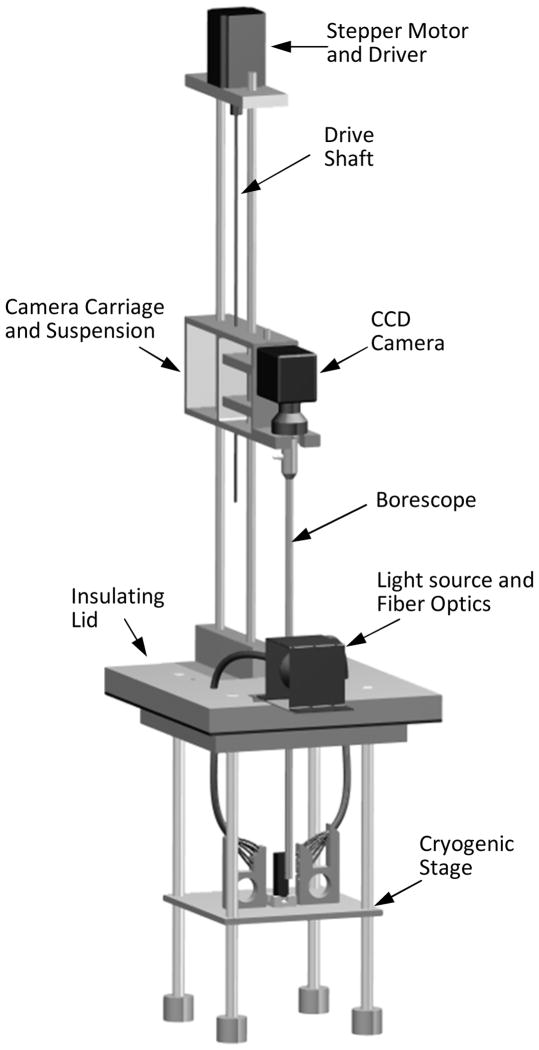
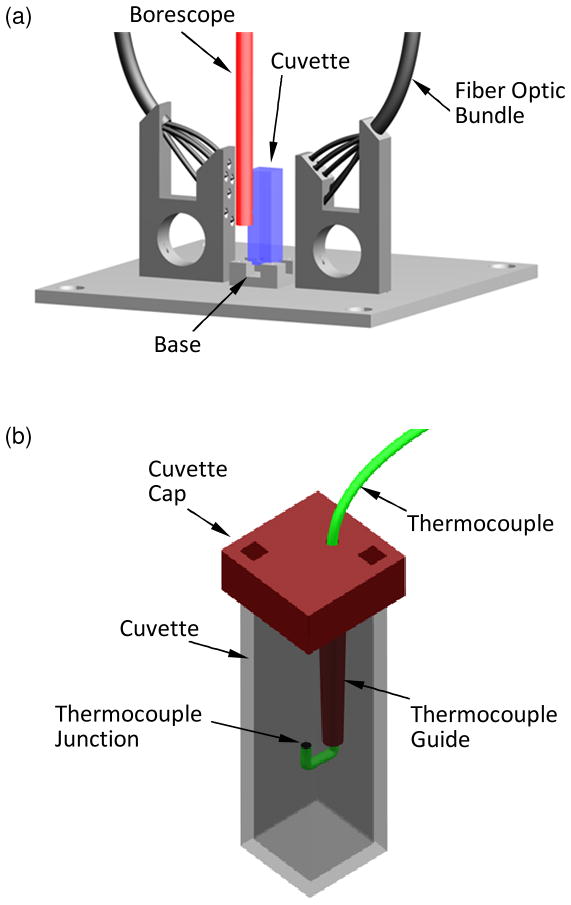
Figure 1 displays a schematic illustration of the cryomacroscope setup and peripheral equipment, Fig. 2 displays the components of the cryomacroscope setup, and Fig. 3 displays the cryogenic stage. The main functions of the cryomacroscope setup are: imaging, scanning, illumination, and temperature sensing, while the specimen is exposed to the cryogenic protocol in the cooling chamber. For this application, a computer code has been developed to control the cryomacroscope operation, to streamline experimental data, and for post-processing of a digital record of the experiment.
Figure 1.
Schematic illustration of the cryomacroscope assembly replacing the standard lid of a controlled-rate cooler (Planer, Kryo 16–10). A personal computer is used for control, data acquisition, and post-processing.
Figure 2.
Schematic illustration of the cryomacroscope setup.
Figure 3.
Schematic illustration of (a) the cryogenic stage and (b) the temperature sensor setup.
Temperature control
The cryomacroscope platform (Fig. 1) is designed as a replacement to the commercially available lid of the controlled-rate cooler Kryo 10–16, controlled with Kryo 10–20 (Planer PLC, UK). The Kryo 10–16 is a liquid nitrogen-based cooler—circulating nitrogen vapors at high flow rates across the cooling chamber. The Kryo 10–20 is a programmable controller to facilitate a series of temperature ramps, having a maximum cooling rate of 50°C/min, a minimum temperature of −180°C, and a maximum rewarming rate of 10°C/min.
Image display and recording
Imaging is achieved with a three-link system, comprising of an external EXView HAD CCD camera (Grasshopper, Point Grey Research, Inc., BC, Canada), an optical coupler (Luxxor 35 mm FL, Gradient Lens Corporation, Inc., NY, USA), and a borescope (Hawkeye HH2992, Gradient Lens Corporation, Inc., NY, USA). The borescope enables visualization of the specimen in situ, while maintaining the camera at room temperature. The camera is controlled by the 3rd party CMU 1394 Digital Camera Driver in MATLAB. The imaging data is streamlined to a computer via a FireWire connection (800 Mbs IEEE1394B) for real-time processing and recording. The camera functionality and data streamlining are controlled via a cryomacroscope control code—a proprietary software package.
Camera motion
Vertical scanning is achieved with a system comprising of a stepper motor (AMH-22, Advanced Micro Systems, Inc., VT, USA), a stepper-motor controller (DCB-274, Advanced Micro Systems, Inc., VT, USA) connected to the controlling computer via a parallel port, a threaded rod to convert the rotational motor motion to a linear camera movement, poles to guide the camera movement, and a camera suspension-damping mechanism. A combination of a camera frame rate of 1.75 Hz and a camera velocity of 1 mm/s was selected in the current study, which leads to 93% overlap between consecutive frames and an overall cuvette scan time of 35 s. This particular combination reduces motion-driven blurring and was found adequate to the rate of physical events occurring during experimentation.
Cryomacroscope Control Code (C3)
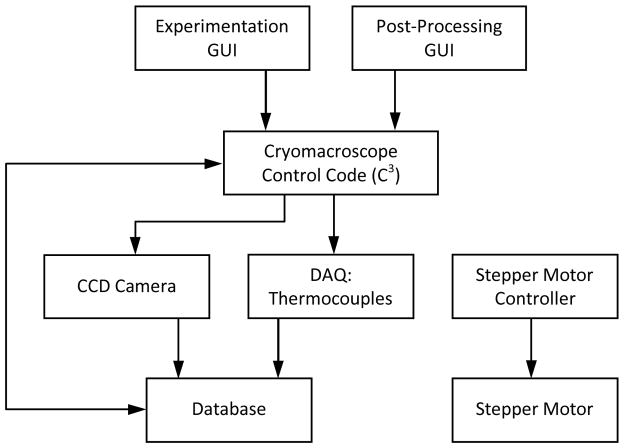
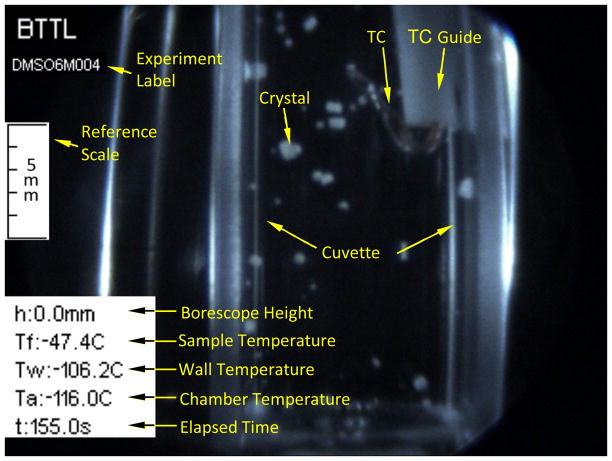
With reference to Fig. 4, two alternative graphic-user interfaces (GUIs) control C3 for experimentation control and post-processing. The experimentation control GUI is used to initialize the CCD camera parameters, initialize the stepper motor controller, streamline captured images to the computer monitor, record the sequence of captured images on the computer hard drive, initialize the data acquisition system, display measured temperatures in real time, record temperature data on the hard drive, and create a log file of the experiment. C3 does not control the cooling chamber operation, which is done via the digital control panel of the Kryo 10–20 system. Hence, cooling chamber control and cryomacroscope control are two parallel and independent operations. The post-processing GUI displayed in Fig. 4 is used to create a unified electronic log of an experiment, with a representative frame of the automatically generated overlaid movie displayed in Fig. 5.
Figure 4.
Flowchart of the cryomacroscope control code, C3. The experimentation GUI controls hardware, provides real-time feedback, and records experimental data. The post-processing GUI compiles, overlays, and compresses recorded data into a single digital movie.
Figure 5.
A representative snapshot from a post-processed experimentation movie.
Illumination
Since the illumination intensity of any light bulb decays dramatically with the decreasing temperature [38], light is directed into the cooling chamber via two fiber-optic bundles (50 individual strands; End Glow 5/16″ cable), from a single external LED source (12 V DC, 5 W, Photon-Lite, FO Products, Inc.). A special fiber optic bundle holder is displayed in Figs. 2–3, which directs the light at a 45° angle onto the specimen. This setup distributes the light adequately, while minimizing reflections back to the camera.
Temperature sensing
Temperature measurements are obtained with three T-type thermocouples (copper-constantan): (1) in the sample, (2) attached to the outer surface of the cuvette wall, and (3) placed in the nitrogen vapor freestream flow inside the cooling chamber. For the immersed thermocouple, a special plastic-holding tube was designed, with the thermocouple junction protruded into the specimen (Fig. 5). This is not the control parameter for the cooling chamber temperature, where the Kryo 10–20 uses a dedicated temperature sensor. Measurements are displayed and recorded using a data acquisition system (OMB-DAQ-56, Omega Engineering, Inc., controlled by DaqViewTM). The certainty in temperature measurements using the combination of thermocouple and data acquisition system is estimated as ±0.5°C. Activated by C3, the data acquisition system displays temperature reading in real time and records it for post-processing operations.
Cryogenic stage
The cryogenic stage is designed to maximize nitrogen vapors around the sample. In the current study, a 4.5 mL cuvette is chosen as the container due to its optical clarity. A tailor-made base (Delrin) mounts the cuvette onto the stage at its four corners, with minimal contact areas of 2 mm × 2 mm to improve convective heat transfer. The cuvette is held by spring-loaded hooks (acrylonitrile butadiene styrene, ABS), extending from the base to the cuvette cap. The cuvette cap is 3D-printed from ABS and integrates the thermocouple guide shown in Fig. 3.
3. Materials and Methods
Cryoprotective agents
For the purpose of evaluating the new device, the current study focuses on physical events occurring during cooling of a dimethyl sulfoxide solution (DMSO) at various concentrations and the cryoprotective cocktail DP6, which is a mixture of 234.4 g/L DMSO (3 M), 228.3 g/L propylene glycol (3 M), and 2.4 g/L HEPES in a Euro-Collins solution. DMSO is used as a based solution. DP6 is a cryopreservation cocktail that has drawn significant interest in recent years for the application of cryopreservation by vitrification. In general, DP6 is less toxic than DMSO in concentrations favorable to glass formation in large systems [34]. Very recently, DP6 has been further examined in conjunction with a battery of synthetic ice modulators (SIMs), which are compounds that influence the formation and growth of ice nuclei by various purported mechanisms [39]. In general, SIMs facilitate vitrification at reduced cooling rates, thereby lessening thermo-mechanical effects and reducing the risk to fracture [20]. The current feasibility study focuses on cryoprotective agents in the absence of biological material and SIMs.
Thermal protocol
Consistent with previous studies [20,22,34,37], the thermal protocol in the current study comprises of four phases with respect to the cooling chamber temperature as the controlled variable:
Precooling in order to reduce condensation and frost on the optical equipment during experimentation. Precooling the system to an initial temperature, T0, in the range of 5°C to 10°C was found adequate. Loading the sample onto the experimental stage and placing the scanning cryomacroscope on top on the cooling chamber is done at the end of this phase.
Cooling the specimen to the storage temperature. The viscosity of the vitrifying material increases exponentially with the decreasing temperature [11]. With the increasing viscosity, the typical time scale for crystal growth increases, while the cooled sample gradually gains solid-like properties. To facilitate vitrification, the sample is initially cooled at a high rate, H1, down to an intermediate temperature T1 (typically 20°C above the glass-transition temperature). To reduce the likelihood of structural damage, the sample is subsequently cooled at a much lower rate, H2, down to the storage temperature, Ts, which is below the glass-transition temperature, Tg. Selected values are listed in Table 1.
Storage in the current study is limited to the time, ts, that is required for the specimen to reach thermal equilibrium at Ts. In practice, this time period may remain undetermined.
Rewarming is accomplished in two steps from similar considerations that dictate the two-step cooling in phase (ii). Initial warming is performed at a slow rate, H3, to an intermediate temperature, T3, followed by a much higher rate, H4, back to room temperature.
Table 1.
| CPA | Figure | T0, °C | H1, °C/min | T1, °C | H2, °C/min | Ts, °C | ts, s | ≈ Tg, °C | H3, °C/min |
|---|---|---|---|---|---|---|---|---|---|
| 2M DMSO | 6(a) and 7(a) | 10 | −5 | N/A | N/A | −25 | 79 | N/A | +10 |
| 6M DMSO | 6(b) and 7(b) | 10 | −50 | N/A | N/A | −140 | 167 | −131 [40] −132.5 [41] |
+10 |
| 6M DMSO | 6(c) and 7(c) | 5 | −5 | −100 | −1 | −135 | 0 | −131 [40] −132.5 [41] |
+5 |
| 6M DMSO | 6(d) and 7(d) | 10 | −50 | N/A | N/A | −150 | 468 | −131 [40] −132.5 [41] |
+14* |
| 7.05M DMSO | 8 | 10 | −50 | N/A | N/A | −150 | 391 | −130 [40] | +5 |
| DP6 | 9(a) | 10 | −15 | N/A | N/A | −135 | 202 | −119 [20] | +13* |
| 6M DMSO | 9(b) | 10 | −50 | N/A | N/A | −150 | 193 | −131 [40] −132.5 [41] |
+10 |
| 6M DMSO | 10 | 10 | −50 | N/A | N/A | −150 | 372 | −131 [40] −132.5 [41] |
+10 |
Average value
For the materials under investigation, H1, H2, H3, and H4, are typically of the order of 101°C/min, 100°C/min, 100°C/min, and 102°C/min, respectively. Here, H1 and H4 are desired to exceed the so-called critical cooling and rewarming rates as measured with differential scanning calorimetery (DSC). At a cooling rate of 1°C/min, the typical temperature non-uniformity within the 4.5 mL cuvette used in the current study is less than the uncertainty in measurements, which is ±0.5°C for the specific T-type thermocouples. At a maximum chamber cooling rate of 50°C/min, the actual cooling rate measured at the center of the cuvette (the slowest responding point) was found to be 27±3°C/min, while the maximum temperature non-uniformity within the cuvette was found to be 34±3°C. For a more moderate cooling rate of 10°C/min, the maximum cooling rate at the slowest responding point was found to be 7±1°C/min with a maximum temperature non-uniformity of 16±2°C. Larger specimens are expected to experience a wider variation of cooling rates and more significant temperature non-uniformities, which signifies some of the difficulties in vitrification of large size specimens.
4. Results and Discussion
This study presents representative effects of vitrification, crystallization, thermal contraction, and fracturing. Examples are drawn from experiments on a range of DMSO solution concentrations and the cryoprotective cocktail DP6, as listed in Table 1. For the purpose of experimental investigation, also displayed are the thermal history of the cooling chamber (the controlled variable), the thermal history of the immersed thermocouple (Fig. 3(b)), and the chamber thermal history for each example.
In the scope of evaluating the capabilities of the scanning cryomacroscope, the current study includes: demonstration of physical effects (section 4.1), effects of dissolved air on crystallization (section 4.2), the propensity for fracture (section 4.3), effects of crystallization above the critical cooling rate for vitrification (section 4.4), and the corresponding comparison of DP6 with 6M DMSO. Along this line of investigation, Table 2 lists a summary of experimental parameters from 35 experiments on DP6 and 6M DMSO.
Table 2.
Summary of a selected set of experiments on DP6 and 6M DMSO, at a cooling rate of 50°C/min from room temperature down to the storage temperature, Ts. PFTC refers to removing dissolved gasses by a freeze-thaw cycle before actual experimentation, C refers to an observation of crystallization during cooling, and F refers to fracture formation, either during cooling or at the onset of rewarming.
| No. | CPA | PFTC | Ts, °C | C | F |
|---|---|---|---|---|---|
| 1 | DP6 | −130 | |||
| 2 | DP6 | −130 | + | ||
| 3 | DP6 | −130 | + | ||
| 4 | DP6 | −130 | + | ||
| 5 | DP6 | −130 | + | + | |
| 6 | DP6 | −150 | + | + | |
| 7 | DP6 | −160 | + | ||
| 8 | DP6 | −160 | + | + | |
| 9 | DP6 | −160 | + | + | |
| 10 | DP6 | −160 | + | + | |
| 11 | DP6 | −160 | + | + | |
| 12 | DP6 | + | −130 | ||
| 13 | DP6 | + | −130 | ||
| 14 | DP6 | + | −130 | ||
| 15 | DP6 | + | −130 | ||
| 16 | DP6 | + | −130 | ||
| 17 | DP6 | + | −130 | ||
| 18 | DP6 | + | −130 | + | |
| 19 | DP6 | + | −150 | + | |
| 20 | DP6 | + | −150 | + | |
| 21 | DP6 | + | −150 | + | |
| 22 | DP6 | + | −150 | + | + |
| 23 | DP6 | + | −150 | + | |
| 24 | DP6 | + | −150 | + | |
| 25 | DP6 | + | −160 | + | |
| 26 | DP6 | + | −160 | + | |
| 27 | DP6 | + | −160 | + | |
| 28 | DP6 | + | −160 | + | |
| 29 | 6M DMSO | −150 | + | + | |
| 30 | 6M DMSO | −150 | + | ||
| 31 | 6M DMSO | + | −135 | + | |
| 32 | 6M DMSO | + | −150 | + | |
| 33 | 6M DMSO | + | −150 | + | + |
| 34 | 6M DMSO | + | −150 | + | + |
| 35 | 6M DMSO | + | −150 | + | + |
4.1. Visualization of Physical Effects
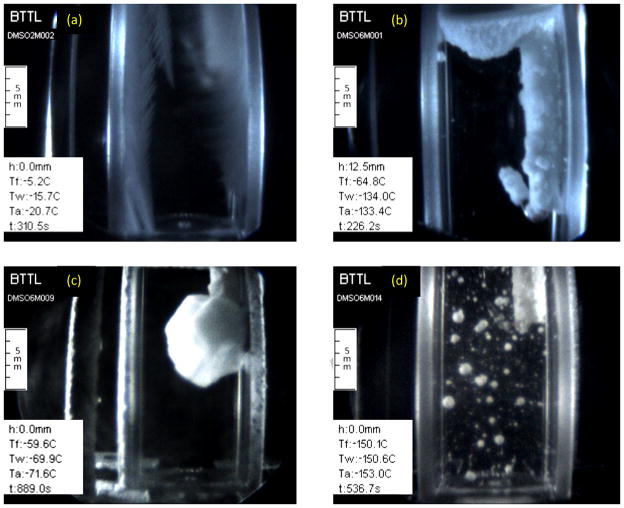
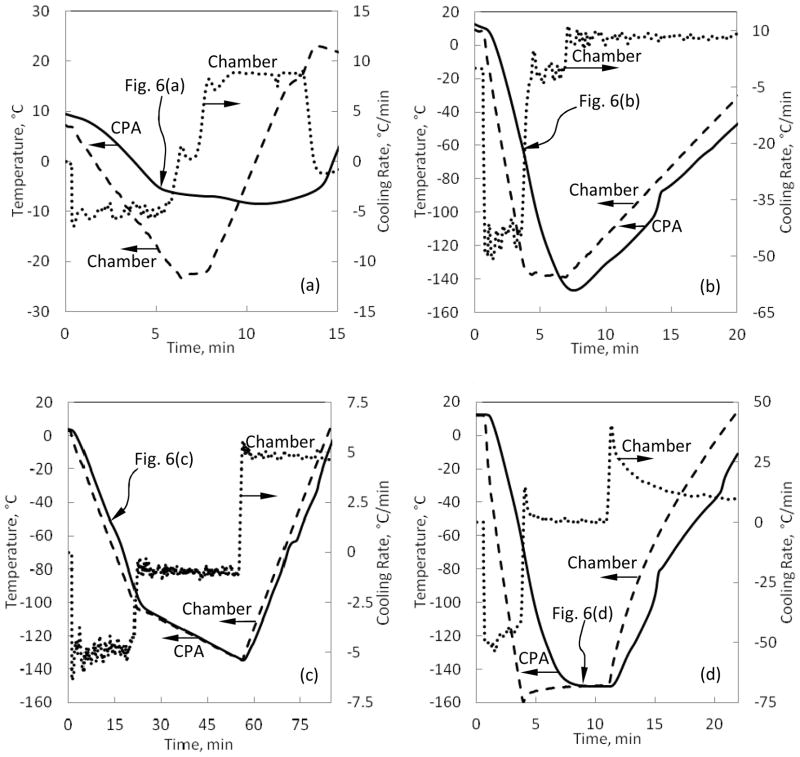
Figure 6 displays examples of crystallization events, while Fig. 7 displays the corresponding thermal history for each experiment. Figure 6(a) displays the formation of dendrites in a 2M DMSO sample at a relatively low cooling rate of 5°C/min. These dendrites formed first on the cuvette walls, when the walls reached a temperature of −8°C, and progressed inwards as the cooling process progressed—virtually marking the −8°C isothermal curved surface with their tips. While Rasmussen and MacKenzie [40] identified the freezing point of 2M DMSO as −4°C, the lower temperature observed here may be associated with deviation from thermal equilibrium conditions. Repeated experiments displayed longer dendrites at lower cooling rates. While 2M DMSO may be considered for classical cryopreservation applications, it is impossible to achieve vitrification of 2M DMSO in cooling rates relevant to cryopreservation of large-size specimens—the cooling rates achieved with the current controlled-rate cooler.
Figure 6.
Examples of various crystallization modes recorded with the scanning cryomacroscope: (a) formation of dendrites in 2M DMSO at a cooling of 5°C/min; (b) crystal formation as a result of heterogeneous nucleation along solid surfaces and liquid-air interface in 6M DMSO, cooled at rate of 50°C/min; (c) formation of a single crystal around the thermocouple in 6M DMSO subject to a cooling rate of 5°C/min (a rare event); and, (d) crystals formed as a result of homogenous nucleation, trapped in a vitrified domain of 6M DMSO which was cooled at a rate of 50°C/min.
Figure 7.
Corresponding thermal histories for the experiments presented in Fig. 6.
Figure 6(b) displays heterogeneous nucleation in 6M DMSO on solid surfaces (the cuvette walls and the thermocouple holder) and at the interface between the sample and the surrounding air. At the air interface, crystal formation may be promoted by frozen moisture from the air, local concentration gradients across this surface, and effects of surface tension. As the cooling process progresses, these crystals continue to grow inwards, but may eventually be arrested by the increasing viscosity of the sample [11]. Figure 6(b) was captured when the CPA thermocouple measured a temperature of −64.8°C, where ice formation is practically arrested around −90°C for 6M DMSO due to viscosity effects and the cooling rates reported in the current study. The onset of crystallization at the thermocouple tip was observed at −55°C in this experiment. Figure 6(c) displays heterogeneous nucleation and growth of a single large crystal around the thermocouple tip, subject to a very low cooling rate for 6M DMSO of 5°C/min. Such a formation of a single crystal was found as a rare event. The homogeneous nucleation in Fig. 6(c) was only observed at −70°C, whereas heterogeneous nucleation was first observed at −45°C, as measured by the fluid sample thermocouple. Here again, the freezing point near thermal equilibrium conditions is −33°C for 6M DMSO [40], while the crystallization effect was first observed only at −45°C with the scanning cryomacroscope, with the difference attributed to the kinetics of ice formation.
Figure 6(d) displays crystals trapped in an otherwise vitrified medium of 6M DMSO. The crystals form spontaneously throughout the domain, with crystals near the thermocouple forming at a measured temperature of −51°C. Figure 6(d) was captured when the temperature sensor measured −150.1°C, which is between 17.6°C and 19.1°C below the glass transition temperature for this solution based on DSC analysis in different studies [40, 41], with reported glass transition temperatures of −131°C and −132.5°C, respectively. Note the significant difference in cooling rate between the chamber and the immersed thermocouple in Fig. 7(d), which emphasizes the need for a 3D thermal history analysis when volumetric effects are analyzed. This analysis is a matter of a parallel study in the context of cryobiology effects.
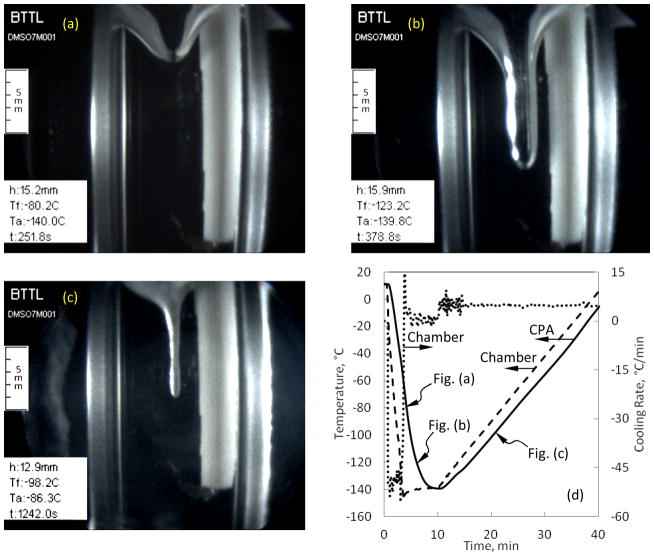
Figure 8 displays a dramatic sample deformation at the sample-air interface, which is the consequence of thermal contraction in the sample (7.05M DMSO) and of the container. During the inwards cooling process, the viscosity in the outer CPA region increases first, which hampers the ability of the material to flow and comply with volumetric changes. Simultaneously, both the sample and the container continue to contract—the CPA more than the cuvette material, regardless of whether the cuvette is made of plastic or quartz (the tested materials in the current study). Since the sample material at the center of the cuvette is more compliant, the sample interface more easily deforms there, resulting in a cavity-like interface shape. Figure 8(a) displays the beginning of cavity formation during cooling, Fig. 8(b) displays that cavity after the sample has vitrified and the cavity growth is halted, and Fig. 8(c) displays the disappearance of the cavity during rewarming. The formation of the cavity is related to the thermo-mechanical forces acting on the vitrified sample. The cavity shape may be a source for stress concentrations in the glassy state and, hence, this effect calls for a detailed thermo-mechanical stress analysis (the subject matter of a parallel study). Other stress concentration effects in the glassy state are demonstrated in [35].
Figure 8.
Examples of cavity formation at the surface of a 7M DMSO sample brought to storage temperature at an average cooling rate of 50°C/min and rewarmed at an average rate of 5°C/min: (a) initial surface deformation, (b) cavity shape in the glassy state, (c) the cavity gradually disappearing when the material regains its flow capability during rewarming, and (d) the corresponding thermal history in the sample.
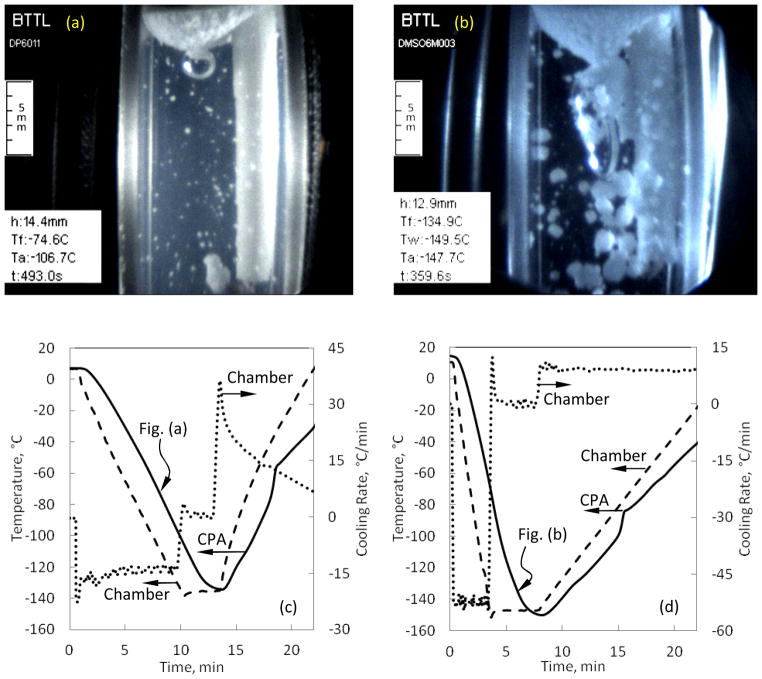
Figure 9(a) displays the interaction between cavity formation and crystallization in a DP6 sample. Heterogeneous crystallization at the surface of the cooled sample serves as a solid barrier, counteracting the tendency of the vitrified material to form the cavity described in the context of Fig. 8. As a result, a low hydrostatic pressure may develop below the crystallized layer at the surface. The pressure differential between the surrounding air and the free-to-flow CPA below the crystallized layer, possibly combined with additional thermo-mechanical forces, eventually results in fractures across this layer. Once fractured, air is sucked through the cracks to make the hydrostatic pressures compatible on both sides of the crystalized barrier, with the spherical bubble shown in Fig. 9(a) as a result. Also observed in Fig. 9(a) are small crystals as the result of homogeneous nucleation in the domain. Figure 9(b) displays similar results in a partially vitrified 6M DMSO sample, where the fluid thermocouple reads between 2.4°C and 3.9°C below the glass transition temperature [40, 41], indicating that both the air bubble and the large crystals are trapped in a vitrified medium.
Figure 9.
Examples of partial crystallization due to homogeneous nucleation in the volume, heterogeneous nucleation at the sample-air interface, and its effect on cavity formation in (a) DP6 and (b) 6M DMSO; the corresponding thermal histories are displayed in (c) and (d).
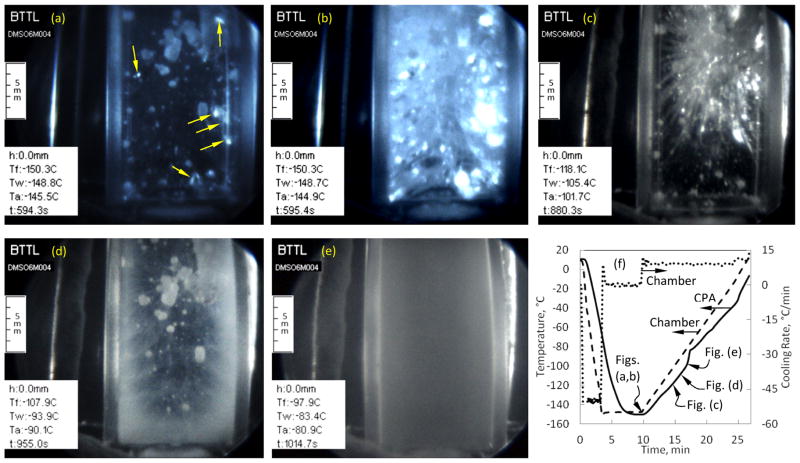
Figure 10 illustrates the challenges in vitrification, where more than one adverse effect coexists. Figure 10(a) displays sporadic crystals trapped within a vitrified domain (below the glass transition temperature), and heterogeneous nucleation on the thermocouple, which started at −44°C measured by the CPA thermocouple. In addition, Fig. 10(a) displays small fractures (indicated by arrows), which started to appear 20 s past the beginning of the rewarming phase. Figure 10(b) displays a dense fracture network 1.1 s later in the same experiment, with the rapid progression of fracturing typical to a highly fragile material. Figure 10(c) displays the disappearance of fractures due to either melting of the fractured area or molten CPA flowing into the voids between the fracture walls. This fracture-disappearing effect began at a temperature of −125°C at the walls and ended at temperature of −108°C at the CPA thermocouple. Figure 10(d) displays the effect of RPC, beginning near the wall at −98°C. The RPC pattern in Fig. 10(d) correlates well with the previously observed fracture pattern at the same location, confirming a previous observation that the fracture walls may serve as nucleation sites [22]. An additional effect occurring during the particular experiment but not displayed here is RPC in the form of large isolated crystals on the thermocouple and its holder. Figure 10(e) displays a completely opaque sample due to RPC, when the wall temperature surpassed −85°C during rewarming.
Figure 10.
Combined adverse effects to cryopreservation captured in a single protocol on 6M DMSO: (a) homogeneous crystallization in a vitrified domain at the onset of fracturing (fractures are pointed by arrows) at the early stage of rewarming, (b) a dense fractures network 1.1 s after the pervious image, (c) disappearance of fractures due to either melting of the fractured areas or molten CPA flowing into the voids between fracture walls, (d) RPC correlating with the previously observed fractures at the same location, (e) opacity due to RPC, and (f) the corresponding thermal history in the sample.
CPA cocktails containing mixtures of solutions, such as DP6, have recently gained widespread interest in the cryobiology community due to their reduced toxicity compared with single-ingredient CPAs, while maintaining similar glass-forming potential at cooling rates relevant to vitrification of large specimens [42]. However, it has been reported in the literature that cooling DP6 at rates faster than the critical cooling rate does not necessarily guarantee complete vitrification in large-size samples [20]. This inconsistency has been attributed to (i) the probabilistic nature of crystallization, (ii) the difficulty in removing nucleation sources from large volumes, (iii) the fact that the critical cooling rate is typically measured on micro-samples of a DSC setup whereas the current study investigates macro-samples, and (iv) due to uncertainties associated with experimentation such as the quality of the cocktail ingredients and accuracy in thermocouple measurements [20].
4.2. The Effect of Dissolved Gas on Crystallization
The critical cooling rate of DP6 is 40°C/min [20] as measured by DSC, while the applied cooling rate for all reported experiments in Table 2 is 50°C/min down to a storage temperature below the glass transition temperature. In some experiments the tested solutions were exposed to a prior freezing thawing cycle (PFTC) before the actual experimentation in an effort to remove dissolved gasses. Otherwise nucleated gas bubbles were observed towards the end of the thawing phase in each experiment. It can be seen from Table 2 that when PFTC was applied on DP6, only three out of 17 experiments displayed crystallization during cooling (18%). However, crystallization was observed during cooling in 9 out of 11 experiments (82%) under the same conditions when PFT was not applied. The corresponding cooling rate of 50°C/min is 10°C/min higher than the critical cooling rate measured for micro-samples [20]. It follows that dissolved gasses may trigger crystallization in DP6 during cooling. It is likely that as the temperature decreases, the ability of the CPA cocktail to dissolve gases decreases, and the released micro bubbles serve as nucleators. Note that the PFTC was not able to prevent crystallization in all cases, indicating that other crystallization-promoting effects are also acting in vitrification on large samples.
4.3. Storage Temperature and Tendency to Fracture
It is well understood that thermal-stresses may develop during vitrification due to differential thermal expansion, with fractures as the most dramatic outcome [7,13,22]. To alleviate the harmful consequences of thermal stress, it is commonly accepted that a storage temperature, Ts, slightly below the glass transition is preferable. It can be seen from Table 2 that the fracture rate for DP6 was 12% for Ts = −130°C, 71% for Ts = −150°C, and 100% for Ts = −160°C. Results on 6M DMSO display a similar trend. By no means is this section aimed at providing a comprehensive view on the tendency to fracture as a function of thermal history, but only to provide evidence of physical events observed with the scanning cryomacroscope. Of course, variation in the thermal protocol may reduce or increase the potential to structural damage, but the above structural damage rate refers to the same cooling rate and, hence, supports the general motivation for cryogenic storage near glass transition temperature.
4.4. Crystallization above the Critical Cooling Rate Measured by DSC
6M DMSO has been used as a reference solution for DP6 for the purpose of solid mechanics analysis [9], as both solutions have the same total solute concentration on a weight basis (45% w/w). The critical cooling rate of 6M DMSO is 14±3°C/min, based on DSC studies by Boutron et al. [43], and is 19.5°C/min according to calculations by Sutton [44]. While the 6M DMSO experiments listed Table 2 were performed at rates significantly higher than these reported critical values, noticeable crystallization has been observed in all seven experiments, with Fig. 9(b) as an example. Boutron and Kauffman [45] reported on a similar discrepancy in X-ray diffraction experiments, where a bulky 6M DMSO sample demonstrated crystallization at even higher cooling rates, in the range of 300°C/min and 500°C/min. Hey and MacFarlane [41] proposed that this inconsistency could be partially attributed to differences in surface-area-to-volume ratio between the thin-film sample used for DSC analysis and the bulk-media used in the X-ray diffraction experiment. Baudot and co-workers [43] suggested that this discrepancy could also be attributed to variations in container materials between the two sets of experiments. Yinnon and Uhlmann [46] demonstrated that the critical cooling rate can be greatly altered in the presence of heterogeneous nucleators, with dependency on the contact angle formed between the nucleator and the supercooled liquid [41].
Although the solute concentration on a weight basis is the same in 6 M DMSO and DP6, the molecular structure of the DMSO-water mixture is different than the DMSO-propylene glycol cocktail (DP6), which may affect the propensity for heterogeneous nucleation. In larger and unsealed samples, it may be more difficult to keep nucleators away from contaminating the solution, with dissolved gases and dust as examples. Either way, results in the current study reaffirm the need for cryomacroscopy, as DSC results on thin films cannot be simply translated to large-size specimens. The current size limitation in identifying small crystals is related to the cryomacroscope camera resolution, with each pixel equivalent to 15 μm × 15 μm area at the mid-plane of the specimen. Alternative methods are now being investigated to improve the imaging capabilities.
4.5. Analysis of Large-Scale Cryopreservation – Beyond Cryomacroscopy
Cryomacroscopy is aimed at in situ visualization of physical events during vitrification. In particular, the current study demonstrates the feasibility of creating an integrated movie of the cryopreservation protocol while scanning large objects. Unfortunately, cryomacroscopy is limited by visible light transparency. With the increasing interest in large-scale cryopreservation for transplantation and regenerative medicine, and with recent developments of new and more favorable CPA cocktails, there is an increased unmet need for new non-invasive evaluation tools.
Future development of analysis tools may take various paths, all envisioned to be integrated with cryomacroscopy by the current research team. One possibility is to develop an electrical impedance tomography (EIT) [47] tool to trace frozen region growth within an opaque domain. The EIT could be integrated with the cryomacroscopy setup with minimal modifications. An additional possibility is the application of X-ray computerized tomography (CT) [48] to the study of vitrification. While CT represents an excellent possibility to trace crystallization and fracturing in an opaque domain, it presents new challenges associated with in situ investigation in practical conditions within a commercially available cooling chamber.
5. Conclusions
A new cryomacroscope prototype is presented in the current study for the analysis of cryopreservation by vitrification in large-size samples. The new prototype represents an improvement over previous generations of cryomacroscopes in scanning capability, imaging quality, data logging, computer control, and usability as an add-on unit on commercially available controlled-rate coolers. Proprietary software has been developed, having two primary functionalities: (i) system control and experimental data streamlining, and (ii) generation of a single digital movie with all experimental data overlaid.
This study demonstrates visualization of vitrification, crystallization, thermal contraction, and fracturing. Examples were withdrawn from experiments on a range of DMSO solution concentrations and the cryoprotective cocktail DP6. In particular, this study demonstrates that crystallization may form: (i) along the container walls, (ii) at the sample-air interface, (iii) on fracture walls, and (iv) on nucleated bubbles originated from previously dissolved gases. This study demonstrates qualitatively that the decreased storage temperature may increase the likelihood to fracture, while a quantitative analysis of thermo-mechanical stress is the subject matter of a parallel study. Finally, the current study demonstrates that crystallization may be feasible even at cooling rates higher than the critical value measured by DSC. Hence, while thermal protocol design can rely on theoretical considerations and DSC measurements, cryomacroscopy means are essential in verifying the protocol outcome at each step, as well as to inspect the quality of the cryopreserved product.
Highlights.
A new cryomacroscope prototype is presented, which is a visualization device for in situ evaluation of cryopreserved biological specimens.
A scanning mechanism is integrated into the new design with applications to large-scale cryopreservation.
This study includes software development to control the cryomacroscopy during experimentation and to post-process a single digital movie of an experimental investigation, with all relevant data overlaid.
Demonstrated effects in this study include glass formation, various regimes of crystallization, thermal contraction, and fracture formation.
The new design is compatible with commercially available top-loading controlled-rate cooling chambers.
Acknowledgments
This project has been supported by Award Number R21RR026210 from the National Center for Research Resources (NCRR), and Award Number R21GM103407 from the National Institute of General Medical Sciences (NIGMS).
Footnotes
The content is solely the responsibility of the authors and does not necessarily represent the official views of the National Institutes of Health.
Publisher's Disclaimer: This is a PDF file of an unedited manuscript that has been accepted for publication. As a service to our customers we are providing this early version of the manuscript. The manuscript will undergo copyediting, typesetting, and review of the resulting proof before it is published in its final citable form. Please note that during the production process errors may be discovered which could affect the content, and all legal disclaimers that apply to the journal pertain.
References
- 1.Muldrew K, Acker J, Elliot J, McGann L. The water to ice transition: implications for living cells. In: Fuller B, Lane N, Benson E, editors. Life in the Frozen State. New York: CRC Press; 2004. pp. 67–103. [Google Scholar]
- 2.Wolfe J, Bryant G. Cellular cryobiology: thermodynamic and mechanical effects. International Journal of Refrigeration. 2001;23:438–450. [Google Scholar]
- 3.Mazur P. Principles of Cryobiology. In: Fuller B, Lane N, Benson E, editors. Life in the Frozen State. New York: CRC Press; 2004. pp. 3–67. [Google Scholar]
- 4.Meryman H. Cryoprotective Agents. Cryobiology. 1971;8:173–183. doi: 10.1016/0011-2240(71)90024-1. [DOI] [PubMed] [Google Scholar]
- 5.Brockbank KG, Taylor MJ. Tissue Preservation. In: Baust JG, Baust JM, editors. Advances in Biopreservation. Ch 8. Boca Raton: CRC – Taylor &Francis; 2006. pp. 157–196. [Google Scholar]
- 6.Fahy G. The relevance of cryoprotectant “toxicity” to cryobiology. Cryobiology. 1986;23:1–13. doi: 10.1016/0011-2240(86)90013-1. [DOI] [PubMed] [Google Scholar]
- 7.Rabin Y, Steif PS. Solid mechanics aspect of cryobiology. In: Baust JG, Baust JM, editors. Advances in Biopreservation. Chap. 13. CRC Taylor & Francis; 2006. pp. 359–382. [Google Scholar]
- 8.Rabin Y, Taylor MJ, Wolmark N. Thermal expansion measurements of frozen biological tissues at cryogenic temperatures. ASME Journal of Biomechanical Engineering. 1998;120(2):259–266. doi: 10.1115/1.2798310. [DOI] [PubMed] [Google Scholar]
- 9.Plitz J, Rabin Y, Walsh J. The effect of thermal expansion of ingredients on the cocktails VS55 and DP6. Cell Preservation Technology. 2004;2(3):215–226. [Google Scholar]
- 10.Jimenez Rios JL, Rabin Y. Thermal expansion of blood vessels in low cryogenic temperatures, Part II: Measurements of blood vessels vitrified with VS55, DP6, and 7.05M DMSO. Cryobiology. 2006;52(2):284–294. doi: 10.1016/j.cryobiol.2005.12.006. [DOI] [PMC free article] [PubMed] [Google Scholar]
- 11.Noday DA, Steif PS, Rabin Y. Viscosity of cryoprotective agents near glass transition: a new device, technique, and data on DMSO, DP6, and VS55. Journal of Experimental Mechanics. 2009;49(5):663–672. doi: 10.1007/s11340-008-9191-8. [DOI] [PMC free article] [PubMed] [Google Scholar]
- 12.Steif P, Noday D, Rabin Y. Can thermal expansion differences between cryopreserved tissue and cryoprotective agents alone cause cracking? Cryo Letters. 2009;29(6):414–21. [PMC free article] [PubMed] [Google Scholar]
- 13.Steif PS, Palastro MC, Rabin Y. The effect of temperature gradients on stress development during cryopreservation via vitrification. Cell Preservation Technology. 2007;5(2):104–115. doi: 10.1089/cpt.2007.9994. [DOI] [PMC free article] [PubMed] [Google Scholar]
- 14.Rabin Y, Steif PS, Taylor MJ, Julian TB, Wolmark N. An experimental study of the mechanical response of frozen biological tissues at cryogenic temperatures. Cryobiology. 1996;33:472–482. doi: 10.1006/cryo.1996.0048. [DOI] [PubMed] [Google Scholar]
- 15.Rabin Y, Olson P, Taylor MJ, Steif PS, Julian TB, Wolmark N. Gross damage accumulation in frozen rabbit liver due to mechanical stress at cryogenic temperatures. Cryobiology. 1997;34:394–405. doi: 10.1006/cryo.1997.2010. [DOI] [PubMed] [Google Scholar]
- 16.Luyet BJ. The vitrification of organic colloids and of protoplasm. Biodynamica. 1937;1:1–14. [Google Scholar]
- 17.Luyet BJ, Gehenio PM. Biodynamica: Normandy, MO. 1940. Life and Death at Low Temperatures. [Google Scholar]
- 18.Fahy G, MacFarlane D, Angell C, Meryman H. Vitrification as an approach to cryopreservation. Cryobiology. 1984;21:407–425. doi: 10.1016/0011-2240(84)90079-8. [DOI] [PubMed] [Google Scholar]
- 19.Taylor M, Song Y, Brockbank K. Vitrification in tissue preservation: New developments. In: Fuller B, Lane N, Benson E, editors. Life in the Frozen State. New York: CRC Press; 2004. pp. 603–641. [Google Scholar]
- 20.Rabin Y, Taylor MJ, Walsh JR, Baicu S, Steif PS. Cryomacroscopy of vitrification, Part I: A prototype and experimental observations on the cocktails VS55 and DP6. Cell Preservation Technology. 2005;3(3):169–183. doi: 10.1089/cpt.2005.3.169. [DOI] [PMC free article] [PubMed] [Google Scholar]
- 21.Pegg DE, Wusteman MC, Boylan S. Fractures in Cryopreserved Elastic Arteries. Cryobiology. 1997;34:183–192. doi: 10.1006/cryo.1996.1997. [DOI] [PubMed] [Google Scholar]
- 22.Steif PS, Palastro M, Wen CR, Baicu S, Taylor MJ, Rabin Y. Cryomacroscopy of vitrification, Part II: Experimental observations and analysis of fracture formation in vitrified VS55 and DP6. Cell Preservation Technology. 2005;3(3):184–200. doi: 10.1089/cpt.2005.3.184. [DOI] [PMC free article] [PubMed] [Google Scholar]
- 23.Rabin Y, Steif PS. Thermal stresses in a freezing sphere and its application to cryobiology. ASME Journal of Applied Mechanics. 1998;65(2):328–333. [Google Scholar]
- 24.Luyet B, Rapatz G. An automatic regulated refrigeration system for small laboratory equipment and a microscope cooling stage. Biodynamica. 1957;7:337–345. [PubMed] [Google Scholar]
- 25.Diller KR, Cravalho EG. A Cryomicroscope for the Study of Freezing and Thawing Processes in Biological Cells. Cryobiology. 1970;7:91–199. doi: 10.1016/0011-2240(70)90021-0. [DOI] [PubMed] [Google Scholar]
- 26.Menz JJ, Luyet BJ. A study of the lines of fracture observed in freeze-drying of aqueous solutions crystallized into spherulites. Biodynamica. 1965;9:265–275. [PubMed] [Google Scholar]
- 27.Kroener C, Luyet BJ. Formation of cracks during the vitrification of glycerol solutions and disappearance of the cracks during rewarming. Biodynamicca. 1966;10:47–52. [PubMed] [Google Scholar]
- 28.Stott SL, Karlsson JOM. Visualization of intracellular ice formation using high-speed video cryomicroscopy. Cryobiology. 2009;58:84–95. doi: 10.1016/j.cryobiol.2008.11.003. [DOI] [PubMed] [Google Scholar]
- 29.Spindler R, Rosenhahn B, Hofmann N, Glasmacher B. Video analysis of osmotic cell response during cryopreservation. Cryobiology. 2012;64:250–260. doi: 10.1016/j.cryobiol.2012.02.008. [DOI] [PubMed] [Google Scholar]
- 30.Toner M, Cravalho E, Karel M, Armant D. Cryomicroscopic analysis of intracellular ice formation during freezing of mouse oocytes without cryoadditives. Cryobiology. 1991;27:55–71. doi: 10.1016/0011-2240(91)90008-c. [DOI] [PubMed] [Google Scholar]
- 31.Fahy GM, Saur J, Williams JR. Physical problems with the vitrification of large biological systems. Cryobiology. 1980;27:492–510. doi: 10.1016/0011-2240(90)90038-6. [DOI] [PubMed] [Google Scholar]
- 32.http://www.andrew.cmu.edu/user/yr25/CryomacroscopyImages01.htm
- 33.Baicu S, Taylor MJ, Chen Z, Rabin Y. Vitrification of carotid artery segments: An integrated study of thermophysical events and functional recovery towards scale-up for clinical applications. Cell Preservation Technology. 2006;4(4):236–234. doi: 10.1089/cpt.2006.9994. [DOI] [PMC free article] [PubMed] [Google Scholar]
- 34.Baicu S, Taylor MJ, Chen Z, Rabin Y. Cryopreservation of carotid artery segments via vitrification subject to marginal thermal conditions: Correlation of freezing visualization with functional recovery. Cryobiology. 2008;58:1–8. doi: 10.1016/j.cryobiol.2008.03.002. [DOI] [PMC free article] [PubMed] [Google Scholar]
- 35.Rabin Y, Steif PS, Hess KC, Jimenez-Rios JL, Palastro MC. Fracture formation in vitrified thin films of cryoprotectants. Cryobiology. 2006;53:75–95. doi: 10.1016/j.cryobiol.2006.03.013. [DOI] [PMC free article] [PubMed] [Google Scholar]
- 36.http://www.andrew.cmu.edu/user/yr25/CryomacroscopyImages02/index.htm
- 37.Rabin Y, Taylor MJ, Feig JSG, Baicu S, Chen Z. A new cryomacroscope device (Type III) for visualization of physical events in cryopreservation with applications to vitrification and synthetic ice modulators. Cryobiology. 2013;67(3):264–73. doi: 10.1016/j.cryobiol.2013.08.005. [DOI] [PMC free article] [PubMed] [Google Scholar]
- 38.Manik NB, Basu AN, Mukherjee SC. Characterization of the photodetector and light emitting diode at above liquid nitrogen temperature. Cryogenics. 2000;40:341–344. [Google Scholar]
- 39.Eisenberg DP, Taylor MJ, Rabin Y. Thermal expansion of cryoprotective cocktail, DP6, combined with synthetic ice modulators in the presence and absence of biological tissues. Cryobiology. 2012;65(2):117–125. doi: 10.1016/j.cryobiol.2012.04.011. [DOI] [PMC free article] [PubMed] [Google Scholar]
- 40.Rasmussen DH, MacKenzie AP. Phase diagram for the system water-dimethylsuphoxide. Nature. 1968;220:315–317. doi: 10.1038/2201315a0. [DOI] [PubMed] [Google Scholar]
- 41.Hey JM, MacFarlane DR. Crystallization of ice in aqueous solutions of glycerol and dimethyl sulfoxide. Cryobiology. 1996;33:205–216. doi: 10.1006/cryo.1996.0021. [DOI] [PubMed] [Google Scholar]
- 42.Lawson A, Ahmad H, Sambanis A. Cytotoxicity effects of cryoprotectants as single-component and cocktail vitrification solutions. Cryobiology. 2011;62(2):115–122. doi: 10.1016/j.cryobiol.2011.01.012. [DOI] [PMC free article] [PubMed] [Google Scholar]
- 43.Baudot A, Alger L, Boutron P. Glass-forming tendency in the system water-dimethyl sulfoxide. Cryobiology. 2000;40:151–158. doi: 10.1006/cryo.2000.2234. [DOI] [PubMed] [Google Scholar]
- 44.Sutton RL. Critical cooling rates to avoid ice crystallization in solutions of cryoprotective agents. J Chemical Society Farady Trans. 1991;87:101–105. [Google Scholar]
- 45.Boutron P, Kauffman A. Stability of the amorphous state in the system-water-glycerol-dimethyl sulfoxide. Cryobiology. 1978;15:93–103. doi: 10.1016/0011-2240(78)90012-3. [DOI] [PubMed] [Google Scholar]
- 46.Yinnon H, Uhlmann DR. A kinetic treatment of glass formation V: surface and bulk heterogeneous nucleation. J Non-Crystalline Solids. 1981;44:37–55. [Google Scholar]
- 47.Otten DM, Rubinsky B. Cryosurgical monitoring using bioimpedance measurements–a feasibility study for electrical impedance tomography. IEEE Trans Biomed Eng. 2000;47(10):1376–1381. doi: 10.1109/10.871411. [DOI] [PubMed] [Google Scholar]
- 48.Bischof JC, Mahr B, Choi JH, Behling M, Mewes D. Use of X-ray tomography to map crystalline and amorphous phases in frozen biomaterials. Annals of Biomedical Engineering. 2007;35:292–304. doi: 10.1007/s10439-006-9176-7. [DOI] [PubMed] [Google Scholar]


