Abstract
Background:
Physiological functions are often assessed by standardizing for body surface area (BSA) to avoid excessive variation in calculations in pediatric practice.
Aim:
To explore the suitability of existing formulae for estimating the BSA of Nigerian children.
Subjects and Methods:
This cross-sectional study involved healthy children in a Local Government Area, Oyo State, Nigeria. The BSAs of 2745 children were calculated using the formulae by Boyd, Mosteller, Gehan and George, Haycock, and Dubois-DuBois, and the sixth arithmetic mean of these five formulae (mean-BSA) was performed. The outcome of interest was agreement between estimated BSA and mean-BSA for each method. The performance of each BSA estimation method was compared using bias, root mean square error and Bland-Altman plots of agreement.
Results:
The study participants comprised of 1229 males and 1246 females with mean (standard deviation) ages of 6.3 (3.0) years and 6.6 (3.1) years respectively (P = 0.01). Reference values for BSA estimates by gender were proposed each age group. Furthermore, BSA estimates from Boyd's and Mosteller's formulae were most similar to the mean-BSA with mathematically perfect correlations. The degree of deviation of BSA estimates from DuBois was largest with a remarkable increase at ages <6 years.
Conclusion:
Formulae by Boyd and Mosteller are the best BSA estimate for Nigerian children among the existing formulae.
Keywords: Anthropometry, Formulae, Physiological functions, Plots of agreement
Introduction
One of the most significant indices of physiological functions in pediatric practice and child health is body surface area (BSA). The determination of BSA is a necessary step in making accurate assessment of some organ functions and for making decision on many critical treatments plans. For instance, the use of BSA is preferred to the actual weight of children when standardization of physiological functions such as basal metabolic rate,[1,2] glomerular filtration rate,[3,4] cardiac index[5,6] and oxygen consumption[7] is required. BSA has better correlation with these measures of functions than weight or height. Some treatments such as drugs dosing and fluids therapy are better based on estimates of BSA than the actual weight, especially when the therapeutic index is low as in the case anticancer chemotherapy.[8,9] BSA is also recognized as a reliable predictor of treatment outcome. A small BSA is a good predictor of mortality after coronary artery bypass surgery in children.[10] It is essential that child healthcare providers are able to estimate BSA quickly and accurately in order to make correct, crucial and urgent treatment decisions.
Direct measurement of BSA by coating, surface integration and triangulation methods, previously described by Boyd,[11] is the most accurate, but it is relatively difficult, time-consuming and impracticable in a real-time clinical setting. In the alternative, formulae that utilize weight and height have been proposed for estimation of BSA. The first of these formulae was proposed in 1916 by Du Bois and Du Bois (BSA [m2] = Weight [kg]0.425 × height (cm)0.725 × 0.007184]. It is a mathematical equation derived from measurements of weight and height of only nine patients including just a child.[12,13] The few numbers of subjects, especially lack of inclusion of adequate number of children, as well as the complex nature of the equation, limit its use in all populations. Consequently, other formulae including Boyd[11] formula (BSA [m2] = Weight [kg]0.4838 × Height [cm]0.3 × 0.017827) in 1935, Haycock and Schwarz formula[14] (BSA [m2] = Weight [kg]0.5378 × Height [cm]0.3964 × 0.024265) in 1978, Gehan and George[15] formula (BSA [m2] = Weight [kg]0.51456 × Height [cm]0.42246 × 0.02350) in 1979 and Mosteller[16] formula (Height [cm] × Weight [kg]/3600)½ in 1987 were later proposed for estimation of BSA in children. Many of these formulae have been in use for decades in both developed and developing countries, but studies that have validated their uses in developing countries are limited.
It is worth noting that the proposition of successive BSA formula was based on the evidence that the previous ones were considered complex and health professionals would often require sophisticated calculator for their usage. For instance, it was the complexity of the formulae of Du Bois and Du Bois, and Haycock formulae as well as errors in the related published nomogram[17] that prompted Mosteller to develop a relatively simplified formula in 1987.[16] Mosteller formula is a modification of the BSA equation by Gehan and George.[15]
Currently, there is no standard device for direct measurement of BSA in everyday clinic consultations and emergency practices. Although measurements of BSA with high reliability and repeatability have been performed using three-dimensional scan, this technique is cumbersome, and its use in everyday clinics is impracticable. Moreover, the high cost of the scanner prohibits its use in relatively poor settings like Nigeria.[18,19,20] Thus, the choice of suitable methods and what should be regarded as normal or ideal BSA for healthy Nigerian children are still open to questioning. Since mathematical equations will yield results for almost any numbers entered into them, users of equations for calculating BSA must know the conditions for which these equations are valid. It is, therefore, important for child health practitioners in Nigeria to have evidence for the method most suitable for use and to be able to determine normal BSA for age and sex within reasonably acceptable limits. Therefore, the aim of this study was to compare BSA estimates from five common formulae in use identified from in literatures in order to ascertain the best for continued use in Nigeria. The study was also aimed at producing a table of reference values of each age group.
Subjects and Methods
Study design and setting
This cross-sectional study involved apparently well children in the communities, well-infants clinics, day-care centers and schools located in Ibadan North Local Government Area (IBNLGA), Oyo State, Nigeria. The IBNLGA is one of the five geo-political areas making up the Ibadan metropolis. It covers an area of 27 km2, and it has a population of 308,119 (2006 census). The choice of the study settings and population for the study was the convenience, based on accessibility and ease of getting healthy children to participate in the research compared to other parts of the south western Nigeria. Also, the IBNLGA is the immediate catchment area of the University College Hospital, Ibadan, Nigeria where the investigators render pediatric services.
Study population
Children aged 1-11 years were the target of this study. There were 111 immunization centers, 199 officially registered day-care/crèche, nursery and primary schools in the IBNLGA at the time of this study (January–August, 2013). All the children met at the time of visits were considered eligible to participate provided they had no recent (2 weeks) history of serious illness, signs of chronic illness or hospital admission 3 months before visits. Individuals who had any form of physical deformity (such as scoliosis or bilateral genu varum) that may introduce errors into height measurement, those who had a history of illness or hospital admissions 2 weeks prior to data collection were excluded from the study. Also, children less than a year or 10 kg were excluded because a reliable measure of height is often very challenging, and it is prone to measurement errors.
Sampling method
A two-stage random sampling technique was employed to select study centers and research participants. This involved mapping of IBNLGA into four quadrants based using the geographic map, development of sampling frames of all potential recruitment sites and random selection of participants from eight child welfare clinics/day-care centers, four private and four public primary schools.
Data collection methods
At least two visits were made to each of the selected enrolment centers. During the first visit, the health facilities were intimated about the study and children were given the information leaflets and consent forms for their parents or caregivers. During the visits after parental consent, a structured-questionnaire was used to obtain information from the parents and/or children. The age of each child was verified from the clinic, school or center record when necessary. Height and weight were measured according to standard procedures described by the World Health Organization.[21] At each enrolment site, one of the investigators and two trained assistants measured weight and height. Each child had measurements taken twice by two different individuals, and the average was calculated and taken as the correct measurement. Height/length was recorded to the nearest 0.1 cm using a stadiometer or infantometer as appropriate. The weight of each child was measured using the battery powered digital scales (Seca, Inc., Columbia, MD, USA). Weights were recorded to the nearest 0.1 kg. General physical examination was carried out in a “cubicle” or a room in each center/school.
Data analysis
The children were classified according to gender and age (in years). Mean values of BSA and its standard deviations (SDs), as well as 95% confidence intervals, were calculated for the different age and gender categories. The estimated BSA was calculated by substituting weight and height into each of the five formulae for estimating BSA. These equations were selected because they included pediatric samples and were derived in independent studies using direct methods of BSA measurement. In the absence of a gold standard for BSA against which one can determine the accuracy of any formula, the arithmetic mean of BSA of the five formulae was calculated and designated this as the “gold standard.” This mean-BSA (gold standard) is a more accurate physiologic measure of the actual BSA because the five formulae have all been derived in independent studies, and the mean of any available independent estimates is the best measure.[22] This method was also described in many previous studies.[22,23,24] The estimated BSA of subjects from each of the five formulae was then compared with the mean-BSA. The correlations of the estimated BSA values were determined using regression analyses adjusting for age (in years). The accuracy of estimated BSA from each of the five formulae was evaluated using the root mean square error (RMSE) method of prediction as described by Verbraecken et al.[24] and Krieser et al.[25] RMSE combines an assessment of both bias and spread of data. In addition, Percentage of similarity between data pairs was also used.[26]
The percentage of the similarity value between each of the five formulae and the mean-BSA was calculated as the average between estimated BSA from each of the five formulae and the mean-BSA divided by the mean-BSA and multiplied by 100. Data pairs with the same value are 100% similar. Data pairs in which estimated BSA from each of the five formulae is greater than the mean-BSA are greater than 100%; conversely, data pairs in which estimated BSA from each of the five formulae is less than the mean-BSA are <100%. Also, Bland and Altman[22] plots were used to examine the relationships between the magnitude and degree of variation in the estimated BSA from each of the five formulae and mean-BSA. Horizontal lines were drawn at the mean difference (solid line) and degree agreements called “95% limit of agreement”. These dotted lines represent the limits in which one can be 95% confident that the measurement error will be within. All statistical analysis was performed using SPSS 17.0 for Windows (SPSS Inc. IL, USA) and P < 0.05 was considered as statistically significant.
Ethical consideration
Participation in the study was completely voluntary, based on informed consent from parents/caregivers and accent from participants who were 5 years and more. Parents and caregivers of children were made to understand that they were free to withdraw their consent at any time before the end of data collection and that proper referral will be available for any child noticed to have signs of illness or alarming measurements. Privacy of participants was ensured by using a serial number on the information collected, rather than a name. Only the researchers knew the identification, and this information was not disclosed to anyone else. The study protocol was reviewed and approved by the Oyo State Ethical Review Committee, Ministry of Health, Ibadan, Nigeria (approval number: AD 13/479/315).
Results
Demographics and anthropometry of study participants
Study subjects comprised 1229 males and 1246 females with mean (SD) ages of 6.3 (3.0) years and 6.6 (3.1) years respectively (P = 0.01). Majority (81.8%; 2025/2475) of the children who participated in the study were from the Yoruba tribe of south west of Nigeria. Other tribes represented were Igbo (5.3%; 132/2475) Hausa (10.7%; 266/2475) and minority tribes (2.1%; 52/2475). Subjects’ parents were also categorized as high (5.5%; 136/2475), middle (72.5%; 1795/2475) and low (22.0%; 544/2475) socioeconomic classes. Overall, more female than male subjects had significantly higher mean (SD) weight: (21.5 [7.6] kg vs. 20.8 [6.7] kg; P = 0.02) and height: (117.4 [17.9] cm vs. 115.4 [17.9] cm; P = 0.01) but the mean (SD) body mass imaging were not significantly different, 15.1 (1.7) kg/m2 male and 15.2 (1.4) kg/m2 for female; P = 0.08.
Body surface area according to age
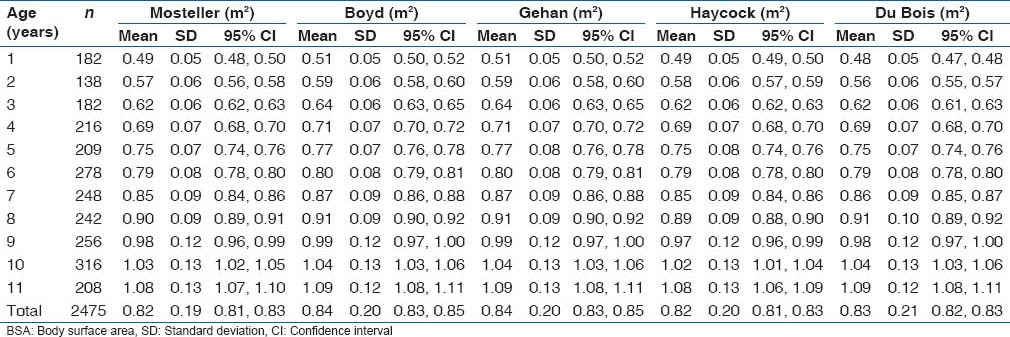
Comparisons of the mean estimated BSA using the “gold standard” by age and gender are as shown in Table 1. Though there were no statistically significant differences in the mean estimated BSA using the “gold standard” between male and female subjects, the mean estimated BSA using the “gold standard” showed an increasing trend as the age increases (F-statistics = 861.9; P < 0.001). Table 2 also shows the distribution of mean values of estimated BSA from each of the five formulae according to age. A similar increasing trend in the estimated BSA from each of the five formulae as the age increases was observed as with the estimates from the “gold standard.” It was also observed that there were no statistically significant differences among the estimated BSA from each of the five formulae for each age group.
Table 1.
Mean BSA using five formulae according to age and gender of Nigerian children
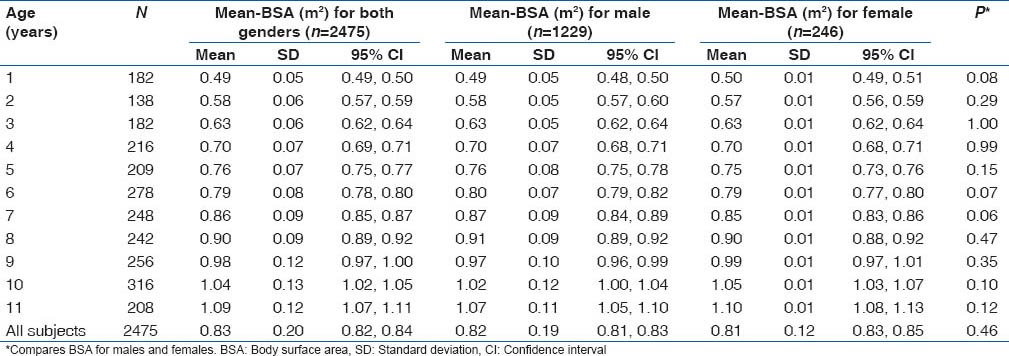
Table 2.
Mean BSA from each of the five formulae according to age and gender of Nigerian children
Correlation between body surface area from Mosteller and others
Correlation coefficient, R2 and root mean squared errors obtained from regression analyses among BSA values estimates of each of the five formulae, the “gold standard” and age (years) are as shown in Table 3. Sub-group analyses by gender are also display in Table 3. All the estimated BSA from the five formulae showed significant positive correlation with the estimates from the “gold standard” (P < 0.001 for each). In both male and female subjects, estimated BSA values from Boyd formula showed the lowest RSME, followed by those from Mosteller formula, then values from Gehan and George and Haycock while estimates from Du Bois and Du Bois had the highest RSME.
Table 3.
Accuracy of BSA values obtained with each formula compared with mean-BSA by gender among Nigerian children

Agreement of body surface areas values from five formulae compared with “gold standard”
The Bland and Altman plots for all comparisons are as shown in Figures 1-5. The pattern of bias observed in the Bland-Altman graph for Boyd [Figure 1] and Mosteller [Figure 2] formulae are similar. These two formulae produced the smallest bias and consistent from low to high values of average BSA compared with the other three formulae [Figures 3-5]. Bland-Altman graph for DuBois and Dubois [Figure 3] showed a relatively wider line of 95% limit of agreement compared with the graphs for the other four formulae [Figures 1, 2, 4 and 5]. Although the width of the lines of 95% limit of agreement for the graph obtained for Haycock [Figure 5] formula is similar to the graph for Boyd [Figure 1], Mosteller [Figure 2], and Gehan and George [Figure 4] formulae, there were more BSA estimates outside of the 95% limit of agreement in Figure 4 than others [Figures 1, 2, 3 and 5].
Figure 1.
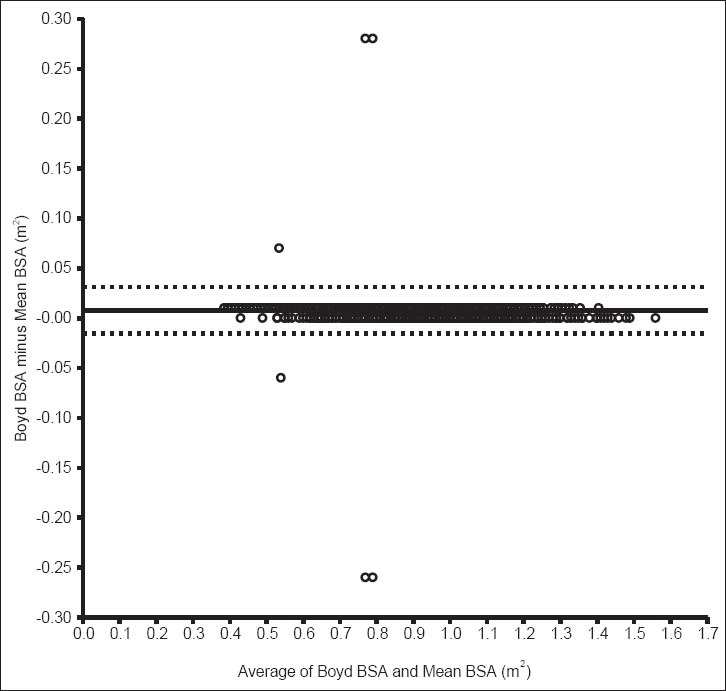
Bland–Altman bias plot for difference between estimate from Boyd formula and mean body surface area. This plot shows the mean bias (solid line) and 95% limit of agreement
Figure 5.

Bland–Altman bias plot for difference between estimate from Haycock formula and mean body surface area. This plot shows the mean bias (solid line) and 95% limit of agreement
Figure 2.
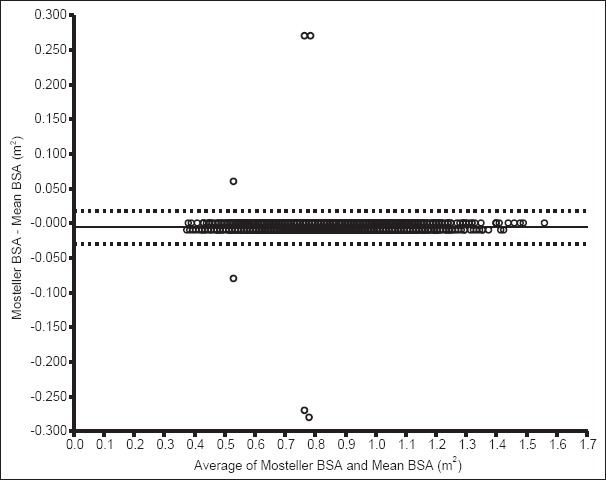
Bland–Altman bias plot for difference between estimate from Mosteller formula and mean body surface area. This plot shows the mean bias (solid line) and 95% limit of agreement
Figure 3.
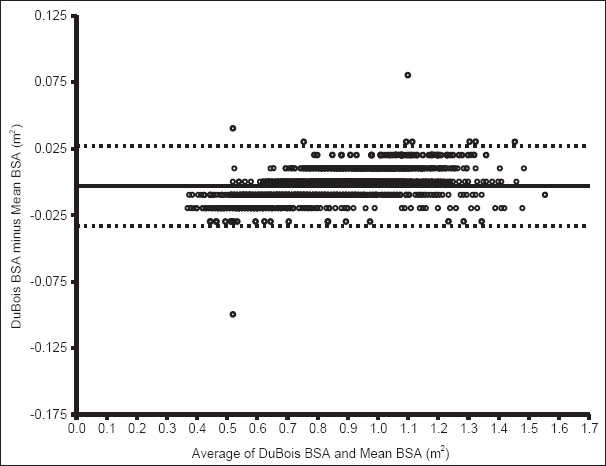
Bland–Altman bias plot for difference between estimate from Du Bois formula and mean body surface area. This plot shows the mean bias (solid line) and 95% limit of agreement
Figure 4.
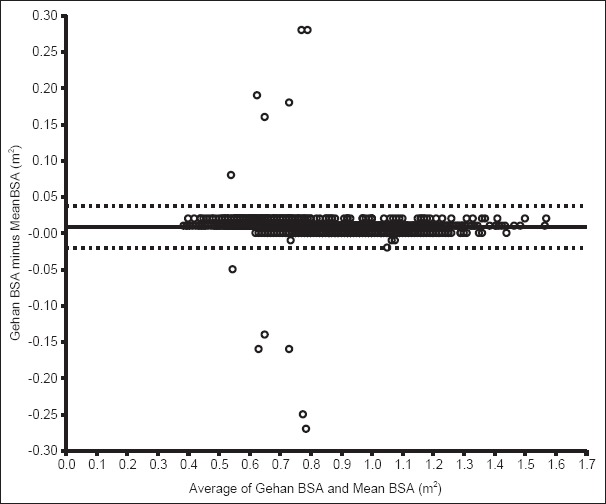
Bland–Altman bias plot for difference between estimate from Gehan formula and mean body surface area. This plot shows the mean bias (solid line) and 95% limit of agreement
Of the 2475 subjects, only 3 (0.1%) had BSA estimates outside the lines of 95% limit of agreement in the Bland-Altman graph for DuBois and Dubois [Figure 3], 6 (0.2%) each for Boyd [Figure 1] and Mosteller [Figure 2] respectively, 12 (0.5%) each for Gehan and George's formula, and Haycock's formula, respectively.
Similarity of body surface areas values from Mosteller and others
Figure 6 summarizes the percentage of similarity of each of the estimated BSA from the five formulae. These data confirm the close agreement between Mosteller's and the “gold standard” as well as its consistency in estimating BSA across the various ages (1-11 years). According to this approach, taking into account the small bias and the limits of agreement, Mosteller's formula best fits with the “gold standard.” However, DuBois and Dubois [Figure 3] demonstrated as wider deviation from the line of good similarity in ages 1 to about 6 years with a tendency to underestimate BSA, and it demonstrated fair similarity with the “gold standard” beyond age 7 years as well as the tendency to overestimate BSA.
Figure 6.
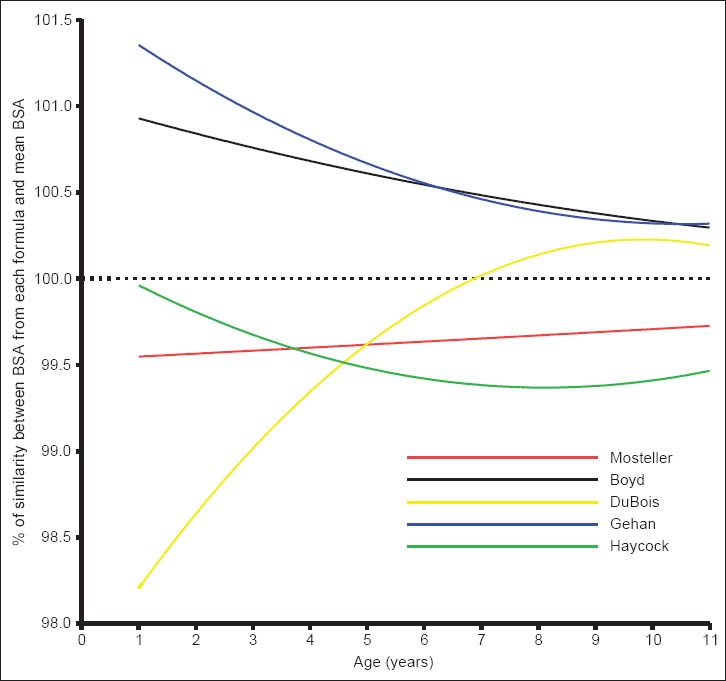
Percentage of similarity values between body surface area from each formula and mean body surface area by age of subjects. These plots show the mean bias (solid line) and 95% limit of agreement for each age
Discussion
The need to validate existing formulae for calculating BSA in the Nigerian children population and to establish reference values prompted this study. In this regard, Mosteller's and Boyd's formulae have been identified as the two most reliable methods for estimation of BSA of Nigerian children aged 1-11 years. The study also showed that the BSA values from all the five equations correlate positively with each other, and the estimated BSA values increase as age increases. Using the mean values of BSA from all the five formulae (as the gold standard), a table of reference values was generated [Table 1]. This table can be readily used in clinical settings in Nigeria, especially when time may not permit the substitution of weight and height into any of the formulae and appropriate mathematical device is not accessible.
Correct estimation of a child's BSA is a necessary step in pediatric practice, particularly the process of standardization of physiologic indices such as metabolic rate,[1,2] glomerular filtration rate,[3,4] cardiac output,[5,6] fluid and drug dosages in the critically ill. Many methods and formulae are in use but these methods are often not being accepted as a precise measurement of BSA on their own merit, rather as techniques which allow comparison between individuals. Therefore, the generation of reference values for the Nigerian children gives the benefits of saving time spent on computation, if any of the formulae were used, in emergency situations. The table of reference values generated in this study also has the potential to minimize errors that may arise from inaccurate substitution in the use of complex formulae for BSA calculation. Not only does the use table of reference dispense with the hassle of exponential complexities in formulae, it also circumvents the difficulties of measuring height in very small or sick children for incorporation in the formula. Therefore, this table of reference can potentially replace the use formulae in pediatric practice, especially in emergent situations where the ease of calculation is more important than accuracy. However, further studies are needed to validate the clinical application of the table of reference before it can be recommended on a larger scale.
The smallest bias demonstrated for Boyd and Mosteller formulae in the present study have been reported in previous studies.[23,24] Like these previous studies, the present study shows that Mosteller and Boyd's formulae are more accurate for BSA estimation than others formulae. Although Boyd's formula slightly overestimate BSA and Mosteller's formulae underestimates BSA in the Nigeria children population as previously reported by El Edelbi et al.,[27] they maintained the most clinically acceptable and fairly constant degree of bias as children's age increases. On the contrary, DuBois and DuBois's formula showed clinically unacceptable underestimation of BSA among children <6 years. Its complete lack of consistency in the degree of biases as the age increases from 1 to 11 years put its usefulness for BSA estimation in completed distrust [Figure 6]. Gehan's formula tends to a show close pattern of BSA estimates to Boyd's values beyond age 5 years; its wider lack of similarity with the “gold standard” diminishes its reliability for BSA estimation in children <5 years. However, Bystry and Omelka[28] has once reported that Gehan's formula could be the most reliable for estimating BSA of the children and adults in other populations. The reason why the same finding was not demonstrated could only be attributed to the differences in body weights and heights of children in these two populations.
Our finding of an excellent correlation between each of Boyd's and Mosteller's formulae and the “gold standard” lend credibility to the accuracy of the weight-based formula, besides highlighting its user-friendliness. Previous studies already validated Boyd's and Mosteller's formula for use in children as well. Lam and Leung[29] calculated the BSA of 168 children between 1 month and 14 years of age using Mosteller's formula and confirmed Mosteller's formula is equally applicable to children. Therefore, taking into account the present data, with limited and clinically acceptable differences between the five formulae evaluated in this study, Mosteller's formula can be applied in the age range 1-11 years and should be preferred because of its simplicity. Moreover, Chhapola et al.[23] recently showed that Mosteller's formula is more suitable for BSA estimation of children with non-edematous severe acute malnutrition than Boyd's formula, thus supporting earlier reports.
Judging from these data, Mosteller's formula will most likely produce the most useful, reliable and accurate BSA for the Nigeria child when there is a need for standardizing physiologic parameters. The basis for standardizing physiologic parameters such as cardiac output and glomerular filtration rate with BSA is that BSA proved to correlate more closely than body weight.[5,30] In a review of correlations of BSA and physiologic parameters such as cardiac index (cardiac output/BSA), renal function, and metabolic rate by Krovets,[5] it was concluded that cardiac index consistently correlated across age groups and sex. While the differences in BSA across the formulas would seem of little consequence in practice, the application of an underestimated BSA in the calculation of the cardiac index can potentially result in inadequate treatment of shock. Therefore, users of BSA-predicting equations must know the conditions for which the equation is valid.
One important issue that strengthens the interpretation and use of BSA estimates in this study is that the mean-BSA values were obtained using five previously validated formulae and the large sample size. Although this study recorded BSA of a relatively large number of children, there are four minor concerns which limit the generalizability of the data. First, there were no direct BSA measurements such as the use of a criterion method such as three-dimensional whole-body scanner. However, an attempt was made to overrule this by implementing the mean-BSA approach based on five formulae previously validated for use in other populations as in many of the previous studies.[22,24] Second, it is not known if these data can be applied to all ethnic groups in Nigeria as all ethnicity were not equally represented. The study participants were mainly the Yoruba-speaking people of Nigeria. Hence, the subtle variations in BSA attributed to racial and ethnic differences in the literature[31] could not be explored. Thirdly, this used a rather convenient sample, excluded ill children, and may, therefore, be more representative of healthy than hospitalized children. Fourthly, the study did not explore the effect of body mass on BSA in this study because the proportion of overweight children was rather too small to make valid comparisons among the normal versus underweight versus obese subjects in the same age groups.
Conclusion
Common equations use for pediatric BSA estimation has been scrutinized in this study. The ‘gold standard’ is to use direct method for BSA, but this is difficult in everyday clinical practice, so the use of equation remains the main option. Since accurate BSA estimation is paramount, the use of Boyd's or Mosteller's formula is recommended for estimating BSA needed in standardization of requisite physiological parameters among Nigerian children and in research. However, accuracy studies in with three-dimensional one pass whole-body scanning are needed for further validation.
Acknowledgments
We are grateful to all the parents of the children who participated in this research. We are also indebted to all the staff of the well-infants clinics, day-care centers and schools for their cooperation. We also thank all our research assistants for their help.
Footnotes
Source of Support: Nil.
Conflict of Interest: None declared.
References
- 1.Schmidt-Nielsen K. Energy metabolism, body size, and problems of scaling. Fed Proc. 1970;29:1524–32. [PubMed] [Google Scholar]
- 2.Stickler GB, Pinkel D. Calculation of nutritional allowances for infants and children on the basis of body surface. J Pediatr. 1958;53:464–6. doi: 10.1016/s0022-3476(58)80239-5. [DOI] [PubMed] [Google Scholar]
- 3.Schwartz GJ, Brion LP, Spitzer A. The use of plasma creatinine concentration for estimating glomerular filtration rate in infants, children, and adolescents. Pediatr Clin North Am. 1987;34:571–90. doi: 10.1016/s0031-3955(16)36251-4. [DOI] [PubMed] [Google Scholar]
- 4.Blake GM, Grewal GS. An evaluation of the body surface area correction for 51Cr-EDTA measurements of glomerular filtration rate. Nucl Med Commun. 2005;26:447–51. doi: 10.1097/00006231-200505000-00009. [DOI] [PubMed] [Google Scholar]
- 5.Krovetz LJ. The physiologic significance of body surface area. J Pediatr. 1965;67:841–62. doi: 10.1016/s0022-3476(65)80376-6. [DOI] [PubMed] [Google Scholar]
- 6.Wodey E, Senhadji L, Carre F, Ecoffey C. Extrapolation of cardiac index from analysis of the left ventricular outflow velocities in children: Implication of the relationship between aortic size and body surface area. Paediatr Anaesth. 2002;12:220–6. doi: 10.1046/j.1460-9592.2002.00834.x. [DOI] [PubMed] [Google Scholar]
- 7.Chatterjee S, Chatterjee P, Bandyopadhyay A. Prediction of maximal oxygen consumption from body mass, height and body surface area in young sedentary subjects. Indian J Physiol Pharmacol. 2006;50:181–6. [PubMed] [Google Scholar]
- 8.Ratain MJ. Body-surface area as a basis for dosing of anticancer agents: Science, myth, or habit? J Clin Oncol. 1998;16:2297–8. doi: 10.1200/JCO.1998.16.7.2297. [DOI] [PubMed] [Google Scholar]
- 9.Sawyer M, Ratain MJ. Body surface area as a determinant of pharmacokinetics and drug dosing. Invest New Drugs. 2001;19:171–7. doi: 10.1023/a:1010639201787. [DOI] [PubMed] [Google Scholar]
- 10.Habib RH, Zacharias A, Schwann TA, Riordan CJ, Durham SJ, Shah A. Effects of obesity and small body size on operative and long-term outcomes of coronary artery bypass surgery: A propensity-matched analysis. Ann Thorac Surg. 2005;79:1976–86. doi: 10.1016/j.athoracsur.2004.11.029. [DOI] [PubMed] [Google Scholar]
- 11.Boyd E. Institute of Child Welfare, Monograph Series 10. Minneapolis: University of Minnesota Press; 1935. The growth of the surface area of the human body. [Google Scholar]
- 12.DuBois D, Du Bois EF. A formula to estimate the approximate surface area if height and weight be known 1916. Nutrition. 1989;5:303–11. [PubMed] [Google Scholar]
- 13.DuBois D, DuBois EF. A formula to estimate the approximate surface area if height and weight be known. Arch Intern Med. 1916;17:863–71. [Google Scholar]
- 14.Haycock GB, Schwartz GJ, Wisotsky DH. Geometric method for measuring body surface area: A height-weight formula validated in infants, children, and adults. J Pediatr. 1978;93:62–6. doi: 10.1016/s0022-3476(78)80601-5. [DOI] [PubMed] [Google Scholar]
- 15.Gehan EA, George SL. Estimation of human body surface area from height and weight. Cancer Chemother Rep. 1970;54:225–35. [PubMed] [Google Scholar]
- 16.Mosteller RD. Simplified calculation of body-surface area. N Engl J Med. 1987;317:1098. doi: 10.1056/NEJM198710223171717. [DOI] [PubMed] [Google Scholar]
- 17.Turcotte G. Erroneous nomograms for body-surface area. N Engl J Med. 1979;300:1339. doi: 10.1056/nejm197906073002320. [DOI] [PubMed] [Google Scholar]
- 18.Yu CY, Lo YH, Chiou WK. The 3D scanner for measuring body surface area: A simplified calculation in the Chinese adult. Appl Ergon. 2003;34:273–8. doi: 10.1016/S0003-6870(03)00007-3. [DOI] [PubMed] [Google Scholar]
- 19.Brooke-Wavell K, Jones PR, West GM. Reliability and repeatability of 3-D body scanner (LASS) measurements compared to anthropometry. Ann Hum Biol. 1994;21:571–7. doi: 10.1080/03014469400003572. [DOI] [PubMed] [Google Scholar]
- 20.Jones PR, Baker AJ, Hardy CJ, Mowat AP. Measurement of body surface area in children with liver disease by a novel three-dimensional body scanning device. Eur J Appl Physiol Occup Physiol. 1994;68:514–8. doi: 10.1007/BF00599522. [DOI] [PubMed] [Google Scholar]
- 21.Dibley MJ, Goldsby JB, Staehling NW, Trowbridge FL. Development of normalized curves for the international growth reference: Historical and technical considerations. Am J Clin Nutr. 1987;46:736–48. doi: 10.1093/ajcn/46.5.736. [DOI] [PubMed] [Google Scholar]
- 22.Bland JM, Altman DG. Statistical methods for assessing agreement between two methods of clinical measurement. Lancet. 1986;1:307–10. [PubMed] [Google Scholar]
- 23.Chhapola V, Kanwal SK, Shafi OM, Kumar P. Accurate estimation of body surface area in under-5 children with non-edematous severe acute malnutrition. J Trop Pediatr. 2013;59:515–7. doi: 10.1093/tropej/fmt061. [DOI] [PubMed] [Google Scholar]
- 24.Verbraecken J, Van de Heyning P, De Backer W, Van Gaal L. Body surface area in normal-weight, overweight, and obese adults. A comparison study. Metabolism. 2006;55:515–24. doi: 10.1016/j.metabol.2005.11.004. [DOI] [PubMed] [Google Scholar]
- 25.Krieser D, Nguyen K, Kerr D, Jolley D, Clooney M, Kelly AM. Parental weight estimation of their child's weight is more accurate than other weight estimation methods for determining children's weight in an emergency department? Emerg Med J. 2007;24:756–9. doi: 10.1136/emj.2007.047993. [DOI] [PMC free article] [PubMed] [Google Scholar]
- 26.Scott LE, Galpin JS, Glencross DK. Multiple method comparison: Statistical model using percentage similarity. Cytometry B Clin Cytom. 2003;54:46–53. doi: 10.1002/cyto.b.10016. [DOI] [PubMed] [Google Scholar]
- 27.El Edelbi R, Lindemalm S, Eksborg S. Estimation of body surface area in various childhood ages-validation of the Mosteller formula. Acta Paediatr. 2012;101:540–4. doi: 10.1111/j.1651-2227.2011.02580.x. [DOI] [PubMed] [Google Scholar]
- 28.Bystrý J, Omelka F. A new aid for the determination of body surface area from 3 to 18 years of age. Cesk Pediatr. 1989;44:653–7. [PubMed] [Google Scholar]
- 29.Lam TK, Leung DT. More on simplified calculation of body-surface area. N Engl J Med. 1988;318:1130. doi: 10.1056/NEJM198804283181718. [DOI] [PubMed] [Google Scholar]
- 30.Pinkel D. Cancer chemotherapy and body surface area. J Clin Oncol. 1998;16:3714–5. doi: 10.1200/JCO.1998.16.11.3714. [DOI] [PubMed] [Google Scholar]
- 31.Rhodes J, Clay C, Phillips M. The surface area of the hand and the palm for estimating percentage of total body surface area: Results of a meta-analysis. Br J Dermatol. 2013;169:76–84. doi: 10.1111/bjd.12290. [DOI] [PubMed] [Google Scholar]


