

Abstract
Background:
In fast, developing economies such as India, the population is undergoing rapid social transition, which can increase the risk profile for diabetes. Market forces promoting lifestyles such as sedentary habits, alcohol and tobacco use, which earlier were more prevalent among affluent urban populations are now trickling into the urban poor and rural populations.
Aim:
The aim of the present research was to compare the prevalence of risk factors for diabetes among three distinct social groups-the urban affluent, the urban poor and the rural poor.
Subjects and Methods:
A total of 775 adult population over 18 years and belonging to both genders were surveyed for prevalence of some of the risk factors for diabetes such as physical inactivity, obesity, alcohol, and tobacco use. The sample comprised of three distinct social groups as follows; 125 medical students representing the affluent, 400 subjects from urban slums, and 250 subjects from rural areas. Obesity was measured by body mass index (BMI) while central obesity was ascertained by waist hip ratio (WHR). Alcohol and tobacco use were elicited by interview.
Results:
The overall response rate was 88.52% (686/775). Medical students were more sedentary with mean hours spent each day sitting or reclining at 10.47 (3.25) h, compared to corresponding figures of 6.34 (3.1) h and 7.49 (3.74) h for the rural and urban slum residents respectively (P < 0.001). However, all types of leisure time physical activities were significantly more among the medical students compared to the other groups (P < 0.001). BMI was significantly highest among the rural population with mean of 24.22 (4.17) kg/m2 when compared to the other groups, (P < 0.001). Villagers also had higher WHR and had a higher proportion of persons above the WHR cut-off for gender (P < 0.001). Experimentation with alcohol was more prevalent among the medical students while the urban slum residents were more frequent and heavy drinkers. Smoking was most prevalent among the medical students, while smokeless tobacco use was more among the other groups.
Conclusions:
Physical inactivity, obesity, including central obesity, alcohol and tobacco use were found in various degrees in the study samples. An important finding was that both obesity and central obesity ascertained by BMI and WHR respectively were highest among the rural population implying the impact of social change on diabetic risk factors.
Keywords: Diabetes, Risk factors, Social groups, Social transition
Introduction
India like other developing economies is undergoing rapid social transition. This is accompanied by changes in lifestyles of the population to a large extent accelerated by globalization and market forces. Lifestyle changes have been implicated as risk factors for most of the noncommunicable disease (NCD) including diabetes. Some of the lifestyle factors, which have been identified as risk factors for diabetes are physical inactivity, obesity, alcohol, and tobacco use.[1,2,3,4] Prevalence and association of these risk factors with diabetes mellitus among different age groups have also been explored in epidemiological studies.[5,6] Driven by the information highway, economic changes and market forces, the cultural boundaries between urban rich, the urban poor and the rural poor are getting blurred. This is translating into breakdown of “primordial prevention” due to the adoption of lifestyles, which enhance risk of NCDs such as diabetes, by erstwhile insulated rural populations.
The social transition phenomenon that the country is experiencing has the potential of making the rural and urban poor acquire the risk of developing diabetes at par with the affluent classes. Diabetes is likely to gain foothold in these lower social classes. The Chennai Urban Population Study was done to assess the effect of socioeconomic status on the prevalence of type 2 diabetes and related abnormalities.[7] The study involved two residential areas in Chennai representing the lower and middle-income group. The overall prevalence of diabetes was 12.4% in the middle-income group compared with 6.4% in the lower income group. The prevalence of related metabolic abnormalities like obesity and cardiovascular risk factors were also markedly higher in the middle-income group. A study from New Delhi showed that even slum dwellers had a high prevalence of obesity, glucose intolerance, and dyslipidemia.[8]
The STEPwise approach for surveillance (STEPS) devised by World Health Organization (WHO), depends on carrying out population based surveys to elicit data on major modifiable risk factors for NCDs including diabetes.[9] WHO has proposed a set of core indicators derived from STEPS surveys for monitoring NCD risk factors including diabetes. A number of studies have been carried out in India over the period 2000-2010 to study the trends of these risk factors using the WHO STEPS instrument. Raban et al.[10] identified 26 studies on NCD risk factors surveillance carried out in the decade 2000-2009. Sixteen of them were carried out from 2000 to 2004 and the rest in the latter part of the decade. Out these surveys 7 (26.9%) covered only rural or urban population or only males. Only two (7.7%) were nationally representative, seven (7.7%) were multiple state nonrepresentative surveys; one (3.8%) was a single state, representative survey, and six (23.1%) were single state nonrepresentative surveys.
As the risk factors for diabetes have been identified in different social groups, we decided to explore the differences in some of the risk factors for diabetes across the social and demographic divide in this cross-sectional study. We went with the postulate that a small or no difference in these risk factors would indicate that the rural areas are catching up with the urban areas in risk of diabetes. Similarly, if the difference in risk factors between the affluent newer generation and the urban slum and rural areas is not much, it may indicate that lower socio-economic classes are catching up with the affluent class in diabetic risk.
Subjects and Methods
We purposefully select the extremes of the social and demographic divide. On one hand, we selected affluent medical students of both gender and on the other social extreme we selected the adult population over 18 years of both gender from urban slum and rural area. We studied the distribution of the following risk factors in the three groups: Physical inactivity, obesity (as defined by body mass index (BMI) ≥23 kg/m2), central obesity (as defined by waist hip ratio (WHR) ≥0.9 for men and 0.85 for women), self-reported alcohol intake and self-reported tobacco use.
Study design
The study was an institution and population-based cross-sectional descriptive study to assess certain risk factors for diabetes among three different social and demographic classes.
Study samples
The survey was carried out on a total of 775 participants. The study samples were selected from three groups of the population. The first sample comprised of 125 medical students of both genders from a single semester of medical students of a private medical college who represented the affluent youth. The other two samples were 250 subjects over 18 years of age of both genders from the rural area and 400 subjects from urban slums, both within the field practice areas of a medical college in Pune. All the medical students belonging to one particular semester (total 125 students), were approached in the college, while the subjects in the urban and rural areas were contacted by house-to-house surveys. The samples in the urban slum and rural area were consecutive samples with the family as a sampling unit. Houses adjacent to the rural and urban health centers were visited systematically and all subjects 18 years of age and above were approached for participating in the survey till the required sample size was covered.
Participant recruitment and data collection
Eligible participants were all adults 18 years of age and above belonging to both genders who agreed to take part in the study. Persons suffering from any communicable or NCD were excluded from the study. After taking consent from the subjects, they were administered a structured questionnaire adapted from the WHO STEPS instrument[9] as applicable for some of the risk factors for diabetes. Information on demographic variables, lifestyle such as tobacco use, alcohol use, physical activity levels, was collected from the participants by face to face interview using a structured questionnaire. Anthropometric measurements for calculating the BMI and WHR were also undertaken. A BMI >23 kg/m2 was taken as high risk for diabetes.[11] Waist and hip circumferences were measured according to the WHO data gathering protocol.[9] Abdominal obesity was defined as WHR >0.9 for men and >0.85 for women. Levels of physical activity, alcohol and tobacco use were measured according to the WHO STEPS manual.[9] Help of interns and medico-social workers from the Department of Community Medicine of the college was taken in data collection in the house to house survey. Data from medical students were collected by one of the medical students as part of Indian Council of Medical Research Short Term Studentship project.
Data management and statistical analysis
World Health Organization/Centre for Disease Control software for epidemiology, EPI INFO (Version 3.5.2., Dec 17, 2010, WHO/CDC), was used to make the questionnaire, data entry and statistical analysis. Categorical data were summarized by rates. Quantitative data were summarized with mean and standard deviation (SD). For tests of significance, Chi-square, for categorical data, nonparametric tests (Kruskal–Wllis) and parametric tests (analysis of variance) were applied as applicable. P = 0.05 or lower was considered statistically significant.
Ethical issues
The study was approved by the Institutional Ethics Committee. Besides, consent from each participant was taken before the interview and examination as mentioned above.
Results
Response rates
Of the 775 subjects approached for the survey, 686 gave consent for the study, giving an overall response rate of 88.52% (686/775). The response rate was highest among the rural population at 94% (235/250), whereas it was 87.75% (351/400) among the urban slum population and lowest at 80% (100/125) among the college students.
Age, gender and socio-economic overview
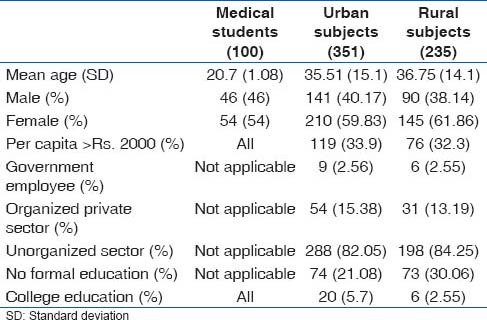
As shown in Table 1, the college students were youngest, while the urban and rural subjects were comparable in the age profile. Female participants were more in all the three groups. The college students came from families with per capita family income of over Rs. 2000 emphasizing their affluent background; 33.9% (119/351) of urban and 32.3% (76/235) of the rural population belonged to families with per capita income of more than Rs. 2000. Hence, income wise college students were way ahead, while the rural and urban populations were comparable. The occupations of the rural and urban subjects were mostly in the unorganized sector or in self-employed, casual labor either on the farm or in small scale industry or doing odd jobs. Only 2.56% (9/351) of the urban and 2.55% (6/235) of the rural population were employed in permanent government jobs, while 15.38% (54/351) of urban and 13.19% (31/235) of the rural population were employed in the organized private sector. Occupation wise, therefore, the bulk of the urban and rural subjects belonged to blue collar workers, 82.05% (288/351) and 84.25% (198/235), respectively. Education levels were lowest among the rural population with 30.06% (73/235) having no formal school education, while 21.08% (74/351) of the urban population did not have any formal school education. A higher proportion, 5.7% (20/351) of the urban population had college education compared with 2.55% (6/235) of the village population [Table 1].
Table 1.
Age, gender and socioeconomic overview of the study subjects
Sedentary levels
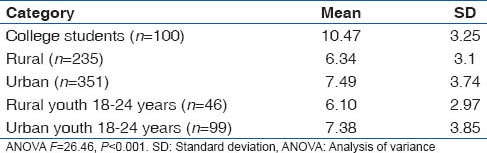
Table 2 shows the sedentary levels. The medical students were the most sedentary followed by urban population. Rural people were the least sedentary. The difference was statistically significant. We also explored the mean sedentary hours (sitting/reclining) in the 18-24 years age group in the rural and urban sample to eliminate the influence of age. There were 46 young people between 18 and 24 years in the rural sample and 99 in the urban. The mean sedentary hours in rural youth was 6.10 h (SD: 2.97 h) and 7.38 h (SD: 3.85 h) in the urban youth. Though the urban youth tended to be more sedentary, the difference was not significant statistically. This stratified analysis also showed that there was not much difference in sedentary hours spent by the youth in relation to their community elders.
Table 2.
Mean hours spent each day sitting or reclining
Vigorous intensity of physical activity at work
Only some people among rural (12.34%) and urban (11.97%) subjects were employed in work which entailed physical exertion of vigorous intensity. Among those who faced vigorous intensity physical exertion at work in the rural group the mean number of days in a week doing vigorous work was 5.34 days (SD: 1.67 days), while the corresponding figures were 4.53 days (SD: 2.33 days) for the urban population, and between 3 and 4 h each workday in both these groups.
Moderate intensity work
Among the rural population 38.30% were involved in moderate intensity work while 40.29% of urban people had occupation which involved moderate intensity physical work.
Sedentary work
Among the rural subjects, 49.36% had occupations which were sedentary which was slightly higher than the urban population in which 47.74% had the luxury of such occupation. This type of job did not involve intense or moderate physical exertion.
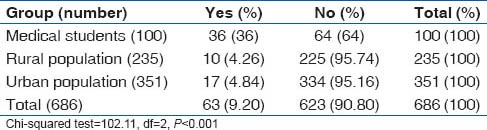
Brisk walking or cycling
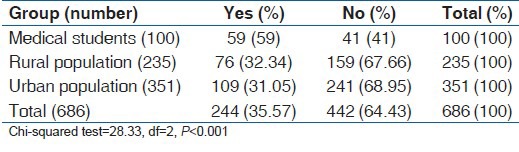
The college students scored above the rural and urban population [Table 3]. Fifty-nine percent of the college students indulged in some type of recreational physical activity compared to just above 30% in the rural and urban population.
Table 3.
Brisk walk or bicycling <10 min at least 4 days in a week
Vigorous intensity sports
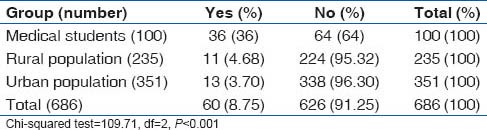
Medical students also fared better in vigorous recreational physical activity as shown in Table 4.
Table 4.
Vigorous intensity sports at least 3 times a week
Moderate intensity sports
The same trend was shown in moderate intensity recreational physical activity with the medical students having higher prevalence of moderate intensity sports participation [Table 5].
Table 5.
Moderate intensity sports at least 3 times a week
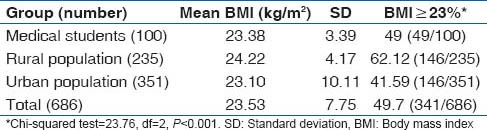
Body mass index
The mean BMI in the different social groups are shown in Table 6. The rural population had the higher BMI albeit by one unit than the medical students and urban slum dwellers who had more or less similar BMI levels. We also calculated the BMI in the 18-24 years age group in the rural and urban population so that they can be compared with the medical students who are in this age range. We found the mean BMI in this age group in a rural sample (n = 46) to be 22.66 (SD: 3.87), while in the urban youth (n = 99), it was 21.80 (SD: 3.86). Similarly, in the rural population 50% (23/46) of the youth had BMI equal to or higher to 23 kg/m2 compared to 31.31% (31/99) of the urban youth from the slum population.
Table 6.
BMI distribution in the study subjects
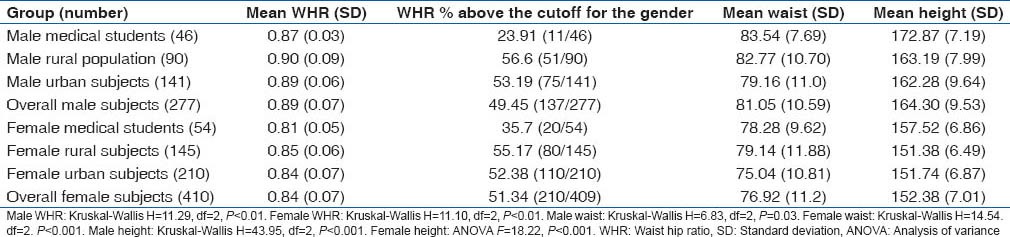
Waist hip ratio, mean waist and mean height
These have to be considered separately for males and females. The overall mean male WHR was 0.89 with SD of 0.07, while the corresponding values for females were 0.84 and 0.069. The breakdown in different groups is shown in Table 7. Again there was a tendency for the rural population both male and female to have a higher WHR. Proportion of persons above the cutoff of WHR according to gender was also highest among the rural population. As we could be inferred Table 7, while stature was lowest among the rural female population, central obesity measures were highest among them.
Table 7.
WHR, waist and height levels in the study subjects
Since we thought that central obesity as measured by WHR may be related with age, we also calculated the mean (SD) of the rural and urban youth between (18 and 24 years), so that same can be compared with the affluent medical students whose age ranged between 18 and 24 years. We found that the mean (SD) of WHR of rural young males between 18 and 24 years (n = 14) was 0.90 (0.06), while that of young men from urban slum (n = 39) was 0.87 (0.05); rural young females (n = 32) had mean WHR 0.85 (0.06), while urban young females (n = 60) the mean WHR was 0.83 (0.07).
Alcohol use patterns in the study subjects
Though it appears from Table 8 which summarizes the answer to the question “Have you ever taken alcohol?,” that alcohol use was more common among the medical students, further probing revealed that the urban and rural population were more serious drinkers, while medical students were experimenters. Tables 9 and 10 show show the drinking patterns of the study subjects.
Table 8.
Answer to the question, “Have you ever consumed alcohol?”
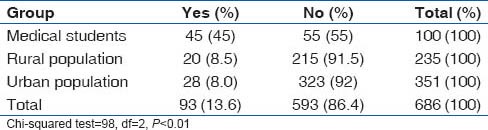
Table 9.
Answer to question, “In the past 30 days how many times you have taken at least 1 drink?”
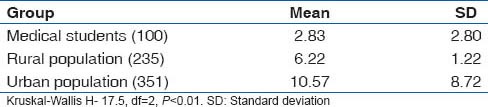
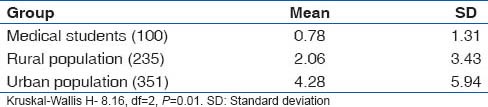
Table 10.
Answer to questions, “In the past 30 days on how many occasions taken 5 or more drinks?”
Tobacco use patterns in the study population
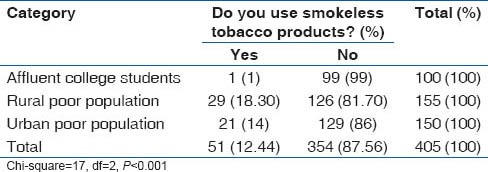
Overall prevalence of smoking was 12.2%. Prevalence of smoking was highest among medical students (17%), followed by rural population (16.6%) and lowest among the urban slum dwellers. However, use of smokeless tobacco (chewable tobacco) was lowest in the medical students (1%), while it was 16.2% in the rural population and 14% in the urban slum population. The smoking and tobacco use patterns are shown in Tables 11 and 12.
Table 11.
Prevalence of tobacco smoking among various categories
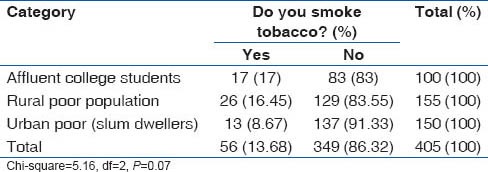
Table 12.
Prevalence of smokeless tobacco use among different groups
Discussion
The present study explored some of the risk factors for diabetes among three distinct social groups, the young and affluent medical students, the rural poor in the rural field practice area of a medical college, and the urban poor represented by slum dwellers in the urban field practice area of the medical college.
In a limited sample comprising different social groups, it has explored how the social transition in the country is having an impact on the risk profile of diabetes.
The data on physical activity levels among the study populations have brought out that while it would appear that the medical students were more sedentary, the rural and urban slum subjects were far behind the medical students in leisure time physical activity levels. Though they scored higher on physical activity at work they trailed by a big margin in recreational physical activity, such as participation in sports, compared to the medical students. A significantly higher proportion of medical students undertook leisure time physical activity such as cycling, brisk walking, vigorous and moderate intensity sports at least 3-4 times a week. This may to some extent explain the higher measures for central obesity (WHR) in these subjects compared to the medical students observed in our study. As we will see in subsequent paragraphs this higher prevalence of central obesity among the rural population observed in our study is in contrast with earlier studies.
The pattern of obesity as measured by BMI and central obesity as measured by WHR is interesting. The rural population had highest mean BMI as well as the highest proportion with BMI equal to or more than 23 kg/m2. They also had the lowest height measurements perhaps indicating stunting of growth during the growing years. On the other hand, the rural population had the highest proportion of people with central obesity as measured by WHR. Evidence from recent studies suggests that childhood deprivation is associated with type 2 diabetes and obesity in later life.[12] Since childhood malnutrition is known to be more prevalent in rural populations[13] this may explain the higher prevalence of central obesity in rural subjects in the present study.
While experimentation with alcohol was more common among the medical students, urban slum residents were heavier drinkers, with the rural population frequency of drinking being more than two times the medical students but less than the urban dwellers. While much efforts are being made to curb smoking including ban on advertisements and restriction of smoking in public places and depiction of smoking on social media, similar efforts to discourage alcohol are lacking.
The high smoking prevalence among the medical students is a cause of concern. Medical students are in the age group when lifetime patterns both healthy and unhealthy are formed. As future doctors, they are going to be a role model for the population. Mere awareness of the hazards of smoking is blurred by other social factors such as peer pressure, parental role models and high-pressure marketing.[14,15,16]
Similarly, use of smokeless tobacco was quite high in the urban and rural population. This is an issue which requires some attention, as it goes unnoticed and uncurbed unlike smoking which comes to the attention more easily. Besides tobacco being a risk for diabetes, use of smokeless tobacco is a major risk for oral cancers, esophageal cancers and pancreatic cancers.[17]
Tobacco and alcohol habits are independently associated with diabetes.[5] In a meta-analysis of prospective cohort studies with a total of over a million participants, current and former tobacco users had a higher incidence of diabetes compared to those who had never used tobacco.[4]
The findings of the present study indicates that the pattern of urban, rural divide in risk factor for NCDs including diabetes may be getting blurred since the rural subjects in our study showed a prevalence of risk factors particularly central obesity and high BMI on par or even greater than the urban subjects. This is in contrast to findings from earlier studies where these risk factors were found more prevalent in urban subjects. A study of NCD risk actors using WHO STEPS questionnaire carried out in North India, reported five times higher physical activity levels among rural subjects compared to urban and urban slum subjects.[18] It also reported that obesity measures such as BMI was higher in urban followed by urban slum and lowest in rural subjects.[18] Similarly, a study of NCD risk factor study in Gujarat, India, observed a prevalence of obesity and overweight higher in urban men and women compared to rural people.[19] Sedentary habits were also 3 times higher in the urban dwellers.[19] Mohan et al.[20] in a study of urban-rural difference in prevalence of self-reported diabetes in India reported lowest prevalence of diabetes in rural areas, followed by peri-urban/slum areas and highest in urban areas. They also reported that central obesity and sedentary lifestyles were higher in urban more affluent subjects while rural subjects were more active physically with a lesser prevalence of diabetes. The study concluded that urban residence, central obesity and physical inactivity are risk factors for diabetes.
The study had a number of limitations. It studied only a small sample. Further, the samples from different social groups were purposive and nonrandom in order to assemble and compare risk factors among subjects from different socio-economic strata. The samples sizes were not equal but based on the available sampling frames with the congested urban slum providing the largest sample size. Many other risk factors such as dietary habits were not explored in detail because of the problems associated with obtaining accurate dietary history. No laboratory investigations were carried out.
Deepa et al.[21] in a review article have comprehensively brought out the challenges faced in field work designed to carry out NCD risk factor surveillance. We faced similar difficulties leading to the limitations of the present study as mentioned above.
Moreover, because of the different population frames among the different social groups selected in the present study we also had unequal sample sizes of the three different groups which acted as each other's controls for comparison of risk factors for diabetes in the present study. The term “control” is used with various connotations in epidemiologic studies.[22] Cross-sectional studies have built in controls which differ from the other subjects being compared in their exposure to a postulated etiological factor or exposure.[22] In the present study, the postulated etiological factor or exposure was “social group.” The controls or groups being compared need not be equal in size.[22] There may be good reasons for having unequal groups. If there is a constraint on the number of subjects, then having more number in particular groups compensates for the small number of subjects in the other group.[22] Besides the unequal sample sizes, the medical students also belonged to a younger age range. To some extent we compensated this by comparing some of the risk factors in this group with urban and rural youth belonging to the same age groups.
In spite of these limitations, the most-important finding of the present study was that the rural population had the highest levels of central obesity and BMI, which may put them at a higher risk for diabetes. In times to come, we can expect a rural epidemic of diabetes mellitus in our country. However, since this is perhaps the first study to bring out the phenomenon of higher risk of diabetes in the rural population, more studies with more representative and larger samples avoiding the above limitations are indicated.
Footnotes
Source of Support: The study is partly based on the Indian Council of Medical Research (ICMR) Short Term Studentship (STS) Project.
Conflict of Interest: None declared.
References
- 1.Bassuk SS, Manson JE. Epidemiological evidence for the role of physical activity in reducing risk of type 2 diabetes and cardiovascular disease. J Appl Physiol (1985) 2005;99:1193–204. doi: 10.1152/japplphysiol.00160.2005. [DOI] [PubMed] [Google Scholar]
- 2.Wang Y, Rimm EB, Stampfer MJ, Willett WC, Hu FB. Comparison of abdominal adiposity and overall obesity in predicting risk of type 2 diabetes among men. Am J Clin Nutr. 2005;81:555–63. doi: 10.1093/ajcn/81.3.555. [DOI] [PubMed] [Google Scholar]
- 3.Carlsson S, Hammar N, Grill V. Alcohol consumption and type 2 diabetes Meta-analysis of epidemiological studies indicates a U-shaped relationship. Diabetologia. 2005;48:1051–4. doi: 10.1007/s00125-005-1768-5. [DOI] [PubMed] [Google Scholar]
- 4.Willi C, Bodenmann P, Ghali WA, Faris PD, Cornuz J. Active smoking and the risk of type 2 diabetes: A systematic review and meta-analysis. JAMA. 2007;298:2654–64. doi: 10.1001/jama.298.22.2654. [DOI] [PubMed] [Google Scholar]
- 5.Mozaffarian D, Kamineni A, Carnethon M, Djoussé L, Mukamal KJ, Siscovick D. Lifestyle risk factors and new-onset diabetes mellitus in older adults: The cardiovascular health study. Arch Intern Med. 2009;169:798–807. doi: 10.1001/archinternmed.2009.21. [DOI] [PMC free article] [PubMed] [Google Scholar]
- 6.Saaristo TE, Barengo NC, Korpi-Hyövälti E, Oksa H, Puolijoki H, Saltevo JT, et al. High prevalence of obesity, central obesity and abnormal glucose tolerance in the middle-aged Finnish population. BMC Public Health. 2008;8:423. doi: 10.1186/1471-2458-8-423. [DOI] [PMC free article] [PubMed] [Google Scholar]
- 7.Mohan V, Shanthirani CS, Deepa R. Glucose intolerance (diabetes and IGT) in a selected South Indian population with special reference to family history, obesity and lifestyle factors – The Chennai Urban Population Study (CUPS 14) J Assoc Physicians India. 2003;51:771–7. [PubMed] [Google Scholar]
- 8.Misra A, Pandey RM, Devi JR, Sharma R, Vikram NK, Khanna N. High prevalence of diabetes, obesity and dyslipidaemia in urban slum population in northern India. Int J Obes Relat Metab Disord. 2001;25:1722–9. doi: 10.1038/sj.ijo.0801748. [DOI] [PubMed] [Google Scholar]
- 9.WHO. Geneva: World Health Organization; 2013. [Last accessed on 2013 Oct 29]. STEPS Manual. Available from: http://www.who.int/chp/steps/manual/en/ [Google Scholar]
- 10.Raban MZ, Dandona R, Dandona L. Availability of data for monitoring noncommunicable disease risk factors in India. Bull World Health Organ. 2012;90:20–9. doi: 10.2471/BLT.11.091041. [DOI] [PMC free article] [PubMed] [Google Scholar]
- 11.WHO Expert Consultation. Appropriate body-mass index for Asian populations and its implications for policy and intervention strategies. Lancet. 2004;363:157–63. doi: 10.1016/S0140-6736(03)15268-3. [DOI] [PubMed] [Google Scholar]
- 12.Tamayo T, Christian H, Rathmann W. Impact of early psychosocial factors (childhood socioeconomic factors and adversities) on future risk of type 2 diabetes, metabolic disturbances and obesity: A systematic review. BMC Public Health. 2010;10:525. doi: 10.1186/1471-2458-10-525. [DOI] [PMC free article] [PubMed] [Google Scholar]
- 13.Nutrition Data. National Family Health Survey (NFHS– 3) India Fact Sheet. 2005-2006. [Last accessed on 2014 Jul 01]. Available from: http://www.motherchildnutrition.org/india/overview-india.html#.U7KJ95SSyZI .
- 14.Banerjee A. Tobacco use patterns among military recruits. Med J Armed Forces India. 2000;56:192–4. doi: 10.1016/S0377-1237(17)30163-6. [DOI] [PMC free article] [PubMed] [Google Scholar]
- 15.Tessier JF, Fréour P, Belougne D, Crofton J. Smoking habits and attitudes of medical students towards smoking and antismoking campaigns in nine Asian countries. The Tobacco and Health Committee of the International Union Against Tuberculosis and Lung Diseases. Int J Epidemiol. 1992;21:298–304. doi: 10.1093/ije/21.2.298. [DOI] [PubMed] [Google Scholar]
- 16.Murray M, Swan AV, Bewley BR, Johnson MR. The development of smoking during adolescence – The MRC/Derbyshire Smoking Study. Int J Epidemiol. 1983;12:185–92. doi: 10.1093/ije/12.2.185. [DOI] [PubMed] [Google Scholar]
- 17.National Cancer Institute. Smokeless Tobacco and Cancer. [Last accessed on 2013 Nov 11]. Available from: http://www.cancer.gov/cancertopics/factsheet/Tobacco/smokeless .
- 18.Yadav K, Krishnan A. Changing patterns of diet, physical activity and obesity among urban, rural and slum populations in north India. Obes Rev. 2008;9:400–8. doi: 10.1111/j.1467-789X.2008.00505.x. [DOI] [PubMed] [Google Scholar]
- 19.Bhagyalaxmi A, Atul T, Shikha J. Prevalence of risk factors of non-communicable diseases in a District of Gujarat, India. J Health Popul Nutr. 2013;31:78–85. doi: 10.3329/jhpn.v31i1.14752. [DOI] [PMC free article] [PubMed] [Google Scholar]
- 20.Mohan V, Mathur P, Deepa R, Deepa M, Shukla DK, Menon GR, et al. Urban rural differences in prevalence of self-reported diabetes in India – The WHO-ICMR Indian NCD risk factor surveillance. Diabetes Res Clin Pract. 2008;80:159–68. doi: 10.1016/j.diabres.2007.11.018. [DOI] [PubMed] [Google Scholar]
- 21.Deepa M, Pradeepa R, Anjana R, Mohan V. Noncommunicable diseases risk factor surveillance: Experience and challenge from India. Indian J Community Med. 2011;36:S50–6. doi: 10.4103/0970-0218.94709. [DOI] [PMC free article] [PubMed] [Google Scholar]
- 22.Abramson JH, Abramson ZH Control groups. Research Methods in Community Medicine. 6th ed. Chichester, West Sussex, England: John Wiley and Sons Ltd; 2008. pp. 69–76. [Google Scholar]