Abstract
Bismuth nanoparticles have been proposed as a novel CT contrast agent, however few syntheses of biocompatible bismuth nanoparticles have been achieved. We herein report the synthesis of composite bismuth-iron oxide nanoparticles (BION) that are based on a clinically approved, dextran-coated iron oxide formulation; the particles have the advantage of acting as contrast agents for both CT and MRI. BION were synthesized and characterized using various analytical methods. BION CT phantom images revealed that the X-ray attenuation of the different formulations was dependent upon the amount of bismuth present in the nanoparticle, while T2-weighted MRI contrast decreased with increasing bismuth content. No cytotoxicity was observed in Hep G2 and BJ5ta cells after 24 hours incubation with BION. The above properties, as well as the yield of synthesis and bismuth inclusion efficiency, led us to select the Bi-30 formulation for in vivo experiments, performed in mice using a micro-CT and a 9.4 T MRI system. X-ray contrast was observed in the heart and blood vessels over a 2 hour period, indicating that Bi-30 has a prolonged circulation half-life. Considerable signal loss in T2-weighted MR images was observed in the liver compared to pre-injection scans. Evaluation of the biodistribution of Bi-30 revealed that bismuth is excreted via the urine, with significant concentrations found in the kidneys and urine. In vitro experiments confirmed the degradability of Bi-30. In summary, dextran coated BION are biocompatible, biodegradable, possess strong X-ray attenuation properties and also can be used as T2-weighted MR contrast agents.
Keywords: Bismuth, iron oxide, nanoparticle, contrast agent, computed tomography, magnetic resonance imaging
Introduction
The field of nanoparticle contrast agents for computed tomography (CT) has grown rapidly over the past decade.1-8 Compared to clinically available small molecule contrast agents, nanoparticle based imaging probes have advantages such as carrying a much higher payload of contrast producing material and much longer circulation half-lives.1,3 Nanoparticles can be efficiently targeted using antibodies, proteins, peptides or other targeting ligands or used in cell tracking.4,9-11 Also, it is relatively easy to integrate multiple properties into nanoparticles, such as various contrast generating materials that enable multi-modality imaging or a combination of imaging and therapeutics.12,13 Lastly, growing concerns over the biocompatibility of iodinated agents,14,15 especially in patients with compromised renal function, has motivated the exploration of novel CT contrast agent formulations.
Several groups have evaluated gold nanoparticles as CT contrast agents.3,4,6,16-18 Gold nanoparticles produce strong CT contrast (up to twice that of iodine),18 are highly biocompatible, can be used for vascular imaging and have been used for targeted CT imaging.3-5,19 An advantage of gold nanoparticles is extensive experience with their synthesis, allowing control over their size, morphology and coating.20-22 Bismuth also attenuates X-rays strongly,2,5,7,23 is inexpensive (~$0.02/g) and after gold, is thought to be the most biocompatible heavy metal.24 However, synthetic approaches to bismuth nanoparticles are far less numerous than for gold, limiting their development as CT contrast agents.
Dextran coated iron oxides, such as Feridex, are clinically approved as contrast agents for magnetic resonance imaging (MRI).25,26 They have been used for targeted imaging,27 cell tracking28,29 and for both drug and nucleic acid delivery.30,31 This excellent track record in biomedical applications motivated us to develop bismuth nanoparticles based on dextran coated iron oxides. We therefore adapted the Molday synthesis for iron oxide nanoparticles,32,33 where iron (III) and iron (II) chlorides are co-precipitated using ammonia in the presence of dextran. We modified the protocol by substituting varying amounts of bismuth (III) for iron (III) and synthesized a range of such formulations to explore the effect of this substitution on the properties of the nanoparticles.
In this study, we present the results of synthesis and characterization of several dextran coated bismuth iron oxide (BION) formulations and in vivo imaging experiments using a selected formulation. BION were synthesized through co-precipitation of ferrous chloride, ferric chloride and bismuth nitrate in the presence of dextran. We synthesized a range of BION formulations by substituting several different percentages of ferric chloride with bismuth (III) nitrate. Each BION formulation was characterized using techniques such as transmission electron microscopy (TEM), dynamic light scattering (DLS), inductively coupled plasma optical emission spectroscopy (ICP-OES), relaxometry, energy dispersive X-ray spectroscopy (EDS) and magnetic moment measurements. High resolution TEM (HRTEM) and selected area electron diffraction (SAED) were performed on selected samples. The biocompatibility of the nanoparticles was evaluated via in vitro incubation with hepatocytes (Hep G2) and fibroblasts (BJ5ta). Taken together, the results of these experiments indicated that Bi-30 was the best formulation to test in vivo. CT and MR imaging experiments, biodistribution measurements and biodegradation studies were carried out using this formulation in mice, which demonstrated the potential of this agent as a dual CT/MRI contrast agent and that it is degradable and excretable in vivo.
2. Materials and methods
Synthesis and purification of BION
Several different BION formulations were synthesized by co-precipitation of iron and bismuth salts in the presence of dextran using a modified version of a protocol previously reported for the synthesis of dextran coated iron oxide.33 Briefly, 12.5 g of dextran T-10 (Pharmacosmos, Holbaek, Denmark) was dissolved in 25 ml of deionized (DI) water. The resulting solution was placed in an ice bath and was purged with nitrogen gas for 30 minutes while stirred, to completely remove oxygen from the flask. For each formulation, varying amounts of ferric chloride and bismuth nitrate, but a fixed amount of ferrous chloride (all purchased from Sigma-Aldrich, St. Louis, USA), as summarized in Table 1, were added to the dextran solution. As the amount of bismuth nitrate used was increased, the amount of ferric chloride used in the reaction was reduced, to maintain the molar ratios between the Fe3+/Bi3+ and Fe2+ ions. The ferric chloride and ferrous chloride were each dissolved in 6.5 ml of DI water whereas the bismuth nitrate was dissolved in 3.5 ml of ethylene glycol prior to addition to the dextran solution (ethylene glycol was also added to the reaction when no bismuth was used). Notably, in the absence of bismuth incorporation, we did not find any difference in particle size or transverse (T2) relaxivity on the presence or absence of ethylene glycol. A TEM image for Bi-0 formulation synthesized without ethylene glycol is presented in Figure S1A.
Table 1.
Amounts of the reagents used in the synthesis of BION
| Formulation | FeCl3.6H2O (g) | FeCl2.4H2O (g) | Bi(NO3)3.5H2O (g) |
|---|---|---|---|
| Bi-0 | 0.98 | 0.36 | 0 |
| Bi-10 | 0.88 | 0.36 | 0.17 |
| Bi-30 | 0.68 | 0.36 | 0.53 |
| Bi-50 | 0.49 | 0.36 | 0.88 |
| Bi-70 | 0.29 | 0.36 | 1.23 |
| Bi-90 | 0.09 | 0.36 | 1.59 |
Fifteen ml of concentrated ammonium hydroxide (28-30%) was added to the dextran-iron-bismuth solution using a syringe pump. The ammonium hydroxide flow rate was set to 0.3 μl/min for the first 2.5 hours and then increased to 0.6, 0.9 and 1.2 μl/min for 1 hour each, consecutively; the remainder of the ammonium hydroxide was added to the dextran solution at a rate of 4 μl/min. After addition of ammonium hydroxide, the nanoparticle suspension was heated to 90 °C for an hour and then stirred at room temperature overnight. The resulting nanoparticle suspension was centrifuged at 20k rcf for 30 minutes. The supernatant was collected and concentrated to 15 ml using ultrafiltration tubes (molecular weight cut off 100 kDa, Sartorius Stedim Biotech, Germany). The nanoparticles were washed with citrate buffered saline (0.15 M sodium chloride and 20 mM sodium citrate dehydrate, pH 7.4) using 100 kDa MW diafiltration columns (SPECTRUM, CA, USA) continuously for 16 h using a peristaltic pump. After purification, the resulting BION formulations were stored at 4 °C. We synthesized several formulations termed Bi-0 Bi-10, Bi-30, etc., where the number indicates the percentage of ferric chloride replaced with bismuth nitrate, as summarized in Table 1.
Characterization
Dynamic light scattering and zeta potential
The hydrodynamic diameter and zeta potential of each BION formulation was measured using a Nano-ZS 90 (Malvern Instrument, Malvern, UK). Hydrodynamic diameter and zeta potential measurements were performed at 25 °C using 1.5 and 1 ml of diluted BION (10 μl from stock was diluted with 2 ml of freshly filtered (0.2 μm) DI water).
Transmission electron microscopy
Transmission electron microscopy of each BION formulation was performed using a JEOL 1010 microscope operating at 80 kV. Briefly, 10 μl of diluted BION (10 μl from stock was diluted with 1 ml of DI water) was dropped onto carbon coated copper grid (FCF-200-Cu, Electron Microscopy Sciences, Hatfield, PA, USA), and allowed to evaporate before imaging. High-resolution images and SAED patterns were collected at 200 kV on a JEOL 2010F TEM/STEM and a JEOL 2100 TEM, respectively. Samples were mounted from suspension onto 200 mesh Cu grids with lacy carbon films.
Energy dispersive X-ray spectroscopy
Elemental analysis of each BION formulation was performed using energy dispersive X-ray spectroscopy. TEM grids were prepared as described above and the elemental analysis was performed using a JEOL 2010F microscope operating at 200 kV.
Inductively coupled plasma optical emission spectroscopy
The amount of iron and bismuth present in each BION was determined using inductively coupled plasma optical emission spectroscopy (ICP-OES, Spectro Genesis ICP). In brief, 5, 10 and 25 μl of BION from the stock of each formulation were dissolved in 1 ml of concentrated nitric acid (70%). The final volume of each sample was adjusted to 10 ml using deionized water. Bismuth and iron analytical standards were purchased from Fisher Scientific (Pittsburgh, USA). The concentrations of bismuth and iron were determined for each sample, multiplied by the dilution factor and the concentrations thus obtained were averaged to obtain the final bismuth and iron concentration for each BION formulation.
T2 relaxivity measurement
The T2 relaxivity of each BION formulation was measured using a tabletop Minispec MR (Bruker mq60 MR) relaxometer operating at 1.41 T (60 MHz). T2 values were measured for BION formulation whose iron concentration ranged from 0.1 to 0.6 mM. The transverse relaxivity was calculated from the slope of 1/T2 plotted against iron concentration for each formulation.
Magnetic properties
The magnetic properties of each BION formulation were determined using an alternating gradient magnetometer (Princeton Instruments Corporation, Princeton, NJ, USA). In brief, 5 μl of BION suspensions (12 mg Fe/ml) were dropped on to 4×4 mm2 cover glass slides and allowed to dry. The magnetic properties of each BION formulation were estimated from the resulting curves.34
Phantom construction and imaging
BION phantom CT imaging
The CT phantom was constructed similarly to a described previously protocol.23 In brief, the concentration of each BION formulation was adjusted to 9.37 mg Fe/ml, whereas the bismuth concentration varies in each formulation (the concentration of bismuth in Bi-0, Bi-10, Bi-30 and Bi-50 was 0, 1.98, 6.34 and 6.38 mg/ml respectively). These samples were prepared in triplicate in 1.5 ml centrifuge tubes. The tubes were placed in a rack, which was covered in parafilm and the rack placed in a plastic container (24 cm in width) that was filled with water up to 21 cm in height, to simulate the attenuation effects of the abdomen of a patient. The phantom was scanned using a Siemens Definition DS 64-slice clinical CT scanner at 80 kV (550 mA), 100 kV (440 mA), 120 kV (352 mA) and 140 kV (308 mA) with a matrix size of 512×512, field of view 37×37 cm, reconstruction kernel B30f and slice thickness of 0.6 cm. Images were analyzed using Osirix 64 bit (v3.7.1). The attenuation value, in Hounsfield Units (HU) for each sample tube was determined from three different slices and averaged for each sample.
BION phantom MR imaging
BION samples at a concentration of 0.195 mg Fe/ml were prepared in triplicate in 1.5 ml centrifuge tubes. The tubes were placed in a rack, which was then placed in a hot solution of 2% agarose and 0.35 mM manganese chloride solution. The phantom was cooled to 4 °C to allow the agarose to solidify. The BION phantom was scanned using a 3T MRI system (Tim Trio Model, Siemens Healthcare, Erlangen, Germany). We computed T2 using a spin echo pulse sequence. The scanning parameters used were: echo time (TE) = 5.8 ms, repetition time (TR) = 10 sec, slice thickness = 3 mm, flip angle (FA) = 180 degrees, acquisition matrix 184×256, field of view (FOV) 165×230. The MR images of BION phantom were analyzed using Osirix v.3.0.1 32-bit.
In vitro cell viability assay
Cell culture
Hep G2 (human hepatocellular liver carcinoma) and BJ5ta (human foreskin fibroblast) cells were purchased from ATCC (Manassas, VA, USA). The Hep G2 cells were maintained in Eagle’s Minimum Essential Medium, 10% fetal bovine serum (Gibco, Grand Island, NY USA), 45 IU/ml penicillin and 45 IU/ml streptomycin (Gibco). The BJ5ta cells were maintained in a culture medium containing 4 parts of Dulbecco’s Modified Eagle’s Medium (ATCC), 1 parts of medium 199 (ATCC), 10 % fetal bovine serum (Gibco) and 0.01 mg/ml of hygromycin B (Sigma-Aldrich). The cells were grown at 37 °C in 5% CO2 humidified incubator.
Cytotoxicity assay
In vitro cytotoxicity of each BION formulation was examined in Hep G2 and BJ5ta cells using the MTS ((3-(4,5-dimethylthiazol-2-yl)-5-(3-carboxymethoxyphenyl)-2-(4-sulfophenyl)-2H-tetrazolium) assay (CellTiter 96 cell proliferation assay kit; Promega, Madison, WI, USA). The assay was performed according to the manufacturer instructions and as reported elsewhere.23 In brief, the assay was performed in a 96 well flat bottom micro plate with 10,000 cells seeded in each well. Three different concentrations (i.e. 10, 50 and 100 μg Fe/ml) of each BION formulation were tested in both cell lines. Six replicate wells were used for each control and test concentration per microplate. After 24 hours incubation with BION, the cell monolayer was rinsed gently with sterile PBS. 20 μl of MTS/phenazine methosulfate (PMS) solution and 100 μl of cell culture medium were added to each well and the plates subsequently incubated at 37 °C for 1 hour. After this incubation, the absorbance was measured at 490 nm using a micro plate reader. Three independent experiments were performed for each exposure dose and each BION formulation. The percentage of relative cell viability was calculated and the data presented as mean ± standard deviation (n=3).
In vivo characterization of BION
Animal experiments
All animal experiments were performed using wild-type C57BL/6J inbred mice (Jackson Laboratory, Bar Harbor, Maine, USA). All experimental protocols were approved by the Institutional Animal Care and Use Committee (IACUC) of the University of Pennsylvania. All in vivo experiments were performed with Bi-30 at a dose of 350 mg Bi/kg body weight, administered via the tail vein (510 mg Fe/kg).
In vivo CT imaging
For CT imaging experiment, pre and post-injection CT images of mice was acquired using a MicroCAT II (Imtek, Inc, Knoxville, TN, USA). 8 week old wild-type C57BL/6J mice (n=3) were anesthetized via isoflurane prior to a pre-injection CT scan and then injected with BION (Bi-30). After this injection, mice were scanned at different time intervals post-injection i.e. 5, 30, 60 and 120 minutes. CT images were acquired using the following parameters: slice thickness 100 μm, field of view 51.2 mm × 76.8 mm, tube voltage 80 kV and tube current was 500 μA. The reconstruction kernel used a Feldkamp cone beam correction and Shepp-Logan filter. The CT images were analyzed using Osirix 64 bit (v3.7.1). The attenuation values in Hounsfield Units (HU) for several organs (heart, liver, spleen and bladder) were recorded from three different slices and averaged. The data presented is the relative attenuation compared to pre-injection scan (mean ± SD).
In vivo MR imaging
For MR imaging experiments, pre and post-injection MR images of mice were acquired using a 9.4 T magnet interfaced to a Varian INOVA console (Varian Medical Systems, Palo Alto, CA, USA). In brief, 8-week-old wild-type C57BL/6J mice (n=3) were anesthetized with isoflurane prior to the pre-injection MR scan. The mice were scanned again two hours after injection with BION (Bi-30). MR images were acquired using the following parameters: TR=200 ms, TE=5 ms, flip angle 20°, number of acquisitions 8 and slice thickness 0.5 mm. The images were analyzed using ImageJ. For each mouse, three different axial slices were chosen for analysis from both the pre and post-injection scans. The signal to noise ratio (SNR) of the liver and adjacent muscle in each slice was calculated by dividing the standard deviation of the background noise. The data is presented as the mean ± SD.
Biodistribution
The biodistribution of BION (Bi-30) was investigated in 8-week-old wild-type C57BL/6J mice (n=4). A control group of mice (n=4) was employed for estimation of iron content in different organs. At 2 hours post injection of Bi-30, the mice were sacrificed and perfused via the left ventricle with 20 ml PBS in order to remove any BION present in the blood in the organs. After perfusion, the liver, lungs, heart, spleen and kidneys were harvested. These organs were also harvested in the same way as described above for the control group. All the organs were weighted and then diced into small pieces and digested in 800 μl of concentrated nitric acid at 75 °C for nearly 16 hours. Urine samples were collected from the treated (after 2 hour post injection) and control group. The bismuth and iron content were determined using the ICP-OES. Data are presented as mean ± SD (n=4).
In vitro biodegradation experiments
Samples of the Bi-30 formulation (4 mg Fe) were suspended in either 1 ml of 10% FBS (in PBS, pH 7.4), which mimicked blood, or 20 mM citrate buffer (pH 5.5), which mimicked lysosomal fluid, in 1.5 ml centrifuge tubes and incubated at 37 °C in an oven. At different time intervals (such as 1, 2, 4, 6, 24, 48, 72, 96, 120, 144 and 160 hours) the supernatant from each sample was collected (after centrifugation at 20800 rcf for 20 min) and nanoparticle pellets were resuspended with fresh buffer. Then the tubes were incubated in the oven for next round of sample collection. The released amount of bismuth and iron were analyzed in the samples using ICP-OES.
3. Results and discussion
Synthesis and characterization of BION formulations
Dextran coated BION formulations were synthesized by co-precipitation of Fe(III), Fe(II) and Bi(III) in the presence of dextran via the addition of ammonium hydroxide (Figure 1A). We synthesized a range of formulations (Bi-0, Bi-10, Bi-30, Bi-50, Bi-70 and Bi-90) by use of different amounts of bismuth nitrate. From the ICP-OES results we found that the formulations with higher percentages of bismuth nitrate used during synthesis (i.e. Bi-70 and Bi-90) exhibited a very low recovery yield (Table 2). Therefore we did not pursue these formulations after performing preliminary characterization.
Figure 1.
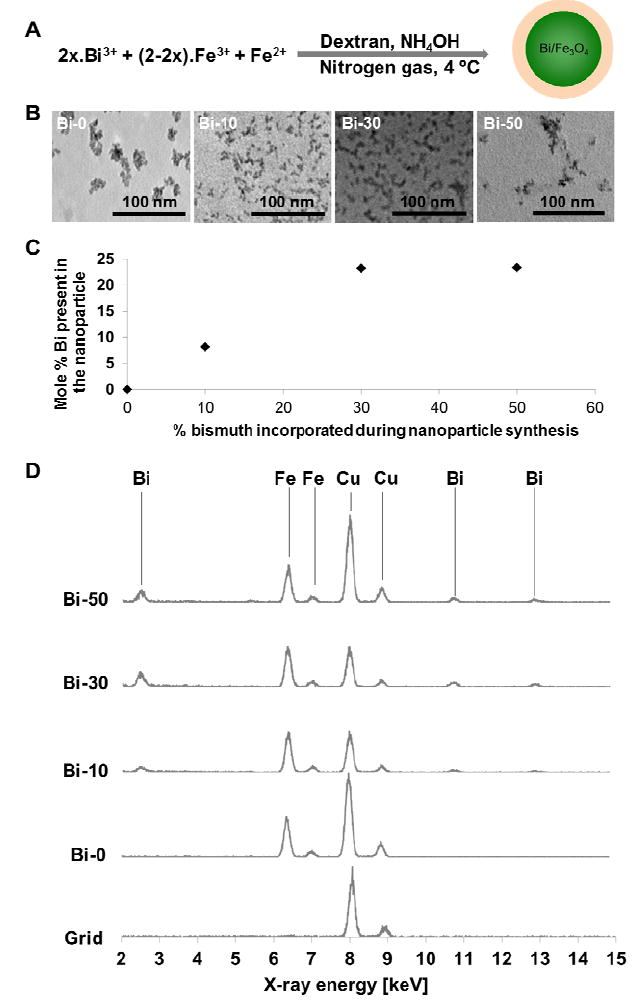
A) BION reaction scheme. B) Transmission electron micrographs of dextran coated BION formulations. C) Plot showing mole % of Bi integrated into BION cores after use of different percentages of bismuth nitrate during synthesis. D) Energy dispersive X-ray spectra of dextran coated BION formulations. The graphs are normalized to the height of the iron peak.
Table 2.
Characterization data of the dextran coated BION formulations
| Formulation s | Formulations details | % yield (iron) | % yield (bismuth) | Hydrodynamic diameter (nm) | Zeta Potential (mV) | T2 relaxivity (mM-1s-1) |
|---|---|---|---|---|---|---|
| Bi-0 | Iron 100% | 16.8 | N/A | 35.6 ± 0.6 | -11.7 ± 0.9 | 74 |
| Bi-10 | Iron-90% Bismuth-10% |
18.2 | 28.2 | 56.5 ± 0.4 | -8.4 ± 0.5 | 1.05 |
| Bi-30 | Iron-70% Bismuth-30% |
12.5 | 16.6 | 98 ± 0.8 | -8.5 ± 1.9 | 0.4 |
| Bi-50 | Iron-50% Bismuth-50% |
10.3 | 6.8 | 123 ± 0.9 | -8.7 ± 1.2 | 0.22 |
| Bi-70 | Iron-30% Bismuth-70% |
3.7 | 1.7 | 151 ± 0.8 | -7.88 ± 0.3 | 0.20 |
| Bi-90 | Iron-10% Bismuth-90% |
0.7 | 0.5 | 178 ± 2.4 | -14.7 ± 0.4 | - |
The hydrodynamic diameter of the BION formulations increased with increasing amounts of bismuth used in the synthesis (Table 2), even though the cores formed did not increase in size, as evidenced by the TEM images (Figure 1B). ICP-OES revealed that the more bismuth nitrate was used in the reaction, the more bismuth was integrated into the nanoparticles, generally speaking (Table 2). Figure 1C shows the mole % of bismuth present in each BION formulation versus the mole % of bismuth nitrate incorporated during synthesis of each BION formulation. When 10 or 30% bismuth nitrate was added to the reaction, a slightly lower percentage of bismuth was found in the final formulations. However, when 50% bismuth nitrate was used, the bismuth content in the product was only 23% and the reaction yield decreased. Potentially use of hydrochloric acid as the solvent for the iron salts might produce higher yields. This approach will be investigated in future work. To further probe the inclusion of bismuth into iron oxide nanoparticles, EDS was performed (Figure 1D). When bismuth was added to the reaction mixture, bismuth peaks clearly arise in the spectra (the copper peaks are signal from the grid material). We measured the area under the curve for iron and bismuth for each formulation. We found ratios of 6.9, 2.5 and 2.9, for Bi-10, Bi-30 and Bi-50, respectively, which correlates well with the values determined from ICP-MS. The results suggested that bismuth was integrated into the iron oxide cores in each case. The zeta potential of the different BION formulations was did not change substantially with the integration of bismuth into the iron oxide core (Table 2), which is unsurprising given that the nanoparticle coating is the same for each formulation, and the coating is the major contributor to the zeta potential.
The relationship between T2 relaxivity and the amount of bismuth used in synthesis is shown in Figure 2A, while the magnetic moment plots for the BION formulations are presented in Figure 2B. The T2 relaxivities decreased with increased bismuth content in the nanoparticle. The magnetization of the BION formulations also decreased with increased bismuth content in the nanoparticle formulation (Figure S2). As the addition of bismuth disrupts the magnetic properties of the nanoparticles, it is likely that bismuth is integrated into the iron oxide crystal lattice. The data from the various characterization techniques (ICP-OES, EDS, T2 relaxivity and magnetization) suggests that bismuth was integrated into the iron oxide core, although other explanations are possible.
Figure 2.
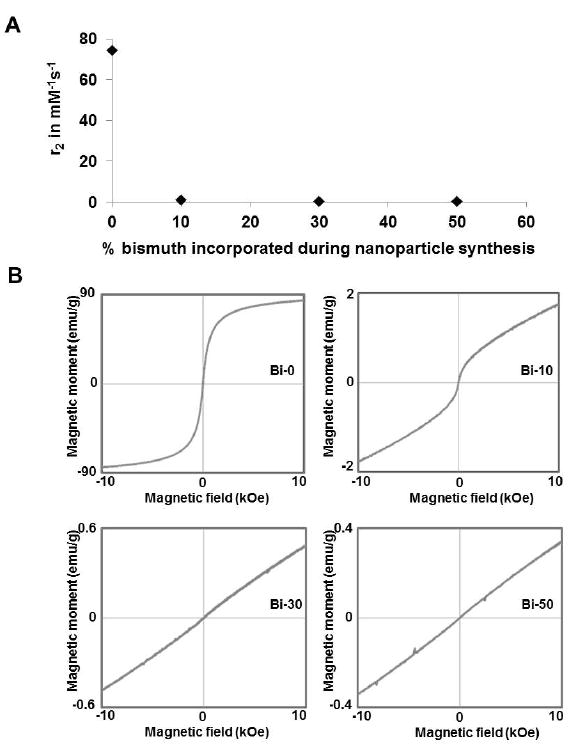
A) The transverse relaxivity of BION formulations. B) Magnetic moment plots of BION formulations.
To further probe the structure of the nanoparticles, we synthesized an additional formulation where the amount of iron (III) was reduced 30%, but we did not add bismuth to the synthesis (termed Fe-70). Fe-70 is an analogous to Bi-30, except bismuth is not present. We performed HRTEM and SAED on Bi-0, Bi-30 and Fe-70 (Figure 3A). The HRTEM images for Bi-0 and Fe-70 show nanoparticles in the 5 to ~15 nm size range. The particles are well crystallized and occur in random orientation. High resolution images acquired from sample Bi-30 appear to show poorly crystalline material with only minor evidence of crystalline material. SAED patterns taken from these samples resulted in similar conclusions. A high degree of crystallinity was observed for Bi-0 and Fe-70, with the d-spacing matching that of magnetite (Table S1) and that for dextran coated iron oxides reported by others.35 On the other hand, only two peaks were clearly observed in the pattern for Bi-30, indicating minor crystallinity. We also measured the transverse relaxivity of Fe-70 and found it to be 68 mM-1s-1, close to the value of Bi-0. Bi-30 and Fe-70 are the same, except that bismuth was added in the synthesis of Bi-30, therefore this data supports the hypothesis of bismuth inclusion in the iron oxide cores, as it is unlikely that the presence of Bi3+ ions in solution would cause the iron cores to be amorphous and non-superparamagnetic.
Figure 3.
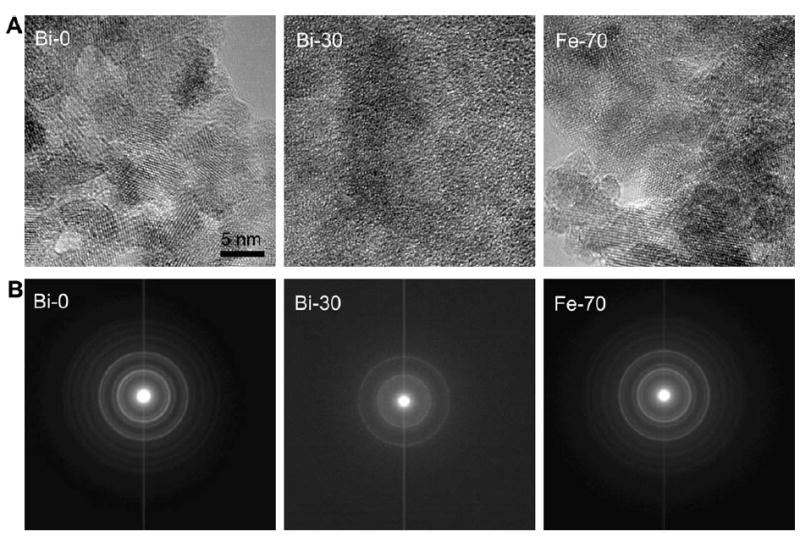
A) HRTEM of nanoparticle formulations. B) SAED of the samples indicated.
BION phantom imaging with CT and MRI
CT images, acquired at 140 kV, of a phantom containing several BION formulations at the same iron concentration (9.4 mg/ml) is presented in Figure 4A. The X-ray attenuation was quantified for each BION formulation at several X-ray tube voltages (Figure 4B). This data shows that iron oxide alone (Bi-0) attenuates X-rays poorly, with only ~50 HU produced by this concentration, depending on the X-ray voltage used (CT attenuation scales approximately with Z3, so iron is not expected to strongly attenuate X-rays). As expected, inclusion of bismuth resulted in marked increases in the X-ray attenuation, in proportion to the amount of bismuth in the formulation (Figure S3). Attenuation was strongest at 80 kV, giving Hounsfield unit values ~20% higher than for the other X-ray tube voltages. The attenuation did not change significantly between 100 and 140 kV. This pattern of unchanging attenuation with changing X-ray tube voltage is similar to results we have previously reported for bismuth nanoparticles.23 This is likely related to the high k-edge of bismuth (90.8 keV) compared to the average energy of the X-ray beam for the specific CT scanner used (56 keV for 80kV scan to 76 keV for 140 kV scan).
Figure 4.
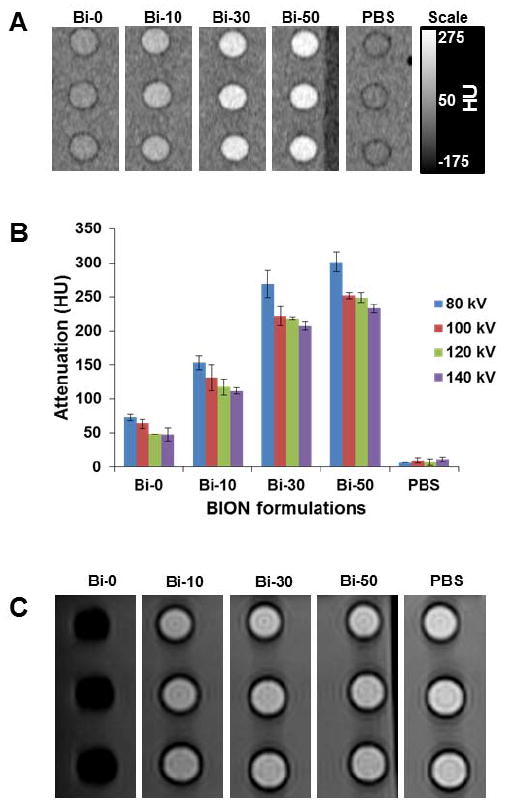
A) CT image of BION phantom (iron concentration for all the BION formulations is 9.37 mg/ml). B) Analysis of the CT attenuation of the BION formulations at various X-ray tube voltages (80 to 140 kV), error bars are standard deviations. C) MR image of a BION phantom (the iron concentration for all the formulations is 0.19 mg/ml).
A magnetic resonance image of a phantom containing different BION formulations is shown in Figure 4C. Unsurprisingly, the Bi-0 formulation produced by far the strongest contrast, while the contrast produced by Bi-10, Bi-30 and Bi-50 was markedly lower. Nevertheless, the data predicted that BION formulations should still be effective as MR contrast agents given that the doses required for CT are in the range of hundreds of mg/kg. For a BION formulation, hundreds of mg/kg of both Bi and Fe would be used. So despite low MR contrast-inducing properties, due to the large doses that would be used, we expected to see significant MR contrast produced in vivo.
Cell viability
The results of cell viability measurements for BION formulations incubated with BJ5ta or Hep G2 cells are presented in Figure 5. No cytotoxic effect was observed in either cell line after 24 hours of incubation with the BION formulations at the doses used, indicating that the agents were biocompatible. This result was as expected, given the good biocompatibility of the BION components. The characteristics of the BION formulations in terms of biocompatibility, relaxivity, and surface charge were very similar. However, Bi-30 and Bi-50 had the highest bismuth inclusion, maximizing the CT contrast properties of the nanoparticles, but the yield of B-30 was higher, therefore we selected this formulation for in vivo experiments.
Figure 5.
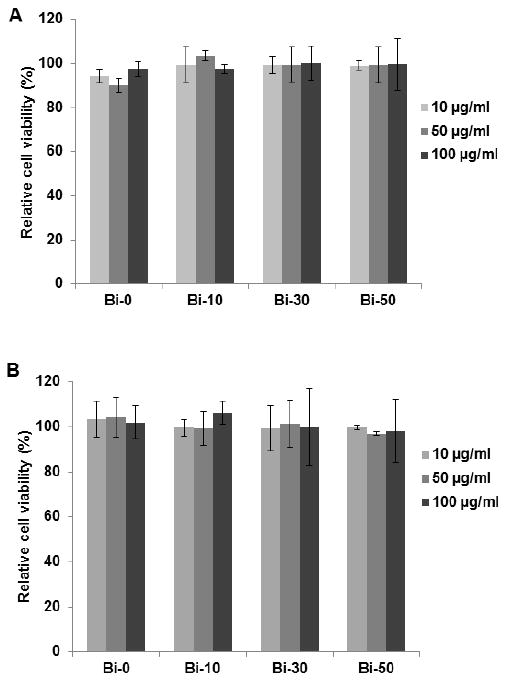
Cell viability of A) BJ5ta and B) Hep G2 cells after 24 hours incubation with BION formulations. Error bars are standard deviations.
In vivo experiments
In vivo CT imaging
We studied the CT contrast generation of Bi-30 in wild type mice using a microCT scanner operating at 80 kV. Mice were injected via the tail vein at a dose of 350 mg Bi/kg, similar to the doses of iodinated CT contrast agents used in patients. Representative pre- and post-injection CT images are presented in Figure 6. Strong X-ray attenuation in the blood vessels and heart of the mice was observed (Figure 6A and B). CT contrast in the heart and the blood vessels decreased over time, whereas CT attenuation in the bladder increased from 5 minutes to 30 minutes post-injection and remained constant thereafter (Figure 6C, Figure S4). The contrast produced in the bladder indicated that some bismuth was being excreted in urine, which was surprising, as the nanoparticles are too large to be excreted renally in their intact form.36 Potentially this excretion could be due to degradation of the nanoparticles, a hypothesis that we tested in subsequent sections. CT attenuation in the heart and blood vessel was observed for the duration of our measurements, i.e. until 120 minutes post-injection (Figure 6A), which indicated that BION were in the systemic circulation. Presumably contrast would also be observed over longer timeframes, if measured. The X-ray attenuation in different organs (such as heart, liver, spleen and bladder) was quantified and compared to that in the pre injection scans (Figure 6D). The results for the heart and bladder confirm the visual impressions from Figure 6A-C. Some contrast in the liver and spleen was observed, indicating nanoparticle accumulation in these organs, as is typically observed.2,37
Figure 6.
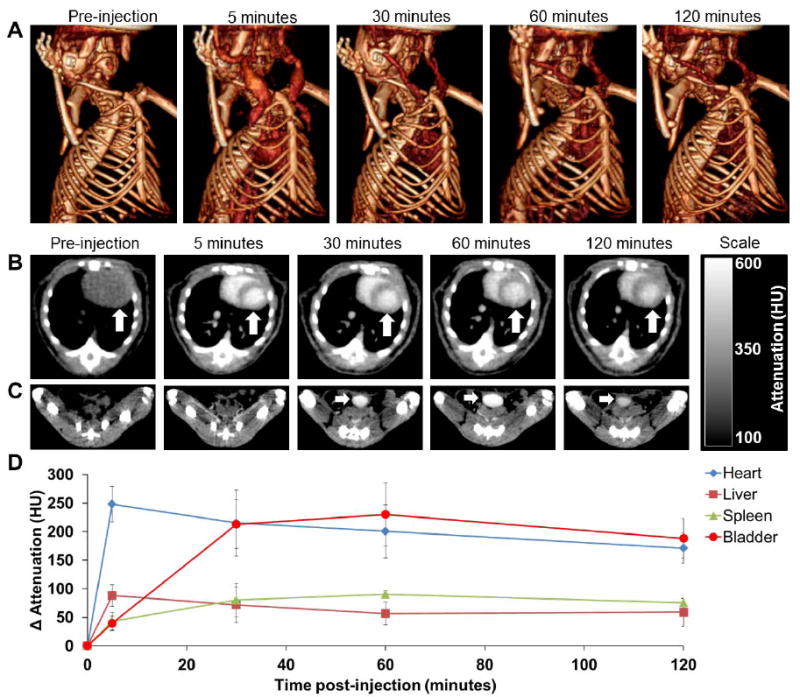
In vivo CT imaging of mice injected with BION (Bi-30). A) 3-D volume rendered CT images of a mouse, pre- and 5, 30, 60 and 120 minutes post-injection. B) CT images of a mouse thorax acquired at different time points; the arrow indicates the heart. C) CT images of mouse groin acquired at different time points; the arrow indicates the bladder. D) CT attenuation change of different organs over time, post-BION injection. Error bars are standard deviations.
In vivo MR imaging
MR images of a mouse liver before and after Bi-30 injection are presented in Figure 7A. We selected the liver for imaging with MRI. As can be seen, a significant loss of MR signal in the liver (at 2 hours post-injection) was observed compared to the pre-injection image. Even though the T2 relaxivity of Bi-30 formulation is low, at only 0.4 mM-1s-1, contrast in MRI is due to the product of relaxivity and concentration. Thus the high dose used was sufficient to generate MR contrast in vivo. These in vivo CT and MR imaging experiments indicated that the BION (Bi-30) is effective as a dual modality contrast agent.
Figure 7.
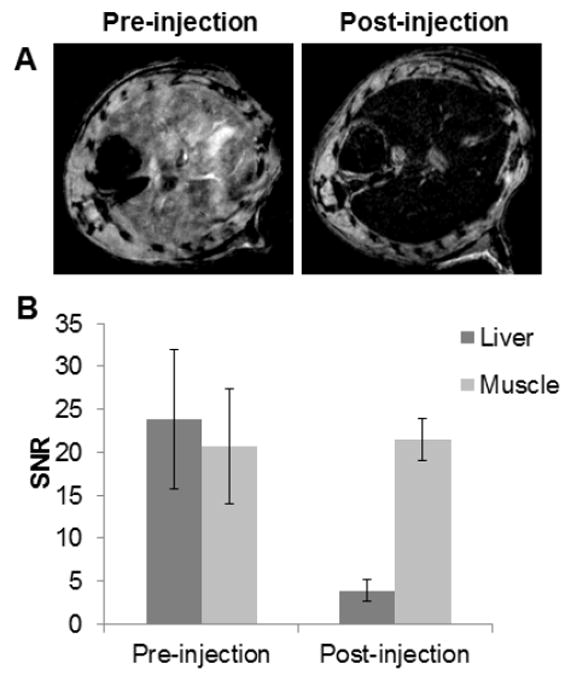
A) In vivo MR images of the liver of mice before and 2 hours after injection with BION (Bi-30). B) Quantitation of the MR signal intensity in mouse livers compared between pre- and post-injection images. Error bars are standard deviations.
Biodistribution
Our observations of CT contrast in the bladder motivated investigation of biodistribution at 2 hours post-BION injection, to determine whether bismuth and iron were being excreted via this route. This data is presented in Figure 8; we found that 11% ID/g accumulated in the spleen, while in rest of the organs (heart, lungs, kidneys and liver) ≤6% ID/g was found. Interestingly, the bismuth content of the kidney was found to be significantly higher than that of iron, whereas there was no significant difference in the other organs. However, the bismuth content was lower than iron in the blood. Furthermore, we found that bismuth was excreted in urine in significantly higher quantities than iron (Figure 8B). This suggested that the BION degraded in vivo and that the released ions were excreted in urine. The greater content of bismuth compared to iron in the kidneys and urine may be due to sequestration of released iron by ferritin and other iron sinks within the body, whereas no such system exists for bismuth and therefore bismuth ions are free to be filtered in the kidneys. It has been reported that dextran coated iron oxide nanoparticles can be internalized by cells via endocytosis, degraded in the acidic environment and iron released into the cytoplasm. The iron may be used by the cells or stored in ferritin and eventually participate in the synthesis of red blood cells.38,39
Figure 8.
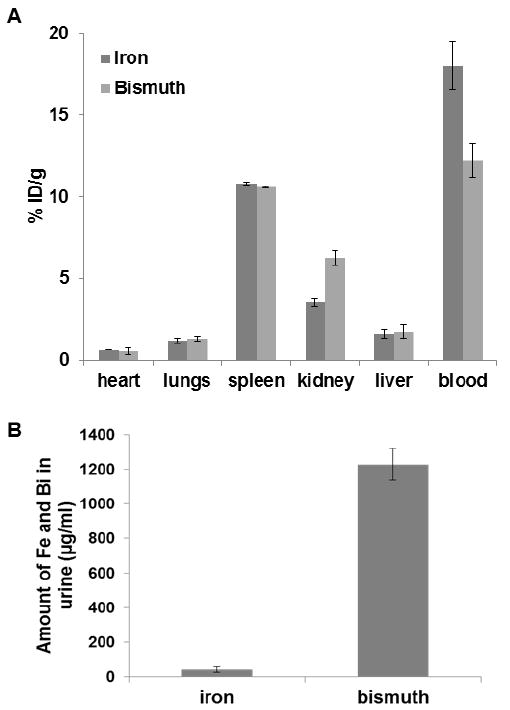
Biodistribution of BION (Bi-30) in C57BL/6J mice. A) Amount of bismuth and iron present in different organs 2 hour post-injection (values are adjusted for endogenous iron content). B) Iron and bismuth content in urine samples collected 2 hour post-injection. Error bars are standard deviations.
Biodegradation
To probe the biodegradation of Bi-30, we incubated samples in 10 % FBS at 37 °C. After 0, 1 and 24 hours of incubation, the hydrodynamic diameter was measured. The hydrodynamic diameter decreased over time from 98 to 90 nm after one hour and to 48 nm after 24 hours (Figure S5). This result supported the hypothesis of BION degradation under biological conditions. Additionally, we investigated the release of bismuth and iron by incubating Bi-30 formulation for 7 days in two different conditions, i.e. 10% FBS (mimicking the blood) and a lysosomal mimicking fluid. The nanoparticles are injected into the blood and many of them are likely taken up into endosomes, therefore these are relevant conditions to test.38 In the lysosomal mimicking fluid, we observed that 80% of Bi and Fe was released within 4 hours and 89% at 7 days. However, when incubated in 10% serum, only 19% and 29% of Bi and Fe was released at 4 hours and 7 days, respectively (Figure 9). These results support the hypothesis that BION may be degraded in vivo, causing bismuth and iron ions to be released.
Figure 9.
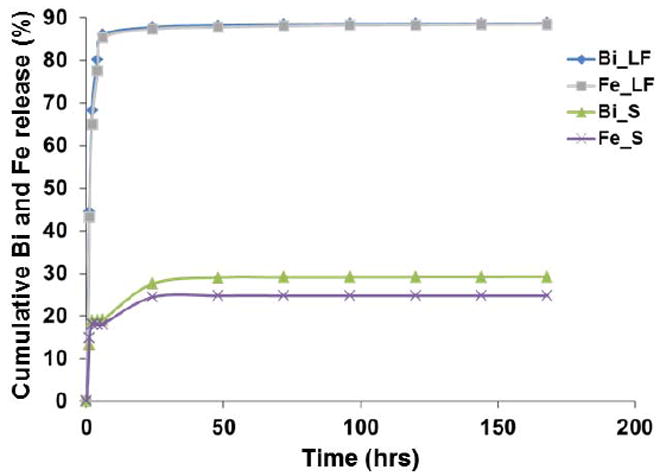
In vitro biodegradation of Bi-30 in solutions that mimic serum (S) and lysosomal fluid (LF).
Conclusions
In this study, we present an aqueous synthetic route for dextran coated BION formulations. The characterization results suggested that the bismuth is integrated into the iron oxide core, in this approach. Strong X-ray attenuation was observed from the composite nanohybrid. The magnetic properties and transverse relaxation of the BION formulations were decreased due to the presence of bismuth in the nanoparticle core. In vitro cell viability experiments demonstrated the biocompatibility of the BION. In vivo CT imaging revealed strong X-ray attenuation in the heart and blood vessels over a sustained period. Despite the relatively poor MR contrast properties of the nanoparticles, we observed strong contrast in mouse liver post-injection during in vivo MR imaging experiments. The biodistribution and in vitro degradation experiments suggests that the nanoparticles degrade over time and excreted in urine. In summary, dextran coated BION are biocompatible, biodegradable, possess strong X-ray attenuation at CT and also perform as T2-weighted MR contrast agents. Therefore, BION can be used as a dual imaging probe for both CT and MRI.
Supplementary Material
Acknowledgments
This work was supported by funding from NIH Grant R00 EB012165, R00 HL108157 and startup funds from the University of Pennsylvania. We acknowledge additional funding from the Penn Nanotoxicology Alliance (Nanotechnology Institute, Nano-Biointerface Center, Center for Translational Targeted Therapeutics and Nanomedicine, and the Center of Excellence in Environmental Toxicology –P30ES13508) with funds from the Provost. Research reported in this publication was supported by the National Center for Advancing Translational Sciences of the National Institutes of Health under award number UL1TR000003. The content is solely the responsibility of the authors and does not necessarily represent the official views of the National Institutes of Health.
Footnotes
Supporting information
TEM images of Bi-0 formulation (without ethylene glycol), Bi-70 and Bi-90 formulations, saturation of magnetization versus different BION formulations, the attenuation of BION as a function of bismuth content and X-ray tube voltages (80-140 kV), whole body CT images of mice pre and post-injection with BION (Bi-30 formulation), hydrodynamic diameter of the Bi-30 formulation after incubation with 10% FBS at 37 °C for 1 and 24 hours and diffraction d-spacings calculated from SAED data for the samples and from the PDF database for Fe3O4 are available in the supporting information.
Conflict of interest
We have no conflict of interest to declare.
References
- 1.Cormode DP, Naha PC, Fayad ZA. Contrast Media Mol Imaging. 2014;9:37. doi: 10.1002/cmmi.1551. [DOI] [PMC free article] [PubMed] [Google Scholar]
- 2.Ai K, et al. Adv Mater. 2011;23:4886. doi: 10.1002/adma.201103289. [DOI] [PubMed] [Google Scholar]
- 3.Cai QY, et al. Invest Radiol. 2007;42:797. doi: 10.1097/RLI.0b013e31811ecdcd. [DOI] [PubMed] [Google Scholar]
- 4.Cormode DP, et al. Nano lett. 2008;8:3715. doi: 10.1021/nl801958b. [DOI] [PMC free article] [PubMed] [Google Scholar]
- 5.Kinsella JM, et al. Angew Chem Int Ed Engl. 2011;50:12308. doi: 10.1002/anie.201104507. [DOI] [PMC free article] [PubMed] [Google Scholar]
- 6.Mieszawska AJ, et al. Mol Pharm. 2013;10:831. doi: 10.1021/mp3005885. [DOI] [PMC free article] [PubMed] [Google Scholar]
- 7.Rabin O, et al. Nat Mater. 2006;5:118. doi: 10.1038/nmat1571. [DOI] [PubMed] [Google Scholar]
- 8.Rivera EJ, et al. J Mater Chem B Mater Biol Med. 2013;1 [Google Scholar]
- 9.Arifin DR, et al. NMR Biomed. 2013;26:850. doi: 10.1002/nbm.2894. [DOI] [PMC free article] [PubMed] [Google Scholar]
- 10.Nahrendorf M, et al. Circulation. 2006;114:1504. doi: 10.1161/CIRCULATIONAHA.106.646380. [DOI] [PubMed] [Google Scholar]
- 11.Pan D, et al. Angew Chem Int Ed Engl. 2010;49:9635. doi: 10.1002/anie.201005657. [DOI] [PMC free article] [PubMed] [Google Scholar]
- 12.Mieszawska AJ, et al. Bioconjug Chem. 2013;24:1429. doi: 10.1021/bc400166j. [DOI] [PMC free article] [PubMed] [Google Scholar]
- 13.Mulder WJ, et al. Nanomedicine. 2007;2:307. doi: 10.2217/17435889.2.3.307. [DOI] [PubMed] [Google Scholar]
- 14.Davenport MS, et al. Radiology. 2013;268:719. doi: 10.1148/radiol.13122276. [DOI] [PubMed] [Google Scholar]
- 15.Stacul F, et al. Eur Radiol. 2011;21:2527. doi: 10.1007/s00330-011-2225-0. [DOI] [PubMed] [Google Scholar]
- 16.Allijn IE, et al. ACS Nano. 2013;7:9761. doi: 10.1021/nn403258w. [DOI] [PMC free article] [PubMed] [Google Scholar]
- 17.Au JT, et al. AJR Am J Roentgenol. 2013;200:1347. doi: 10.2214/AJR.12.8933. [DOI] [PubMed] [Google Scholar]
- 18.Galper MW, et al. Invest Radiol. 2012;47:475. doi: 10.1097/RLI.0b013e3182562ab9. [DOI] [PMC free article] [PubMed] [Google Scholar]
- 19.Eck W, et al. Nano lett. 2010;10:2318. doi: 10.1021/nl101019s. [DOI] [PubMed] [Google Scholar]
- 20.Daniel MC, Astruc D. Chem Rev. 2004;104:293. doi: 10.1021/cr030698+. [DOI] [PubMed] [Google Scholar]
- 21.Hostetler MJ, et al. J Am Chem Soc. 1996;118:4212. [Google Scholar]
- 22.Li N, Zhao P, Astruc D. Angew Chem Int Ed Engl. 2014;53:1756. doi: 10.1002/anie.201300441. [DOI] [PubMed] [Google Scholar]
- 23.Brown AL, et al. Chem Mater. 2014;26:2266. doi: 10.1021/cm500077z. [DOI] [PMC free article] [PubMed] [Google Scholar]
- 24.Briand GG, Burford N. Chem Rev. 1999;99:2601. doi: 10.1021/cr980425s. [DOI] [PubMed] [Google Scholar]
- 25.Corot C, et al. Adv Drug Deliv Rev. 2006;58:1471. doi: 10.1016/j.addr.2006.09.013. [DOI] [PubMed] [Google Scholar]
- 26.Matuszewski L, et al. Radiology. 2005;235:155. doi: 10.1148/radiol.2351040094. [DOI] [PubMed] [Google Scholar]
- 27.Kelly KA, et al. Circ Res. 2005;96:327. doi: 10.1161/01.RES.0000155722.17881.dd. [DOI] [PubMed] [Google Scholar]
- 28.Bulte JW, Kraitchman DL. NMR Biomed. 2004;17:484. doi: 10.1002/nbm.924. [DOI] [PubMed] [Google Scholar]
- 29.Thu MS, et al. Nat Med. 2012;18:463. doi: 10.1038/nm.2666. [DOI] [PMC free article] [PubMed] [Google Scholar]
- 30.Chorny M, et al. J Proc Natl Acad Sci. 2010;107:8346. doi: 10.1073/pnas.0909506107. [DOI] [PMC free article] [PubMed] [Google Scholar]
- 31.Medarova Z, et al. Nat Med. 2007;13:372. doi: 10.1038/nm1486. [DOI] [PubMed] [Google Scholar]
- 32.Molday RS, MacKenzie D. J Immunol Methods. 1982;52:353. doi: 10.1016/0022-1759(82)90007-2. [DOI] [PubMed] [Google Scholar]
- 33.Thorek DL, Tsourkas A. Biomaterials. 2008;29:3583. doi: 10.1016/j.biomaterials.2008.05.015. [DOI] [PMC free article] [PubMed] [Google Scholar]
- 34.Chorny M, et al. FASEB J. 2007;21:2510. doi: 10.1096/fj.06-8070com. [DOI] [PMC free article] [PubMed] [Google Scholar]
- 35.Muller K, et al. Biomaterials. 2007;28:1629. doi: 10.1016/j.biomaterials.2006.12.003. [DOI] [PubMed] [Google Scholar]
- 36.Choi HS, et al. Nat Biotechnol. 2007;25:1165. doi: 10.1038/nbt1340. [DOI] [PMC free article] [PubMed] [Google Scholar]
- 37.Gu L, et al. ACS Nano. 2012;6:4947. doi: 10.1021/nn300456z. [DOI] [PMC free article] [PubMed] [Google Scholar]
- 38.Arbab AS, et al. NMR Biomed. 2005;18:383. doi: 10.1002/nbm.970. [DOI] [PubMed] [Google Scholar]
- 39.Richardson DR, Ponka P. Biochim Biophys Acta. 1997;1331:1. doi: 10.1016/s0304-4157(96)00014-7. [DOI] [PubMed] [Google Scholar]
Associated Data
This section collects any data citations, data availability statements, or supplementary materials included in this article.


