

A study of DNA replication timing in mouse and human cells reveals that replication domains (domains of the genome which replicate at the same time) share a correlation with topologically associating domains; these results reconcile cell-type-specific sub-nuclear compartmentalization with developmentally stable chromosome domains and offer a unified model for large scale chromosome structure and function.
Supplementary information
The online version of this article (doi:10.1038/nature13986) contains supplementary material, which is available to authorized users.
Subject terms: Chromosomes, DNA replication, Data integration, Nuclear organization
A unified model for large-scale chromosome organization
As part of the mouse ENCODE project, David Gilbert and colleagues study the relationship between replication timing and higher order chromatin domains in mouse and human. They find that boundaries of replication domains — domains within the genome which replicate at the same time — share a near one-to-one correlation with topology associated domains. These and other results reconcile cell-type specific sub-nuclear compartmentalization with developmentally stable chromosome domains and offer a unified model for large-scale chromosome structure and function.
Supplementary information
The online version of this article (doi:10.1038/nature13986) contains supplementary material, which is available to authorized users.
Abstract
Eukaryotic chromosomes replicate in a temporal order known as the replication-timing program1. In mammals, replication timing is cell-type-specific with at least half the genome switching replication timing during development, primarily in units of 400–800 kilobases (‘replication domains’), whose positions are preserved in different cell types, conserved between species, and appear to confine long-range effects of chromosome rearrangements2,3,4,5,6,7. Early and late replication correlate, respectively, with open and closed three-dimensional chromatin compartments identified by high-resolution chromosome conformation capture (Hi-C), and, to a lesser extent, late replication correlates with lamina-associated domains (LADs)4,5,8,9. Recent Hi-C mapping has unveiled substructure within chromatin compartments called topologically associating domains (TADs) that are largely conserved in their positions between cell types and are similar in size to replication domains8,10. However, TADs can be further sub-stratified into smaller domains, challenging the significance of structures at any particular scale11,12. Moreover, attempts to reconcile TADs and LADs to replication-timing data have not revealed a common, underlying domain structure8,9,13. Here we localize boundaries of replication domains to the early-replicating border of replication-timing transitions and map their positions in 18 human and 13 mouse cell types. We demonstrate that, collectively, replication domain boundaries share a near one-to-one correlation with TAD boundaries, whereas within a cell type, adjacent TADs that replicate at similar times obscure replication domain boundaries, largely accounting for the previously reported lack of alignment. Moreover, cell-type-specific replication timing of TADs partitions the genome into two large-scale sub-nuclear compartments revealing that replication-timing transitions are indistinguishable from late-replicating regions in chromatin composition and lamina association and accounting for the reduced correlation of replication timing to LADs and heterochromatin. Our results reconcile cell-type-specific sub-nuclear compartmentalization and replication timing with developmentally stable structural domains and offer a unified model for large-scale chromosome structure and function.
Supplementary information
The online version of this article (doi:10.1038/nature13986) contains supplementary material, which is available to authorized users.
Main
Measurements of replication timing in human and mouse reveal chromosome segments with relatively uniform replication timing (constant timing regions, CTRs), mediated by clusters of near-synchronous initiation events that are heterogeneous in location from cell to cell and appear to fire through a stochastic mechanism14. Despite stochastic origin firing, CTRs are interrupted at reproducible locations by transitions between early and late replication called timing transition regions (TTRs; Fig. 1a). We mapped TTRs in 35 mouse and 31 human data sets as part of the Mouse ENCODE project consortium6. Replication timing of early TTR borders clustered better than late (Extended Data Fig. 1a), suggesting that initiation events defining early borders are coordinated, whereas events defining late borders are less synchronized, possibly resulting from passive fork fusion15. To investigate a possible relationship between TTRs and TADs (Supplementary Discussion), we aligned mouse embryonic stem cell (mESC) TTRs (Fig. 1b) and compared them to the directionality index used to define TAD boundaries (transitions from upstream to downstream interaction bias)8. A single shift from upstream to downstream bias occurred within 500 kilobases (kb) of the average TTR, located near the aligned early border. Examination of individual TTRs indicated that TAD boundaries typically isolated early CTRs from TTRs, whereas TTRs and neighbouring late CTRs predominantly belonged to the same TAD (Fig. 1c and Extended Data Fig. 1b, c). Similarly, transitions between Hi-C compartments exhibited preferential TAD boundary alignment to the border of the compartment associated with early replication (‘compartment A’; Extended Data Fig. 1d). Hence, early TTR borders separate TADs within compartment A from TADs within a compartment interaction gradient16 along TTRs, whereas late TTR borders have no detectable relationship to TAD structure.
Figure 1. Early timing transition region borders align with topologically associating domains and lamina associated domains.

a, Constant replication timing segments (CTRs) flanking a timing transition region (TTR) are illustrated. b, The average and range of 8,433 aligned TTRs from 5 mESC data sets (top). Vertical axis values are log2 ratios of early over late signal intensities, with more positive values indicating earlier replication timing (and more negative values indicating later timing). Average directionality index values across the same TTRs (bottom). Transition from upstream to downstream bias indicates a topologically associating domain (TAD) boundary near the early border. c, Individual aligned TTRs arranged by distance between early or late borders and upstream to downstream bias transitions. d, Replication timing across individual mESC TADs or lamina associated domains (LADs). UD, U-shaped replication-timing domains.
Extended Data Figure 1. Clustering of early replication-timing borders and TAD boundary alignment at TTRs and A/B compartment transitions.

a, Cumulative density plot showing clustering of timing values at the early and late side of timing transition regions. For each genomic orientation (forward and reverse are shown in right and left columns), timing values are more tightly distributed at the early border than the later border. b, Directionality index data for individual IMR90 TTRs aligned at their early (left) or late (right) borders and arranged by TTR size. Solid black lines indicate the positions of early and late borders in each plot. c, Percentages of ESC TTR borders or random positions that align to TAD boundaries as a function of distance from the TTR centre. Boxplots indicate the positions of TTR borders. d, Percentages of mESC compartment A/B transitions that align to TAD boundaries as a function of distance from the A/B compartment threshold (eigenvector crosses zero). As observed for early TTR borders, more A/B transitions align with TAD boundaries on their compartment A side than on their compartment B side, which aligns with TAD boundaries at near random frequency.
Examination of replication timing across TADs (Fig. 1e) revealed, with few exceptions, that TADs were entirely early or late replicating, spanned all or part of a single TTR, or contained converging TTRs that constitute the previously described U-shaped replication-timing domains17. Replication-timing patterns across LADs were remarkably similar except that LADs exclusively replicated during mid to late S phase (Fig. 1e), and TADs that replicated early versus late exhibited clearly distinct levels of lamina association (Extended Data Fig. 2a–c). Consistent with observations that TTRs associate with the nuclear lamina more frequently than CTRs with similar replication timing18, we observed lamina association within late-replicating regions and TTRs (Extended Data Fig. 2d, e), explaining the modest correlation of LADs to replication timing. Although 30% of TTRs did not overlap with a computationally called LAD, these TTRs still associated with the nuclear lamina to some degree (Extended Data Fig. 2f) and may interact preferentially with other repressive sub-nuclear compartments19,20,21. Together, these results revealed that TTRs resemble late-replicating regions with no discontinuity at late TTR borders, whereas early TTR borders are strong candidates for the structural boundaries of replication domains.
Extended Data Figure 2. TTRs and late-replicating regions associate with the nuclear lamina.

a, Spearman correlations between genome-wide replication timing and lamina association (top) or observed changes between the indicated mouse cell types. b, Tig3 human fibroblast lamina association across individual IMR90 human fibroblast TADs with early (> 0.5) or late (< −0.5) timing values in IMR90 human fibroblasts. c, Average levels of lamina association across the same early (red) and late (blue) TADs as in b. d, Lamina association in mESCs across individual mESC TTRs aligned as in Fig. 1b, c. TTRs were ordered in the heatmap by the distance between each early TTR border and the nearest downstream LAD. e, Heatmaps show lamina association and replication timing across aligned LADs ± 400 kb. LADs were oriented with earlier replication timing to the left and ordered from top to bottom by the replication timing of the left LAD border. Averages for all LADs (grey) and the earliest (blue), middle (green), and latest (red) thirds are overlaid in the plots below. LADs on average replicate later than the surrounding genomic space and replication timing has little effect on the strength of lamina association. Interestingly, the left plot reveals a consistently sized gap ∼100 kb in size separating neighbouring LADs. f, Average replication timing (blue or red) and lamina association (purple or green) are shown across aligned TTRs ± 400 kb that either overlap with LADs (70%) or do not (30%). TTRs that do not overlap with called LADs still associate with the nuclear lamina to some degree.
Localizing the replication domain boundary to early TTR borders (hereafter referred to as replication domain boundaries) prompted us to devise a more precise algorithm to map replication domain boundaries. We included replication-timing data generated by Repli-seq (see Methods for details), and other human data sets for a total of 42 human data sets (Extended Data Table 1). We compared calls from replicate data sets to measure the technical variability with which replication domain boundaries were defined using our methods (Extended Data Fig. 3). Since both Repli-chip (microarray analysis, see Methods for details) and Repli-seq protocols analyse cell populations and use replicated fragments that are several hundred kilobases (due to labelling time), differences in the breadth and depth of sequencing or array data point spacing along the chromosome have little effect on resolution2,4. Accordingly, Repli-chip and Repli-seq data from the same cell types demonstrated a high degree of overlap between calls (Extended Data Fig. 3).
Extended Data Table 1.
Replication timing data sets used in this study

*RD indicates data set is publicly available at (http://www.replicationdomain.com).
Extended Data Figure 3. Replication domain boundary calls are reproducible in replicate data sets.

a, Histograms of distances between replication domain boundary calls and the nearest calls made in a separate data set from the same cell type. Four lymphoblastoid Repli-chip data sets (top left) were compared to each other and five lymphoblastoid Repli-seq data sets (top right) were compared to each other. The four lymphoblastoid Repli-chip data sets were then compared to the five Repli-seq data sets (bottom left). b, Boxplots for the same data from a are also shown.
To determine the stability of replication domains during development, we generated a list of unique replication domain boundaries and classified each boundary as either ‘TTR-present’ or ‘TTR-absent’ in each available cell type (Fig. 2a). By examining the overlap of TAD boundaries with the compiled list of replication domain boundaries, we found that nearly all TAD boundaries corresponded to a replication domain boundary (Fig. 2b). Importantly, a majority corresponded to replication domain boundaries that were TTR-absent in cells where the TADs were mapped (IMR90 cells), supporting the conclusion that TADs are stable during development and function as replication domains. The fraction of TAD boundaries that did not align with any replication domain boundary is expected due to the portion of the genome with constitutive replication timing in the cell types for which data were available. Although nearly all TAD boundaries corresponded to replication domain boundaries, the reciprocal comparison indicated that many replication domain boundaries did not coincide with a corresponding TAD boundary (Extended Data Fig. 4). Although alignments of either TTR-present or TTR-absent replication domain boundaries to TAD boundaries were statistically significant (Fig. 2c), alignment to TTR-absent replication domain boundaries was not as strong (Fig. 2c), explained by incomplete TAD annotation and the observation that small TTRs lack a detectable relationship with TADs (Extended Data Fig. 5 and Supplementary Discussion).
Figure 2. TADs align with TTRs from different cell types.
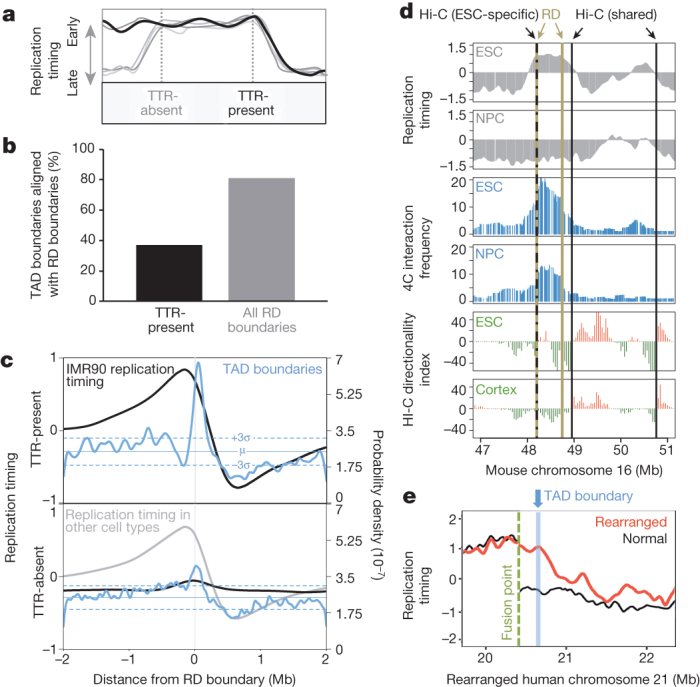
a, Illustrated examples of one TTR-present and one TTR-absent replication domain (RD) boundary. b, Percentage of IMR90 TAD boundaries overlapping TTR-present or all replication domain boundaries. c, Probability density functions for IMR90 TAD boundaries and average IMR90 replication-timing profiles across replication domain boundaries. Mean and 3 standard deviations from the mean random density are indicated. d, Replication timing (top), 4C (middle), and directionality index (bottom) across the Dppa2 locus in mouse ESCs and NPCs. e, Replication timing across a chromosome rearrangement and the normal profile with the nearest TAD boundary indicated.
Extended Data Figure 4. Increasing the resolution of Hi-C analysis increases the number of called TAD boundaries and alignment with replication domain boundaries.

a, Histograms of TAD sizes for original IMR90 calls (bottom, ref. 8) versus calls made using higher resolution IMR90 Hi-C data47 with 40 kb (middle) and 20 kb (top) directionality index bin sizes. b, An example region of the IMR90 replication timing profile (grey) is shown with TTR-present and TTR-absent replication domain boundaries indicated by vertical blue lines. Directionality index plots for each of the Hi-C data sets from panel a are shown across the same region with the 5′ TAD boundaries (start) indicated by solid red lines and the 3′ TAD boundaries (end) indicated by dotted black lines. c, Overlap of TAD boundaries using original or higher resolution data with TTR-present (black) or all (grey) replication domain boundaries (top left) is shown within 175 kb. The reciprocal comparison is shown below. The percentage of replication domain boundaries that overlap with TAD boundaries increases when additional TAD boundaries are identified using higher resolution data, while the percentage of TAD boundaries that overlap with replication domain boundaries is unchanged. The overlap in each case is significant (P < 10−77) relative to overlap with random positions (right).
Extended Data Figure 5. Alignment of replication domain and TAD boundaries.

a, IMR90 (original resolution in grey, high resolution with 20 kb bins in black) or H1 hESC (red) TAD boundary frequency for regions with the same replication timing in both cell lines. b, TAD boundary alignment to IMR90 replication domain boundary subsets based on IMR90 TTR properties. Random alignment was calculated based on the distribution of timing values within each subset. c, TAD boundary frequency for regions with different replication timing in IMR90 and H1 hESCs. d, Alignments for IMR90 replication domain boundaries as in b using TTR properties in all cell types. e, IMR90 TAD boundary probability density across small IMR90 TTRs that either do not (top) or do (bottom) coincide with larger TTRs (timing difference > 1.5) in other cell types. f, Histograms show the distribution of probability densities from Fig. 2c for TAD boundaries within 2 Mb of TTR-present (top) and TTR-absent (bottom) IMR90 replication domain boundaries (blue) or an equal number of random positions (grey). Vertical red lines mark the mean and three standard deviations from the mean random density. g, Percentages of TTR-present (top) and TTR-absent (bottom) IMR90 replication domain boundaries that aligned to TAD boundaries as a function of distance (red) are plotted with a random control (black). The significance of alignment is also shown (grey). The vertical dashed line indicates the distance at which alignment is most significant, while the vertical solid line indicates the distance at which alignment is most different from the control.
To corroborate TAD stability across cell types, we also compared TAD calls to high-resolution chromosome conformation capture-on-chip (4C) interaction frequency data across a replication domain that switches replication timing during mouse ESC differentiation to neural precursors22. In ESCs, where TTRs flank this domain, TAD boundaries and marked decreases in 4C interaction frequency are apparent near both replication domain boundaries (ESC panels in Fig. 2d). However, in differentiated cells, where the replication domain is replicated at the same time as its neighbours, a TAD boundary is no longer called at the leftmost replication domain boundary, even though a sharp decrease in interaction frequency is detected by the higher-resolution 4C (NPC and cortex panels in Fig. 2d). Thus, the TAD boundary at this cell-type-specific TTR is stable during differentiation even though it is not identified as such by this Hi-C data set, providing additional evidence that TAD annotation is incomplete. To demonstrate the functional relationship between TADs and replication domains, we also compared the positions of TADs to replication-timing shifts observed previously at points of chromosome rearrangement7. Figure 2e shows a rearrangement that joined otherwise early- and late-replicating regions. In this example, early replication appears to have spread into the late region up to a point that coincides with the nearest TAD boundary, where a new TTR was formed. Similar results were observed for additional examples (Extended Data Fig. 6). Taken together, these results provide compelling evidence that TADs act as stable units of replication-timing regulation during development.
Extended Data Figure 6. Replication-timing shifts at chromosome rearrangements are restrained by TAD boundaries.

a, Distribution of early (blue) and late (grey) TTR borders within aligned, adjacent TADs for all TTRs (left), or TTRs that start in early (centre, timing > 0.5) or middle (right, timing ≤ 0.5) S phase. The right boundary of TAD 0 is nearest each early border and TADs 1–3 are neighbouring TADs in the direction of the timing transition (earlier to later from left to right). b, Histogram of replication domain sizes. c, Plots as in Fig. 2e show replication timing (red) across four rearrangement points (vertical green lines) that juxtapose otherwise early- and late-replicating regions on human chromosome 21 overlaid on the normal profile (black). Secondary rearrangement points (vertical grey lines) that joined regions with similar replication timing are also shown. The TAD boundary (vertical blue line) nearest to the fusion point is also indicated. In the examples at the top and bottom left, the shift forms a new TTR with its early border coinciding with the nearest TAD boundary. As in the other examples, the shift in the bottom right plot also does not extend beyond the nearest detected TAD boundary, but the TTR formed does not align with a called TAD boundary.
To identify candidate factors involved in the developmental regulation of replication domains, we next compared replication domain boundaries to histone modifications, transcription factor binding sites, and DNase I hypersensitive sites (DHS) mapped by the ENCODE consortia6,23. We aligned over 200 chromatin features to TTR-present replication domain boundaries in 7 mouse and 13 human cell types and found that only LAD boundaries were highly enriched in all the cell types where data were available (Fig. 3a, b and Extended Data Fig. 7). Notably, SUZ12 is a component of the Polycomb repressive complex 2 responsible for the H3K27me3 modification24, and both SUZ12 and H3K27me3 were enriched at TTR-present replication domain boundaries in ESCs (Fig. 3a and Extended Data Fig. 7). However, strong enrichment was not observed in all cell types. Moreover, analysis of replication timing in Suz12 knockout mESCs, which exhibit global loss of H3K27me3 (refs 25, 26), showed no significant differences in replication timing relative to a wild-type control (R = 0.95).
Figure 3. TTR-present replication domain boundaries separate permissive and repressed chromatin domains.
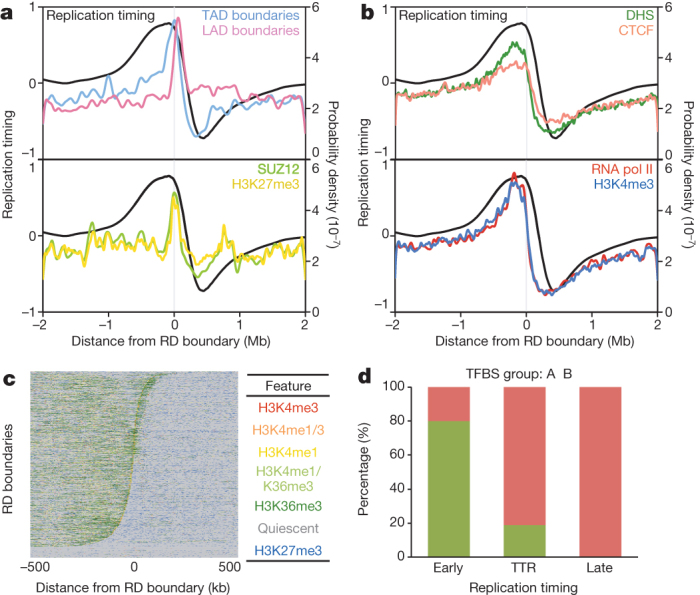
a, b, Probability density functions for chromatin features and replication timing across mESC TTR-present replication domain boundaries. c, Chromatin states across the same boundaries. d, True versus predicted classification rates comparing the predicted classes of an unsupervised model trained on binding profiles for seven transcription factors (CTCF, HCFC1, MAFK, P300, RNA Pol II, ZC3H11A, and ZNF384) versus actual replication timing for all mESC TADs. TADs considered ‘early’ by replication timing predominantly composed class A, whereas ‘TTR’ and ‘late’ TADs predominantly composed class B. TFBS, transcription factor binding sites data.
Extended Data Figure 7. Alignment of TTR-present replication domain boundaries to chromatin features.

Plots as in Fig. 3a, b show probability density functions (green curves) for selected chromatin features within 4 Mb of aligned replication domain boundaries in the indicated cell types. A vertical grey line indicates the replication domain boundary position and a vertical green line indicates the average position of maximum enrichment in replicate data sets, which is listed at the top left of each graph. Horizontal solid and dashed lines indicate the mean and three standard deviations from the mean probability density of each feature about an equal number of random positions.
Previously, we and others reported enrichment of other marks at early TTR borders (DHS27; CCCTC-binding factor (CTCF)17) or nearby (∼100 kb inside early CTRs) (H3K4me1/2/3, H3K36me3, and H3K27ac4). Enrichment peaks for these marks were broad and extended into the neighbouring early regions (Fig. 3b and Extended Data Fig. 7), indicating that these properties are enriched within early regions6, and partitioned at the replication domain boundary, but we found no evidence to suggest that these individual marks are locally enriched at replication domain boundaries in all cell types. Consistent with the enrichment of these marks throughout early regions, combinatorial analysis of histone modifications (H3K4me1/3, H3K27me3, H3K36me3) revealed a relatively abrupt transition near replication domain boundaries between broad regions with either transcriptionally active or repressive chromatin marks (Fig. 3c), providing further evidence that ‘TTR-present’ replication domain boundaries partition chromatin states. We also previously reported enrichment of short-interspersed nuclear elements (SINEs) at TAD boundaries8, but this apparent enrichment at boundaries was due to differential enrichment among TADs (Extended Data Fig. 8 and Supplementary Discussion). Similarly, densities of several DNA repeats and motifs were partitioned at replication domain boundaries and transitions in nucleotide skew (‘N-domain’ boundaries28) were enriched near replication domain boundaries (Extended Data Fig. 7). Metazoan genomes have been segmented into a manually selected number of chromatin classes29 that correlate with replication timing30. By combining data for seven factors (CTCF, HCFC1, MAFK, P300, RNA Pol II, ZC3H11A, and ZNF384), we assigned each TAD into classes using an unsupervised approach (Supplementary Discussion). We obtained two TAD classes, termed A and B, indicating the presence of clearly recognizable differences in the transcription factor composition of these classes, as well as clear similarities within each class. Class A corresponded to early TADs, whereas class B corresponded to TADs within either TTRs or late regions (Fig. 3d), with an overall error rate of 16%. The relatively high enrichment of HCFC1, MAFK, and RNA polymerase II within early versus late replication domains may account for the classes (Extended Data Fig. 9). Similar composition of TTRs and late CTRs provides further evidence that these regions are equivalent and are replicated differently based on their proximity to early replication domains.
Extended Data Figure 8. Alignment of TAD boundaries to chromatin features.

a, Approach for distinguishing local TAD boundary enrichment from differential enrichment among TADs in an aggregate analysis. Before averaging, TADs were oriented such that the analysed feature exhibited a decreasing density from left to right. b, c, SINE-B1 (b) or SINE-Alu (c) density across averaged TAD boundaries oriented (red) as in a or not (grey) are plotted (top). Individual TAD boundaries are shown below with a similar fraction exhibiting local enrichment indicated by blue brackets. d, Average CTCF peak intensity across boundaries from b (top) and c (bottom). e, Degree of local feature enrichment at TAD boundaries (see Methods).
Extended Data Figure 9. Method comparison and summary of transcription factor prediction model.

a, Precision (true positives / (true positives + false positives)), recall (true positives / (true positives + false negatives)), and the f-measure (2 × (precision × recall) / (precision + recall)) are plotted for k-means (top) or hierarchical (bottom) clustering of raw transcription factor composition data or of data mapped on reduced dimensions by principal component analysis or with denoising autoencoders (labelled as PCA and dAE x-dimensions, respectively). The metrics for each label were averaged and weighted by the number of true instances to account for label imbalance, thus the f-measure can give scores that are not between precision and recall. Clusters of low layer representations were as good as those of high layer representations. Since the first dAE layer is a nonlinear principal component analysis, we can say that higher layers of the stack do not affect the ability to separate the data while reducing dimensionality. b, Sums of the L2 distances between data points and the centre of their assigned k-means cluster are plotted. This is the same measure that was minimized by the clustering algorithm. The labels on the y axis follow the convention used in a. Clustering the representations after each layer showed how the data became more and more separable at higher layers. c, The plot shows the distribution of the sum of the normalized transcription factor profile signal for each class assigned by the model.
Our results support a unifying model in which TADs are stable regulatory units of replication timing (Fig. 4). In this ‘replication-domain model’, DNA synthesis begins within TADs that reside in the nuclear interior and contain features permissive for transcription. Meanwhile, replication gradually advances into adjacent later-replicating TADs that reside at the nuclear periphery or other repressive compartments and contain features associated with repressed transcription. This gradual progression forms a TTR that extends from the boundary separating early and late TADs to a context-dependent point (that is, independent of TAD structure, Extended Data Fig. 6a) determined by replication rate and time elapsed before replication origins throughout adjacent later-replicating TADs and the resulting forks merge. Similarly, TADs replicated by active origin firing in mid S phase form TTRs that extend into adjacent later-replicating TADs (Extended Data Fig. 6a). By contrast, timing transitions do not form at boundaries between adjacent TADs residing in the same compartment due to coincidence of initiation events within their structural boundaries. Upon differentiation, TADs that switch replication timing acquire features associated with their new sub-nuclear compartment while their preexisting structural boundaries establish new compartment boundaries. The demonstration that TADs are units of regulation reveals an important organizational principle of mammalian genomes and represents a critical step towards understanding mechanisms regulating replication timing. Determining whether replication timing dictates chromatin structure within TADs to influence chromatin interactions or vice versa will be an important area of future investigation.
Figure 4. The replication domain model.

Top left, replication timing across three TADs replicated late in cell type 1. Early initiation of flanking regions forms TTRs that extend from the left and right boundaries of TADs 1 and 3 respectively until origins throughout the late-replicating region fire. Top right, TADs 1–3 arrange in transcriptionally repressive compartments of the nucleus. Bottom left, in cell type 2, TAD2 is replicated early, creating new TTRs at pre-existing TAD boundaries. Bottom right, the switch to early replication is associated with diminished interaction with the nuclear lamina and increased interaction with other early-replicating TADs.
Methods
Generation of replication timing data
Protocols for generating and quality control for replication timing data from microarray hybridization (Repli-chip) or sequencing (Repli-seq) were performed as previously described2,3,31. CH12, MEL, Gm12878, Gm12801, Gm12812, Gm12813, HeLa-S3, HepG2, HUVEC, IMR90, MCF-7, Sk-N-Sh and NHEK cells were obtained and grown according to standard ENCODE cell culture protocols32. Wild-type control and Suz12 knockout naive mESCs were derived from the previously described strain25 and obtained from Anne Laugesen and Kristian Helin and cultured in 2i+LIF medium as previously described33. Previously published Repli-chip2,4,34,35,36,37,38,39 and Repli-seq3 data sets were also used in this study (Extended Data Table 1).
Analysis of aligned TTRs
Regions surrounding each of the 8,433 TTRs called in all mESC data sets6 were aligned by assigning a fixed number of evenly spaced windows from 100 kb downstream of the early boundary to 100 kb upstream of the late boundary. The number of windows depended on the type of data being analysed but was suited for 400 kb, in effect treating each TTR as if it were 600 kb (mean TTR length). Averaged mESC replication-timing profiles6 and lamina-association data9 were collected in 10-kb windows and DI data8 were collected in 40-kb windows surrounding called TTRs. Smoothed intervals containing 95% of the replication-timing data were plotted using custom R scripts.
Analysis of aligned TADs and LADs
Averaged mESC replication-timing profiles6 were aligned across TADs and LADs by assigning data into a fixed number of evenly spaced windows across their length, respectively suited for their median lengths of 800 kb (80 windows) and 450 kb (45 windows). Similarly, Tig3 lamina association data40 were assigned to evenly spaced windows across IMR90 TADs. IMR90 TADs were subdivided into 3 classes (that is, ‘early’, ‘TTR’, ‘late’) depending on both the means and standard deviations of IMR90 replication timing within each TAD. Early TADs had mean replication timing > 0.9 and standard deviation < 0.25, late TADs had mean replication timing < −0.4 and standard deviation < 0.25, and all others TADs were considered TTR.
Replication domain boundary identification and analysis
Repli-chip data were quantile normalized to the average distribution of data sets generated by the same microarray platform. Repli-seq weighted average data for 1-kb windows were centred about zero and initially normalized to an interquartile range of 1.59, which is equivalent to standard Repli-chip early/late CGH timing values (log2 Cy3/Cy5 enrichment) for individual probes. Repli-seq data sets were then quantile normalized to a combined pool of all Repli-seq points by random sampling. Loess smoothed replication-timing profiles were obtained from each quantile-normalized data set using a smoothing span of 35, 85, 115, and 345 data points for mouse 385k probe Repli-chip, mouse 720k probe Repli-chip, human 720k probe Repli-chip, and human 2M probe Repli-chip data sets respectively or 287–394 data points for human Repli-seq data sets. Replication domain boundaries were identified as the early border of transitions between relatively earlier and later replicating regions in individual data sets with a slope above ± 2.75 × 10⁻⁶ RT units per bp at the early border and with a sustained slope above ± 1× 10⁻⁶ RT units per bp for 200 kb–1 Mb and at least 0.55 RT units and 30, 60, 6, 44 and 165 data points for mouse 385k probe Repli-chip, mouse 720k probe Repli-chip, human 720k probe Repli-chip, human 2M probe Repli-chip data sets, respectively, or 140–192 data points for human Repli-seq data sets. Initial boundary calls were filtered further by removing boundaries within 125 kb of gaps between adjacent data points spanning at least 80, 54.5, 77.5, and 80 kb for mouse 385k probe Repli-chip, mouse 720k probe Repli-chip, human 720k probe Repli-chip, and human 2M probe Repli-chip data sets respectively or 60–100 kb for human Repli-seq data sets. For each cell type, a combined list of boundaries was generated and the positions of similarly oriented boundaries within 105 or 160 kb from each other were averaged for mouse or human, respectively. For each species (mouse and human), the combined lists of boundaries for each cell type was combined and the positions of similarly oriented boundaries within 200 kb from each other were averaged. Finally, a set of unique replication domain boundaries was obtained by averaging any remaining boundaries within 140 or 160 kb for mouse or human, respectively.
Regions surrounding replication domain boundaries were aligned for each feature (for example, TAD boundaries) by combining into a single vector the relative positions of each occurrence of the feature within 2 Mb of the replication domain boundary. Probability density functions were estimated across each vector of relative positions using the density function in the stats R package with a Gaussian kernel and bandwidth adjusted according to Silverman’s rule of thumb41. Replication-timing data across the same regions were averaged in 2kb windows. Lists of TAD domain and boundary coordinates8, lamina-association data and LAD domain coordinates9,40, Origin G-rich repeated elements (OGREs)42, N-domain boundaries28, replication origins and G-quadruplex (G4) motifs with loop sizes from 1 to 15 bases (L1–15)43, housekeeping and tissue-specific gene promoters8, and SUZ12 (ref. 44) and CTR9 (ref. 45) ChIP-seq data were published previously. Lists of repetitive DNA element coordinates were downloaded from (http://repeatmasker.org)46. TFBS, DHS, and histone mark ENCODE data were downloaded from UCSC23,32. If needed, data position coordinates were converted to mm9 or hg19 genome builds using UCSC LiftOver with default settings.
TAD boundary identification
New annotation of IMR90 TADs was performed by calculating an interaction directionality index for IMR90 Hi-C data47. Briefly, the genome was divided into 40-kb windows and for each window the frequency of interaction within 2 Mb upstream of the window to the frequency of interaction within 2 Mb downstream of the window was compared as described previously8. A second directionality index was also calculated for the same data set using a window size of 20 kb and only considering interactions within 1 Mb for each window.
Chromatin state analysis
ChromHMM48 was applied on pooled ChIP-seq mapped reads from replicates for each of four histone modifications (H3K4me3, H3K4me1, H3K36me3, and H3K27me3) in 15 mouse cell lines (G1E, G1E-ER4+E2, erythroblasts, megakaryocytes, CH12, Mel, ESbruce4, thymus, kidney, small intestine, E14 whole brain, liver, spleen, heart, and Testis) and 3 human cell lines (Gm12878, H1 hESC, and K562) to learn a multivariate HMM model for genome segmentation. Mapped reads were first processed into binarized data in 200-bp windows over the mapped genome, with ChIP input reads as the background control. To learn the model jointly from mouse and human, a pseudo genome table was first constructed by concatenating mouse (mm9) and human (hg19) tables. A model was then learned from all binarized data, giving a set of emission parameters and transition parameters, which was used to produce segmentations based on the most likely state assignment of the model. The eight-state model used in this paper appeared most parsimonious in the sense that all eight states had clearly distinct emission properties, while the interpretability of distinction between states in models with additional states was less clear.
TAD boundary orientation and analysis
For each analysed feature, data surrounding TAD boundaries were aligned in 10-kb windows from 500 kb upstream to 500 kb downstream of each TAD boundary. The considered regions were then inverted if the average feature density downstream of the TAD boundary was greater than the average feature density upstream of the TAD boundary, so that feature density decreased from left to right across each boundary. After orienting TAD boundaries in this manner, each window was averaged for all TAD boundaries. Local boundary enrichment was then evaluated by comparing the average density of windows within 20 kb of the TAD boundary to the average density of windows 140–430 kb away from the TAD boundary on the side with increased density.
Transcription factor combination model
Raw data from genome-wide ChIP-seq in vivo detection of transcription factor binding49 were processed in 200 bp bins over a 1 Mb window around the centre of each mESC TAD. Each sample can be thought as a 2-dimensional matrix with rows for seven transcription factor activity profiles and each row represented as a real vector with values for each bin in the 1 Mb window (number of bins = 5,000). The value Xijk represented the activity (that is, peak enrichment) of transcription factor j, k bins from the centre of TAD i. The model consists of a stack of 6 sigmoid denoising autoencoders, which define parameterized feature extraction (encoder) and reconstruction functions (decoder). The encoder projects the data into a smaller dimension feature space and the decoder reconstructs the input from the feature space. The parameters of the functions are optimized to give the smallest reconstruction error over all the training data samples. Although similar in principle to PCA (they both can be used as dimensionality reduction techniques), the denoising auto-encoder learns a nonlinear mapping between the input and its representation. Furthermore, constraints on the input and feature dimension sizes and the addition of noise to the input force it to learn important structure in the input. The stack reduces input dimensions gradually from (7 × 5,000), (7 × 10,00), (7 × 200), (7 × 60), (7 × 30), (7 × 20), to (7 × 10). Each autoencoder injects an additive binomial noise with a 20% corruption rate. We initialized weights at small random values with mean zero and used minibatch stochastic gradient descent50 to minimize the mean squared input reconstruction error. We trained on 200 random samples for 500 epochs each layer then used the model to transform all other samples. Model output was evaluated using gold standard labels based on both the means and standard deviations of mESC replication timing within each TAD. Early TADs had mean replication timing > 0 and standard deviation < 0.25, late TADs had mean replication timing < 0 and standard deviation < 0.25, and all others TADs were considered TTR. The programs we wrote to perform the analysis are based heavily on scikitlearn, dimer and their dependencies. To build data sets and train denoising auto-encoders we used dimer Version 0.1 (https://bitbucket.org/gertidenas/dimer/commits/tag/TADS). To perform PCA, cluster the data, and evaluate models, we used scikitlearn Version 0.14-git (http://scikit-learn.org/).
Supplementary information
This file contains a Supplementary Discussion and additional references. (PDF 162 kb)
Acknowledgements
We thank A. Laugesen, G. Andersen and K. Helin for providing Suz12 control and knockout naive mESC lines. We thank F. Ay, M. Libbrecht, W. S. Noble, E. Besnard, J. M. LeMaitre, C. Cayrou, M. Mechali and J. Dekker for helpful discussions. This research was supported by NIH grants GM083337 and GM085354 to D.M.G., HG005602 to M.P.S., HG005573 and DK065806 to R.C.H., and HG003991 to B.R. B.D.P. is supported by the National Cancer Institute of the National Institutes of Health under award number F31CA165863.
Extended data figures and tables
PowerPoint slides
Source data
Author Contributions
B.D.P., T.R., M.P.S., J.A.S., J.T., R.C.H. and D.M.G. devised experiments; B.D.P., T.R., V.D., Y.W., R.S.H. and T.K.C. generated data; B.D.P., T.R., V.D., F.Y., W.W., O.D., D.L.V., Y.W., R.E.T., Y.C., G.G. and T.K. analysed data; B.D.P., T.R., V.D., W.W., O.D., D.L.V., R.E.T., J.H.D., T.K., B.R. and D.M.G. wrote the manuscript.
Accession codes
Primary accessions
Gene Expression Omnibus
Competing interests
The authors declare no competing financial interests.
Footnotes
All data analysed in this study is accessible at GEO (GSE51334) (http://www.replicationdomain.org), and the UCSC genome browser (http://genome.ucsc.edu/). Replication domain and TAD boundary lists generated for this study are available at the Mouse ENCODE portal website (http://mouseencode.org) and scripts are available at GitHub (https://github.com/popeb/MCP05).
Benjamin D. Pope and Tyrone Ryba: These authors contributed equally to this work.
References
- 1.Wright ML, Grützner F, Seligmann H. DNA Replication Current Advances. 2011. [Google Scholar]
- 2.Hiratani I, et al. Global reorganization of replication domains during embryonic stem cell differentiation. PLoS Biol. 2008;6:e245. doi: 10.1371/journal.pbio.0060245. [DOI] [PMC free article] [PubMed] [Google Scholar]
- 3.Hansen RS, et al. Sequencing newly replicated DNA reveals widespread plasticity in human replication timing. Proc. Natl Acad. Sci. USA. 2010;107:139–144. doi: 10.1073/pnas.0912402107. [DOI] [PMC free article] [PubMed] [Google Scholar]
- 4.Ryba T, et al. Evolutionarily conserved replication timing profiles predict long-range chromatin interactions and distinguish closely related cell types. Genome Res. 2010;20:761–770. doi: 10.1101/gr.099655.109. [DOI] [PMC free article] [PubMed] [Google Scholar]
- 5.Yaffe E, et al. Comparative analysis of DNA replication timing reveals conserved large-scale chromosomal architecture. PLoS Genet. 2010;6:e1001011. doi: 10.1371/journal.pgen.1001011. [DOI] [PMC free article] [PubMed] [Google Scholar]
- 6.Yue, F. et al. A comparative encyclopedia of DNA elements in the mouse genome. Nature10.1038/nature13992 (this issue) [DOI] [PMC free article] [PubMed]
- 7.Pope BD, et al. Replication-timing boundaries facilitate cell-type and species-specific regulation of a rearranged human chromosome in mouse. Hum. Mol. Genet. 2012;21:4162–4170. doi: 10.1093/hmg/dds232. [DOI] [PMC free article] [PubMed] [Google Scholar]
- 8.Dixon JR, et al. Topological domains in mammalian genomes identified by analysis of chromatin interactions. Nature. 2012;485:376–380. doi: 10.1038/nature11082. [DOI] [PMC free article] [PubMed] [Google Scholar]
- 9.Peric-Hupkes D, et al. Molecular maps of the reorganization of genome–nuclear lamina interactions during differentiation. Mol. Cell. 2010;38:603–613. doi: 10.1016/j.molcel.2010.03.016. [DOI] [PMC free article] [PubMed] [Google Scholar]
- 10.Nora EP, et al. Spatial partitioning of the regulatory landscape of the X-inactivation centre. Nature. 2012;485:381–385. doi: 10.1038/nature11049. [DOI] [PMC free article] [PubMed] [Google Scholar]
- 11.Phillips-Cremins JE, et al. Architectural protein subclasses shape 3D organization of genomes during lineage commitment. Cell. 2013;153:1281–1295. doi: 10.1016/j.cell.2013.04.053. [DOI] [PMC free article] [PubMed] [Google Scholar]
- 12.Filippova D, Patro R, Duggal G, Kingsford C. Identification of alternative topological domains in chromatin. Algorithms Mol. Biol. 2014;9:14. doi: 10.1186/1748-7188-9-14. [DOI] [PMC free article] [PubMed] [Google Scholar]
- 13.Meuleman W, et al. Constitutive nuclear lamina–genome interactions are highly conserved and associated with A/T-rich sequence. Genome Res. 2013;23:270–280. doi: 10.1101/gr.141028.112. [DOI] [PMC free article] [PubMed] [Google Scholar]
- 14.Rhind N, Yang SC-H, Bechhoefer J. Reconciling stochastic origin firing with defined replication timing. Chromosome Res. 2010;18:35–43. doi: 10.1007/s10577-009-9093-3. [DOI] [PMC free article] [PubMed] [Google Scholar]
- 15.McGuffee SR, Smith DJ, Whitehouse I. Quantitative, genome-wide analysis of eukaryotic replication initiation and termination. Mol. Cell. 2013;50:123–135. doi: 10.1016/j.molcel.2013.03.004. [DOI] [PMC free article] [PubMed] [Google Scholar]
- 16.Imakaev M, et al. Iterative correction of Hi-C data reveals hallmarks of chromosome organization. Nature Methods. 2012;9:999–1003. doi: 10.1038/nmeth.2148. [DOI] [PMC free article] [PubMed] [Google Scholar]
- 17.Baker A, et al. Replication fork polarity gradients revealed by megabase-sized U-shaped replication timing domains in human cell lines. PLOS Comput. Biol. 2012;8:e1002443. doi: 10.1371/journal.pcbi.1002443. [DOI] [PMC free article] [PubMed] [Google Scholar]
- 18.Farkash-Amar S, et al. Systematic determination of replication activity type highlights interconnections between replication, chromatin structure and nuclear localization. PLoS ONE. 2012;7:e48986. doi: 10.1371/journal.pone.0048986. [DOI] [PMC free article] [PubMed] [Google Scholar]
- 19.Kind J, et al. Single-cell dynamics of genome-nuclear lamina interactions. Cell. 2013;153:178–192. doi: 10.1016/j.cell.2013.02.028. [DOI] [PubMed] [Google Scholar]
- 20.van Koningsbruggen S, et al. High-resolution whole-genome sequencing reveals that specific chromatin domains from most human chromosomes associate with nucleoli. Mol. Biol. Cell. 2010;21:3735–3748. doi: 10.1091/mbc.E10-06-0508. [DOI] [PMC free article] [PubMed] [Google Scholar]
- 21.Németh A, et al. Initial genomics of the human nucleolus. PLoS Genet. 2010;6:e1000889. doi: 10.1371/journal.pgen.1000889. [DOI] [PMC free article] [PubMed] [Google Scholar]
- 22.Takebayashi S, Dileep V, Ryba T, Dennis JH, Gilbert DM. Chromatin-interaction compartment switch at developmentally regulated chromosomal domains reveals an unusual principle of chromatin folding. Proc. Natl Acad. Sci. USA. 2012;109:12574–12579. doi: 10.1073/pnas.1207185109. [DOI] [PMC free article] [PubMed] [Google Scholar]
- 23.The ENCODE Project Consortium An integrated encyclopedia of DNA elements in the human genome. Nature. 2012;489:57–74. doi: 10.1038/nature11247. [DOI] [PMC free article] [PubMed] [Google Scholar]
- 24.Shen X, et al. EZH1 mediates methylation on histone H3 lysine 27 and complements EZH2 in maintaining stem cell identity and executing pluripotency. Mol. Cell. 2008;32:491–502. doi: 10.1016/j.molcel.2008.10.016. [DOI] [PMC free article] [PubMed] [Google Scholar]
- 25.Pasini D, Bracken AP, Jensen MR, Denchi EL, Helin K. Suz12 is essential for mouse development and for EZH2 histone methyltransferase activity. EMBO J. 2004;23:4061–4071. doi: 10.1038/sj.emboj.7600402. [DOI] [PMC free article] [PubMed] [Google Scholar]
- 26.Pasini D, et al. Characterization of an antagonistic switch between histone H3 lysine 27 methylation and acetylation in the transcriptional regulation of Polycomb group target genes. Nucleic Acids Res. 2010;38:4958–4969. doi: 10.1093/nar/gkq244. [DOI] [PMC free article] [PubMed] [Google Scholar]
- 27.Audit B, et al. Open chromatin encoded in DNA sequence is the signature of ‘master’ replication origins in human cells. Nucleic Acids Res. 2009;37:6064–6075. doi: 10.1093/nar/gkp631. [DOI] [PMC free article] [PubMed] [Google Scholar]
- 28.Huvet M, et al. Human gene organization driven by the coordination of replication and transcription. Genome Res. 2007;17:1278–1285. doi: 10.1101/gr.6533407. [DOI] [PMC free article] [PubMed] [Google Scholar]
- 29.Filion GJ, et al. Systematic protein location mapping reveals five principal chromatin types in Drosophila cells. Cell. 2010;143:212–224. doi: 10.1016/j.cell.2010.09.009. [DOI] [PMC free article] [PubMed] [Google Scholar]
- 30.Julienne H, Zoufir A, Audit B, Arneodo A. Human genome replication proceeds through four chromatin states. PLOS Comput. Biol. 2013;9:e1003233. doi: 10.1371/journal.pcbi.1003233. [DOI] [PMC free article] [PubMed] [Google Scholar]
- 31.Ryba T, Battaglia D, Pope BD, Hiratani I, Gilbert DM. Genome-scale analysis of replication timing: from bench to bioinformatics. Nature Protocols. 2011;6:870–895. doi: 10.1038/nprot.2011.328. [DOI] [PMC free article] [PubMed] [Google Scholar]
- 32.Mouse ENCODE Consortium et al. An encyclopedia of mouse DNA elements (Mouse ENCODE). Genome Biol.13, 418 (2012) [DOI] [PMC free article] [PubMed]
- 33.Ying Q-L, et al. The ground state of embryonic stem cell self-renewal. Nature. 2008;453:519–523. doi: 10.1038/nature06968. [DOI] [PMC free article] [PubMed] [Google Scholar]
- 34.Hiratani I, et al. Genome-wide dynamics of replication timing revealed by in vitro models of mouse embryogenesis. Genome Res. 2010;20:155–169. doi: 10.1101/gr.099796.109. [DOI] [PMC free article] [PubMed] [Google Scholar]
- 35.Ryba T, et al. Abnormal developmental control of replication timing domains in pediatric acute lymphoblastic leukemia. Genome Res. 2012;22:1833–1844. doi: 10.1101/gr.138511.112. [DOI] [PMC free article] [PubMed] [Google Scholar]
- 36.Ryba T, et al. Replication timing: a fingerprint for cell identity and pluripotency. PLOS Comput. Biol. 2011;7:e1002225. doi: 10.1371/journal.pcbi.1002225. [DOI] [PMC free article] [PubMed] [Google Scholar]
- 37.Pope BD, et al. DNA replication timing is maintained genome-wide in primary human myoblasts independent of D4Z4 contraction in FSH muscular dystrophy. PLoS ONE. 2011;6:e27413. doi: 10.1371/journal.pone.0027413. [DOI] [PMC free article] [PubMed] [Google Scholar]
- 38.Chandra T, et al. Independence of repressive histone marks and chromatin compaction during senescent heterochromatic layer formation. Mol. Cell. 2012;47:203–214. doi: 10.1016/j.molcel.2012.06.010. [DOI] [PMC free article] [PubMed] [Google Scholar]
- 39.Lu J, Li F, Murphy CS, Davidson MW, Gilbert DM. G2 phase chromatin lacks determinants of replication timing. J. Cell Biol. 2010;189:967–980. doi: 10.1083/jcb.201002002. [DOI] [PMC free article] [PubMed] [Google Scholar]
- 40.Guelen L, et al. Domain organization of human chromosomes revealed by mapping of nuclear lamina interactions. Nature. 2008;453:948–951. doi: 10.1038/nature06947. [DOI] [PubMed] [Google Scholar]
- 41.Silverman BW. Density Estimation for Statistics and Data Analysis. 1998. [Google Scholar]
- 42.Cayrou C, et al. Genome-scale analysis of metazoan replication origins reveals their organization in specific but flexible sites defined by conserved features. Genome Res. 2011;21:1438–1449. doi: 10.1101/gr.121830.111. [DOI] [PMC free article] [PubMed] [Google Scholar]
- 43.Besnard E, et al. Unraveling cell type-specific and reprogrammable human replication origin signatures associated with G-quadruplex consensus motifs. Nature Struct. Mol. Biol. 2012;19:837–844. doi: 10.1038/nsmb.2339. [DOI] [PubMed] [Google Scholar]
- 44.Chen X, et al. Integration of external signaling pathways with the core transcriptional network in embryonic stem cells. Cell. 2008;133:1106–1117. doi: 10.1016/j.cell.2008.04.043. [DOI] [PubMed] [Google Scholar]
- 45.Rahl PB, et al. c-Myc regulates transcriptional pause release. Cell. 2010;141:432–445. doi: 10.1016/j.cell.2010.03.030. [DOI] [PMC free article] [PubMed] [Google Scholar]
- 46.Smit, A. F. A., Hubley, R. & Green, P. RepeatMasker Open-3.0. (1996)
- 47.Jin F, et al. A high-resolution map of the three-dimensional chromatin interactome in human cells. Nature. 2013;503:290–294. doi: 10.1038/nature12644. [DOI] [PMC free article] [PubMed] [Google Scholar]
- 48.Ernst J, Kellis M. ChromHMM: automating chromatin-state discovery and characterization. Nature Methods. 2012;9:215–216. doi: 10.1038/nmeth.1906. [DOI] [PMC free article] [PubMed] [Google Scholar]
- 49.Visel A, et al. ChIP-seq accurately predicts tissue-specific activity of enhancers. Nature. 2009;457:854–858. doi: 10.1038/nature07730. [DOI] [PMC free article] [PubMed] [Google Scholar]
- 50.Rumelhart DE, Hinton GE, Williams RJ. Learning representations by back-propagating errors. Nature. 1986;323:533–536. [Google Scholar]
Associated Data
This section collects any data citations, data availability statements, or supplementary materials included in this article.
Supplementary Materials
This file contains a Supplementary Discussion and additional references. (PDF 162 kb)