

Abstract
The evolutionary relationships of extinct species are ascertained primarily through the analysis of morphological characters. Character inter-dependencies can have a substantial effect on evolutionary interpretations, but the developmental underpinnings of character inter-dependence remain obscure because experiments frequently do not provide detailed resolution of morphological characters. Here we show experimentally and computationally how gradual modification of development differentially affects characters in the mouse dentition. We found that intermediate phenotypes could be produced by gradually adding ectodysplasin A (EDA) protein in culture to tooth explants carrying a null mutation in the tooth-patterning gene Eda. By identifying development-based character interdependencies, we show how to predict morphological patterns of teeth among mammalian species. Finally, in vivo inhibition of sonic hedgehog signalling in Eda null teeth enabled us to reproduce characters deep in the rodent ancestry. Taken together, evolutionarily informative transitions can be experimentally reproduced, thereby providing development-based expectations for character state transitions used in evolutionary studies.
In the case of extinct mammals, a large number of dental features are used as characters in phylogenetic analyses1–4, and these characters often provide the key evidence for evolutionary inferences due to the preponderance of teeth in the fossil record. For reliable phylogenetic inferences, characters have been typically considered to be independent from each other5–8. Although developmental factors can make characters dependent8–11, thorough analyses of the influence of development on character state changes are lacking. To approximate changes relevant to evolutionary transitions, experiments that tune morphology gradually are required. These kinds of experiments are also useful to evaluate how, and whether, continuous changes in underlying developmental or genetic parameters map to continuous changes in the phenotype12–14.
Here we investigated whether gradual alterations of tooth development can produce gradual changes in the phenotype, and whether these changes reflect known evolutionary transitions. We focused on the development of the rodent dentition, using mice carrying a spontaneously occurring null mutation in ectodysplasin (Eda) as a starting point. This mutation was chosen because the effects of Eda on tooth morphology are relatively subtle, causing simplification of dental morphology without complete loss of teeth10,15, however, the Eda mutation causes changes in many characters and is thus highly informative10.
Experimental tuning of morphology
We reasoned that, to approximate evolutionary transitions, fine-tuning of EDA signalling would be required. We tracked gradual changes during development by crossing Eda null mice with mice that express green fluorescent protein (GFP) from the Shh locus (hereafter called ShhGFP mice16). The epifluorescence of ShhGFP mice can be used to monitor tooth cusp development because Shh is initially expressed in the enamel knots, which are the epithelial signalling centres that form at the positions of future cusps17. Later during differentiation, Shh expression spreads throughout the inner enamel epithelium, enabling the visualization of the overall crown shape.
First, we used EDA protein in culture at increasing concentrations (n = 9 to 16 in each group, Supplementary Table 1, Methods) to test whether the Eda null morphology could be engineered to gradually resemble wild-type morphology. We cultured first lower molars starting at embryonic day 13, just before crown formation begins, and EDA protein was administered into the culture media at days zero and two. This treatment scheme restored EDA signalling during the period of first molar cusp patterning. At this stage, Eda is thought to regulate the size and signalling of enamel knots10, which in turn give rise to tooth cusps.
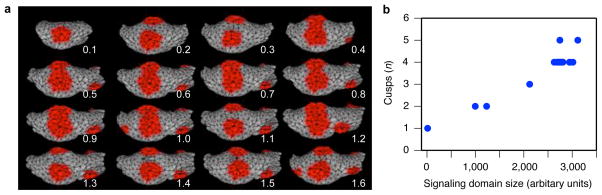
The EDA protein treatments restored the wild-type mouse cusp pattern in culture (Fig. 1a), in agreement with previous experiments18,19. We next examined the mode of cusp appearance in detail by analysing daily time-lapse images of the cultured teeth. The results showed that increasing dosage of EDA caused a heterochronic shift in cusp initiation (Fig. 1a). Specifically, some of the cusps were initiated earlier (predisplaced) as EDA concentration was increased (Fig. 1a, Supplementary Table 1). Furthermore, the time-lapse data showed that increasing EDA concentration enlarged the primary enamel knot, which in turn increased the number of cusps (Fig. 1b, Extended Data Fig. 1). The link between the primary enamel knot size and cusp number (Fig. 1b) indicates that the overall size of the tooth crown needs to reach certain thresholds to accommodate additional cusps. From a developmental signalling point of view, a heterometric20 change in the dosage of EDA signalling can lead to a heterochronic shift in timing of cusp initiation.
Figure 1. Gradual dosage effects of EDA on Eda null mutant first lower molars (m1 in the text]).

a, ShhGFP × Eda null tooth development is rescued by EDA, with higher concentrations reproducing wild type (WT) development (Eda null: n = 15; 10 ng ml−1: n = 15; 50 ng ml−1: n = 13; WT: n = 16; all teeth listed in Supplementary Table 1: n = 113). Initiation of different parts of the tooth crown is shifted earlier with higher EDA concentrations, such as the anteroconid (black arrowheads) and the hypoconulid (white arrowheads). b, Primary enamel knot size at culture day 2 predicts the number of cusps at day 7. Eda null teeth treated with 10 ng ml−1 (open circles) and 50 ng ml−1 (open diamonds) fill in the phenotypic gap between the Eda null (black circles) and wild-type (black diamonds) teeth. Anterior is towards the left in a. Scale bar, 500 μm.
Computational modelling of patterning
Computational modelling has been used to simulate tooth shape development and evolution14,21, and the new developmental data that we obtained allowed us to link models and experiments in unprecedented detail (see Methods). To model the experimental transitions, we implemented a morphodynamic model, which integrates signalling and tissue growth to simulate tooth development21, in the new ToothMaker interface (Extended Data Fig. 2). First we modelled a wild-type mouse tooth morphology corresponding to our cultured teeth (see Methods). Then, by progressively adjusting (mutating) each parameter separately, we simulated the effects of gradual changes in signalling (Extended Data Fig. 3). The in silico simulation reproduced the fusion of cusps both on the talonid and on the trigonid of the Eda null model, as well as rescue of the separate cusps observed in the in vitro experiment (Fig. 2a, Extended Data Fig. 4). Moreover, as predicted from the experimental observations, the full range of transitions from fused trigonid to separate cusps was replicated by varying the activator parameter that induces the formation of enamel knots (Fig. 1a, Extended Data Fig. 4).
Figure 2. Computational modelling of gradual changes in signalling on cusp patterns.

a, Computer simulations using ToothMaker (Extended Data Fig. 2) of first lower molar development show appearance of cusp areas (red colour). Larger values of activator (Act) parameter increase cusps. b, Modelled wild-type mouse pattern is largely retained until Act = 0.5. Smaller Act values quickly reduce cusps resulting in modelled teeth that resemble Eda null teeth. c, Tabulated data from culture experiments (Supplementary Table 1) show an abrupt change in cusps at low levels of EDA protein (2.5 to 10 ng ml−1), similar to modelling data (b). Increasing EDA concentration does not increase cusps beyond wild type (WT). Error bars denote s.d. Anterior is towards the left in a.
The comparable patterns in the experiments (Fig. 1) and the modelling (Fig. 2) underscore the dynamic nature of tooth shape development, and indicate that the identification of cusp homologies should rely on topological correspondences rather than unique, cusp specific gene expression patterns. Furthermore, both the model simulations and the experiments showed a rapid phenotypic response at low levels of activator (Fig. 2b) and EDA signalling (Fig. 2c), respectively, with smaller changes observed at higher levels of signalling. These results imply a potential disjunction between rates of evolution measured in the phenotype and in gene expression level, although by varying more than one parameter at a time, a multivariate linear relationship between expression levels and phenotypes remains possible12,13,19.
Detailed analyses of character states
To examine the full range of morphologies produced in the cultured explants, we tabulated the character states comparable to the ones used in evolutionary studies for each crown region (see Methods and Supplementary Table 1). Although the tooth culturing system does not produce mineralized features, we were able to tabulate the presence or absence of cusps (Fig. 3a) and relative height of the talonid (Fig. 3b) with high resolution.
Figure 3. Differential sensitivities of tooth crown regions to EDA.
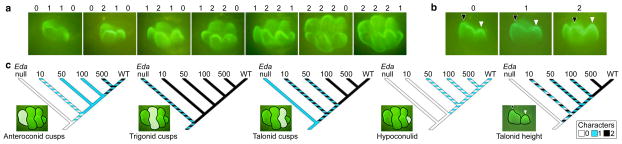
a, Range of tooth morphologies and cuspal character states tabulated at the end of the cultures (day 13 + 7). Character state numbers above first lower molar images correspond to the number of cusps present in the respective region of the crown (Supplementary Table 1). The first trait is for the anteroconid, the second for the trigonid, the third for the talonid and the fourth for the hypoconulid. b, Talonid height characters are tabulated as the height of the talonid (white arrowhead) relative to the trigonid (black arrowhead). c, Differential sensitivities of main regions of tooth crown to EDA show how different parts of the crown have varying trait sensitivities to EDA. For the full range of data, see Supplementary Table 1.
First, the trigonid cusps, the protoconid and the metaconid, are frequently fused in Eda null teeth (40% of explants, Fig. 3c, Supplementary Table 1). The separation of the protoconid and the metaconid in 2.5 ng ml−1 EDA treated teeth reflects a transition that would predate the evolution of the pretribosphenic mammalian pattern11,21.
Next, the talonid, which in Eda null teeth is a shallow shelf lacking well-defined cusps, was already affected in the lowest, 2.5 ng ml−1 EDA treatments by an increase in height, and in the second lowest 10 ng ml−1 treatments by acquisition of additional cusps (Fig. 3c, Supplementary Table 1). These treatments, however, caused polymorphic effects (Fig. 3c). In 47% of 10 ng ml−1 explants, the shallow shelf gave rise to a single cusp, whereas in the remaining explants two distinct cusps formed. These two talonid cusps correspond to the hypoconid and the entoconid cusps in wild-type teeth, and both cusps formed consistently starting at 100 ng ml−1 EDA (Fig. 3c).
During the evolution of tribospheny in Mesozoic mammals, the functional, three cusped talonid was added to the posterior end of the trigonid11,22. This originated in Triassic non-mammalian synapsids where a single cusp, often located on the cingulid, was appended posteriorly to the basal three-cusped trigonid morphology22,23. Although the hypoconid is generally agreed to have evolved before the entoconid22, our data do not allow determination of whether the single cusp in the talonid of cultured teeth is the hypoconid or the entoconid. The central location of the single talonid cusp in our cultured teeth (Figs 1a and 3a) does, however, suggest that the effects of EDA, at least partially, mimic the early steps of talonid evolution.
Finally, the anteroconid and the hypoconulid appear already at 10 ng ml−1 EDA, but unlike in vivo, their wild-type character states remain polymorphic in cultured molars irrespective of treatments (shown by hatched colouring in Fig. 3c). Evolutionarily, these crown features appear in early rodents and are present in the basal murines2,3,24,25. The hypoconulid, however, has been lost in many murine lineages, and this evolutionary lability appears to be reflected in the developmental data.
Taken together, these data show that even though dental characters used in evolutionary analyses may be highly pleiotropic, as shown previously10, transformations of character states can occur at different thresholds of signalling (Fig. 3c). In contrast to the relatively robust trigonid cusps, large variation in talonid structure can be reproduced by small changes of EDA signalling. This has major implications for the evolution of tribosphenic mammals that are diagnosed by their derived talonid features1,11,22, as discussed below.
Testing the experimental predictions
To test the development-based predictions of evolutionary patterns in the talonid, we examined the link between talonid height and cusp number across mammalian species. We first tabulated relative talonid height (as percentage of the trigonid height) and cusp numbers in the entire posterior region of the tooth (the entoconid, the hypoconid and the hypoconulid; see Methods). The results show that talonid height and cusp number are linked developmentally (Fig. 4a, Extended Data Table 1), even though these traits are typically treated as independent characters in evolutionary analyses. In the macroevolutionary context of rodents, the patterns obtained in the experiments appear to bridge the derived state we analysed in 35 species of extant murine rodents, already present in the extinct Miocene early murines Potwarmus and Antemus24,25, and the basal morphology found in Tribosphenomys minutus, a Paleocene mammal that is considered to be a basal rodentiaform2, or the immediate sister taxon of Glires4 (Fig. 4a, Extended Data Table 1).
Figure 4. Testing developmental predictions on evolutionary patterns.
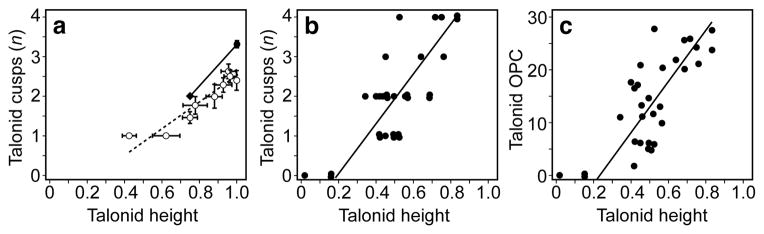
a, Relative height of the m1 talonid (measured as percentage of the trigonid height) in each treatment (open circles, error bars denote s.e.m.) correlates with the number of cusps in the talonid. The experimental data bridges the corresponding values for murine rodent species (n = 35, black circle with s.e.m) and for a basal rodentiaform Tribosphenomys minutus (black diamond). The reduced major axis regression slope for the experimental data including untreated Eda null and wild-type teeth is 3.30 and the intercept is −1.79 (r2 = 0.891) and the corresponding values for only explants with EDA are 4.22 and −1.63 (r2 = 0.946). We note that these slopes can be considered underestimates due to the variably-present hypoconulid cusps in cultured wild-type mouse teeth. b, c, The first lower molars of carnivoran species (n = 32) show correlated changes in the talonid height and cusp number (b) and the talonid height and talonid complexity (c) measured using OPC. The reduced major-axis regression slope for the graph in b is 6.53 and the intercept is −1.38 (r2 = 0.594), and for the graph in c it is 48.24 and the intercept is −10.93 (r2 = 0.562). For data and details see Methods and Extended Data Tables 1–3.
Because our experimental morphologies extend even beyond those found in rodents and towards further reduced talonids (Fig. 4a), we also measured talonid height and cusp number in 32 species of extant carnivorans. The first lower molar, or carnassial, of carnivorans shows arguably the fullest range of talonid morphologies among extant mammals26. The correlated change in carnivoran talonid height and cusp number (Fig. 4b, Extended Data Table 2) is reminiscent of the patterns found in experiments on the mouse (Fig. 4a). Furthermore, this relationship between talonid height and morphology was retained when we replaced cusp number with talonid complexity using orientation patch count (OPC, Fig. 4c). In contrast, the trigonid morphology remained relatively constrained (Extended Data Table 2). OPC, which is calculated as the number of discrete surfaces distinguished by differences in orientation, has been shown to increase across the dietary spectrum from carnivores to omnivores to herbivores in extant mammals27,28. Therefore, even though carnivoran dental diversity is driven by ecological and functional factors, development may have an influence on which parts undergo adaptations more easily.
Taken together, the same developmental cascade, starting from the trigonid, may have contributed both to the initial evolution of the talonid at the base of mammalian evolution and to dental morphological diversification during mammalian radiations. To a lesser degree, the same pattern may hold for the anterior end of the teeth, and it is conceivable that an analogous developmental cascade to the one that produced the talonid also produced the anterior expansion of the crown in pseudo-tribosphenic mammals29. A cascading system of activation-inhibition between teeth has been proposed to regulate molar proportions in mammals30, and in general, much of the evolutionary history of mammalian dentitions may consist of tinkering31 with this pre-existing developmental program.
Retrieving ancestral character states
Despite the overall agreement between experimental and evolutionary patterns, there were small but important differences when compared with the details of rodent evolution. Most notably, the Eda null teeth had fused cusps, which differs from what is found in basal rodentiaforms and close relatives2–4. This difference in morphology indicated that, in addition to EDA signalling, other pathways needed to be adjusted in order to produce the evolutionarily basal morphologies. To address this issue, we considered reducing the required cusp spacing, which can be experimentally adjusted beyond the normal mouse pattern by modulating multiple signalling pathways19. We therefore next set out to engineer mouse teeth that would have additional characters of basal rodents (see Methods).
First, we modelled the reduction in the cusp spacing by decreasing inhibition in the simulated Eda null teeth, which resulted in formation of multiple cusps (Extended Data Fig. 5). Next, because SHH has been shown to inhibit cusp formation by regulating cusp spacing19,32, we cultured Eda null samples with a SHH inhibitor, thereby inhibiting the inhibitor. This treatment also circumvents the tendency of EDA to cause the formation of crests or lophs between cusps10,19,33, which are found in evolutionarily derived rodents. The experimental results validated the in silico model simulations: inhibition of SHH signalling in cultured Eda null teeth caused the development of more distinct cusps, without eliminating evolutionarily basal features of Eda null teeth such as the height difference between trigonid and talonid (Fig. 5a, Extended Data Fig. 6).
Figure 5. Engineering mouse teeth to have basal character states.

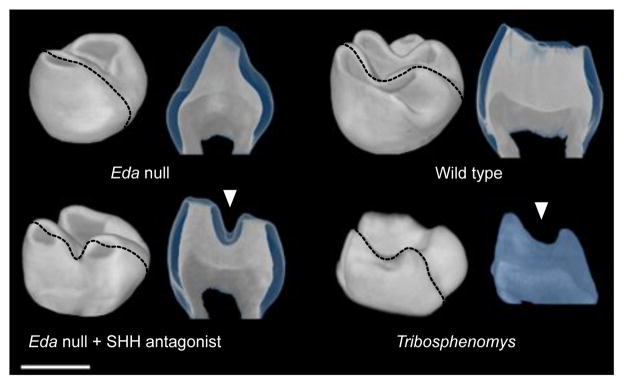
a, Eda null teeth cultured with SHH antagonist (n = 9 of 11 teeth) show more and better separated cusps (arrowheads, compare to Fig. 1a). b, Second molars produced using in vivo treatment of Eda null mice with SHH antagonist particularly show better separation of cusps compared to the Eda null teeth (n = 2 of 4 mice). Tribosphenomys minutus teeth lack crests connecting cusps (specimen V10776 shows p4–m3). c, Obliquely posterior views of molars show the lack of the metalophid crest (arrowheads) in treated Eda null, which has replicated the ancestral morphology of T. minutus. The Tribosphenomys molars shown are the first (V10776, on the left) and the second molar (V10775 holotype, on the right). Teeth have been mirrored if needed to represent the left side, anterior is towards the left in a and b and top in c. Scale bars, 500 μm.
To push the experimental system further and to retrieve features present in the basal taxon Tribosphenomys2, we inhibited SHH in developing Eda null teeth in vivo (see Methods). Tribosphenomys cusps are columnar and well separated, lacking a crest called the metalophid (the trigonid wall) that connects cusps together. The loss of the metalophid has been linked to the basal rodentiaforms2, but it has reappeared in many rodent clades, including murines2,3,24,25. Our in vivo engineered tooth shapes showed columnar and laterally separated cusps without the metalophid (Fig. 5b), a morphology visible also at the enamel–dentin junction (Extended Data Fig. 7). Although the effects of SHH inhibition were variable, the trough separating the protoconid and metaconid approximated the pattern found in Tribosphenomys (Fig. 5c). These results indicate that, with a relatively small number of developmental changes, mouse teeth can be engineered to express evolutionarily basal traits.
Conclusions
Our results demonstrate that many of the step-wise transitions that are widespread in the fossil record of mammalian teeth are reproducible experimentally. Whereas our results suggest that several, if not the majority, of dental traits are developmentally linked10, individual characters may respond to different levels of the same signal. These thresholds may well underlie different morphological gradients that have been identified along the tooth row34. Moreover, trait thresholds may affect evolutionary rates of individual traits differently. Such data in turn should be useful when combined with analyses of character correlations35, and in weighting or ordering characters, or objectively assigning transition weights within characters coded to minimize character dependency effects in phylogenetic analyses8. Other developmental factors and signalling pathways may influence traits in other ways, but we predict that the general pattern of results will hold as long as the factors affect the signalling dynamics of the enamel knots. Finally, as recently proposed for the evolution of bird and non-avian dinosaur skulls36, developmental data can suggest novel insights into the processes underlying heterochrony. A better mechanistic basis for heterochrony will help to explain changes in evolutionary rates, including prediction of intermediate morphologies even when they have not yet been recovered in the fossil record. In general, with advancing understanding of development, it will be possible to experimentally test many more of the known evolutionary transitions.
METHODS
Animals studied
We used Eda null mice (that is, Tabby) from the strain B6CBACa-Aw-J/A-Ta (Stock JR0314, Jackson Laboratory) crossed with ShhWT/GFPCre reporter mice that express green fluorescent protein (GFP) under a sonic hedgehog (Shh)-promoter16, and the ShhWT/GFPCre reporter mice as wild type. Although the growth and patterning of ShhWT/GFPCre teeth have been reported to be comparable to wild type teeth19, we tested the growth of Eda null;ShhWT/GFPCre compound mutants. The Eda null;ShhWT/GFPCre were 82% of the size (P = 0.05; Mann–Whitney U-test, n = 12) and had 98% of the cusps (P > 0.5; Mann–Whitney U-test, n = 12) of Eda null teeth after 7 days in culture. All the procedures of this study involving animals were reviewed and approved by relevant Animal Welfare and Research Committees.
Organ cultures
Embryonic day 13 lower molars were dissected and cultured for seven days at 37°C with 5% CO2 using a Trowell-type organ culture as described previously37. We studied lower molars because their development is best understood. We used Fc-EDA-A1 protein (EDA), which has been shown to rescue the Eda null phenotype of mice and dogs10,18,38. Culture media were changed every two days. The media were supplemented with the EDA protein during the first four days. Corresponding amounts of bovine serum albumin 0.1% (BSA, Sigma) in PBS were used for controls. Eda null;ShhWT/GFPCre lower molars were cultured in the EDA concentrations 2.5, 10, 25, 50, 100, 500 and 1000 ng ml−1 (n = 9–16 in each group, littermates were used as controls). As controls, ShhWT/GFPCre molars and Eda null;ShhWT/GFPCre molars were cultured. Molars were photographed daily both in visible light (Olympus SZX9) and in fluorescent light (Leica MZFLIII and Zeiss Stereo Lumar V12). Cusp presences and initiation times were determined from time-lapse images and were based on the appearance of their enamel knots, as revealed by the GFP-reporter. Explants were excluded from the analyses if molars tilted to a point in which tabulating cusps became difficult. Molars from at least three different litters were used for each treatment. Shh is expressed only in the primary enamel knot during the cap stage of development10,19, and we used the epifluorescence of ShhWT/GFPCre to measure enamel knot sizes.
Tooth shape analyses
Because we analysed cultured teeth, which do not allow determination of final cusp morphology, we evaluated cusp presence-absence states and the height of the talonid relative to the trigonid (repeated by two observers). Nevertheless, these tabulations cover over half of the first molar characters used previously in the analysis of fully mineralized Eda null mutants10. The protoconid and metaconid cusps were tabulated as fused when they were closely spaced and lacked distinct cusp tips. The mouse anteroconid typically has two obliquely placed and fused cusps (bilobed morphology). In the character tabulations the distinctly bilobed anteroconids were tabulated as having two cusps (character state 2, found in seven cases). Tabulating the anteroconid having only one cusp did not alter the pattern of results. Due to the limitations of culture systems, the presence of hypoconulid and bilobed anteroconids are underrepresented compared to fully mineralized teeth in a jaw. Even if cultured longer, the number of cusps does not increase due to the onset of cellular differentiation. Talonid height was measured as the relative height of talonid cusps relative to trigonid cusps at the intervals 0 (not observed in the explants), 0.25, 0.33, 0.50, 0.66, 0.75 and 1.00. Talonid height was only measured when the teeth were tilted enough to see the crown base and cusp tips (in 75% of cases, Supplementary Table 1).
To map changes in tooth character states in the cultured teeth, we used the following five characters. Corresponding character numbers used in ref. 10 are in parenthesis (single occurrences were excluded in Fig. 3c).
(7): Anteroconid: (0) absent; (1) single; (2) bilobed.
(9): Trigonid (protoconid and metaconid): (0) absent (1) fused with single tip; (2) separated.
(10): Talonid (hypoconid and entoconid): (0) absent (1) fused with single tip; (2) separated.
(17): Hypoconulid: (0) absent; (1) present.
(5): Trigonid size relative to talonid size: (0) notably higher; (1) slightly higher; (2) flat occlusal surface. Here measured talonid height values 0.25 to 0.50, 0.66 to 0.75, and 1 were coded as character states 0, 1, and 2 in Fig. 3c, respectively.
Comparative data and analyses
We analysed morphologies of first lower molars of extant 35 murine rodent species, extinct taxon Tribosphenomys minutus, and extant 32 carnivoran species (Extended Data Tables 1 and 2). The extant taxa represent the range of diets across the phylogeny within each group27. Morphological characters corresponding to the ones tabulated for the experimental data (cusp numbers and talonid height) were tabulated from photographs and three dimensional scans (available at MorphoBrowser database at (http://morphobrowser.biocenter.helsinki.fi/))27. Alternative ways of measuring talonid height in comparative and experimental data (for example, talonid-trigonid height difference/protoconid length) produce equivalent patterns. When lateral cusps form a single crest in murines, they were tabulated as having two cusps. Due to the high diversity of carnivore m1s, we also measured complexity by first scaling teeth to a length of 50 pixel rows. The teeth were divided into trigonid and talonid sections, and then orientation patch count (OPC) was determined for each section as previously described27,39. After determining the surface orientation at each pixel on the digital elevation model (DEM), contiguous pixels that are facing the same cardinal direction (for example, north, south, southwest) were grouped into patches. The number of these patches is the OPC. Reduced major axis regressions were performed in PAST40 with permutation tests (Extended Data Tables 3). Carnivoran data was analysed also after calculating the mean values for species in each family.
Modelling
We implemented a morphodynamic model on tooth development14,21 in a graphical user interface called ToothMaker. ToothMaker is written in C++ and uses QT libraries. The interface consists of model controls and an interactive OpenGL model viewer for visualizing the three-dimensional objects in real-time as they are computed. Model parameter space scanning can be automated within the interface for given parameter value ranges. ToothMaker is freely available for Windows, OS X and Linux at (http://dead.cthulhu.fi/ToothMaker/). We used ToothMaker to obtain a morphology corresponding to a developing mouse molar. Here we used previous studies14,21 and automated parameter scanning in ToothMaker to search for parameters that reproduce the EDA effects on the cusp patterns. The model integrates experimentally inferred genetic interactions with tissue biomechanics to simulate tooth development. The genetic parameters entail three diffusible signals; an activator inducing enamel knots, an enamel knot-secreted inhibitor of enamel knot formation, and a growth factor regulating growth of the epithelium and the mesenchyme21. Because the enamel knot differentiation is irreversible, the model represents an irreversible reaction-diffusion-like model. EDA signalling is known to interact with multiple signalling pathways41, and accordingly our focus was to model the effects of EDA through the genetic parameters. Here we report one mouse model version that was produced in a modest number of iterations (14,000), allowing efficient scanning of parameters. Other parameter combinations producing mouse provided equivalent results. Because of the limitations of the implementation of cellular differentiation, matrix secretion, and current limits in computational power, the model accounts for mouse molar development up to day 16–17.
Suppression of SHH signalling
To prevent cusp fusion in Eda null teeth without the direct stimulation of EDA signalling, we inhibited SHH signalling. Previously SHH inhibition has been shown to increase cusp density in culture mouse teeth, and we treated Eda null;ShhWT/GFPCre lower molars with 1 μM of cyclopamine (catalogue no. C4116, Sigma, diluted in dimethylsulphoxide (DMSO)) on culture days zero and two (similarly to EDA treatments, n = 11). Pregnant Eda heterozygous females (n = 4, mated with Eda null males) were treated with Hedgehog pathway inhibitor at a dose of 50 and 100 mg per kg. Small molecule antagonist, acting at the level of Smoothened, was synthesized as previously described42 and administered via oral gavage to timed pregnant females starting at day 13.25 and continued to 14.75 and 15.75 of embryonic development in 8 h intervals. We chose this late treatment because it does not interfere with the development of other organs, although the dental effects targeted principally the second molars. Animals born to these females were sacrificed at 35 days of age when all teeth are erupted, and skulls were cleaned using a dermestid beetle colony. Only the teeth from the higher dosage treatments were affected (n = 2 of 4 Eda null males). We used X-ray tomography to reconstruct three-dimensional cusp patterns. The mouse jaws were scanned using a custom-built microCT system Nanotom 180 NF (phoenixjX-ray Systems 1 Services GmbH) with a CMOS detector (Hamamatsu Photonics) and a high-power transmission-type X-ray nanofocus source with a tungsten anode. The Tribosphenomys minutus specimens (IVPP V10775 (holotype) and V10776) were scanned using the 225 kV microCT (developed by the Institute of High Energy Physics, Chinese Academy of Sciences (CAS)) at the Key Laboratory of Vertebrate Evolution and Human Origins, CAS. Fiji (http://fiji.sc/Fiji) Volume Viewer plugin43 was used to segment and render the teeth. Voxel resolutions used for the renderings are 3 to 4 μm for mice and 2.4 to 3.3 μm for Tribosphenomys.
Extended Data
Extended Data Figure 1. Primary enamel knot size predicts cusp number.
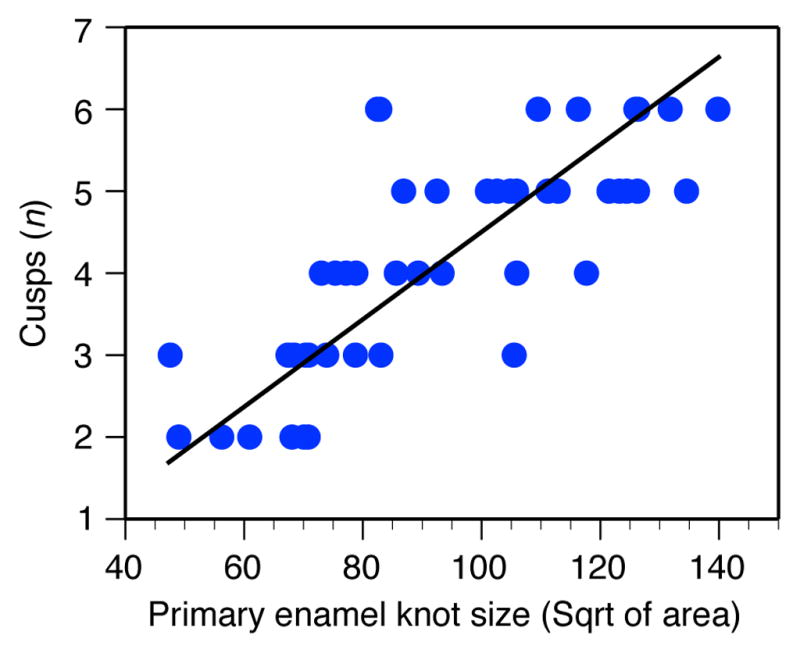
Size of the primary enamel knot (day 2) and cusp number (day 7) for Eda null, Eda null + 10 ng ml−1 EDA, Eda null + 50 ng ml−1 EDA, and wild-type teeth. Reduced major axis regression for square root of μm2 are 0.0533 × −0.791, r2 = 0.613, P < 0.0001, n = 46. Enamel knot size does not increase substantially with higher EDA concentrations.
Extended Data Figure 2. The ToothMaker modelling interface and morphodynamic model of tooth development.

The model parameters can be changed manually or scanned automatically (Options-menu). For descriptions of parameters, see Methods. The figures illustrate the growth factor concentration (secreted from the enamel knots) showing the future cusp areas. Initial activator concentration (Ina) is not used in the model. The model can be downloaded at (http://dead.cthulhu.fi/ToothMaker/).
Extended Data Figure 3. Scanning parameter space to produce gradual changes.
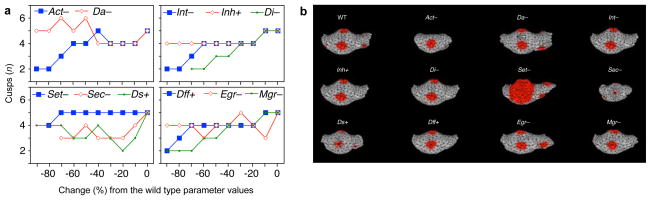
a, Parameters producing variation in cusp number were scanned at 10 percent intervals up to 90 percent change from the wild-type (WT) mouse. Growth factor domains, produced by enamel knots, were used to tabulate cusps numbers (threshold = 0.04). b, Simulated teeth show the minimum number of cusps that can be produced by changing each parameter. Only parameter Act produced single-cusped morphology. Plus and minus signs after each parameter denote to the direction of parameter change that produced a decrease in cusp number. Act = activator auto-activation, Da = activator diffusion, Int = inhibitor production threshold, Inh = Activator inhibition by inhibitor, Di = inhibitor diffusion, Set = growth factor production threshold, Sec = growth factor secretion rate, Ds = growth factor diffusion, Dff = differentiation rate, Egr = epithelial proliferation rate, Mgr = mesenchymal proliferation rate. All simulations were run for a fixed number of iterations (14,000).
Extended Data Figure 4. Simulating EDA effects.
a, Simulated shapes produced by changing the activator parameter (Act) from 0.1 to 1.6 at 0.1 interval. b, The size of inhibitor domain (at arbitrary threshold 0.85) at iteration 1,000 and corresponding cusp number at iteration 14,000 approximates the relationship between primary enamel knot size and cusp number in real teeth.
Extended Data Figure 5. Simulating reduction of inhibition in Eda null teeth.
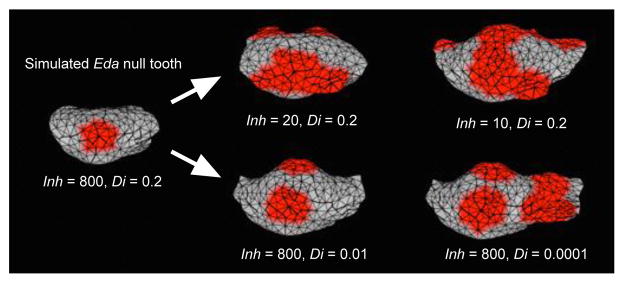
Reducing activator inhibition by inhibitor (Inh) or diffusion of inhibitor (Di) results in formation of multiple cusps in simulated Eda null molar. The effects are variable depending on the parameter values, and the lability of the system appears to be corroborated in the in vitro experiments.
Extended Data Figure 6. Rescuing cusps in Eda null teeth by inhibiting SHH.
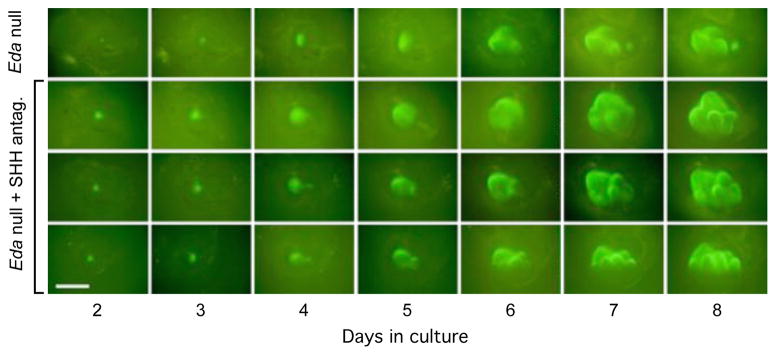
Eda null teeth cultured with SHH antagonist show variable morphologies with tightly packed cusps (arrowheads). In addition, in roughly half of the cases (n = 4 of 11 teeth) portions of the first molar appear to form from the fusion with the developing second molar (two bottom rows). Scale bar, 500 μm.
Extended Data Figure 7. In vivo inhibition of SHH in Eda null embryos causes the formation of separate cusps without crests.
Obliquely anterior views and tomography sections (along the plane of the dotted line) of second molars show the lack of a crest (metalophid, arrowheads) in treated Eda null and Tribosphenomys minutus (V10775). Enamel in sections shown in blue colour except in Tribosphenomys fossil which did not allow segmentation of enamel due to high degree of mineralization. Scale bar, 500 μm.
Extended Data Table 1. Gradual acquisition of cusps in EDA treated teeth.
Day of culture for the appearance of cusps and corresponding character codings after seven days of culture. Asterisk indicates explants in which final cusps were tabulated at day 6, otherwise cusps were tabulated at day 7. The two cases of trunkated m1s in 1000 ng/ml treatments were excluded from the analyses. Talonid height was pssible to tabulate for only a portion of all the explants.
| ID | 1 | 2 | 3 | 4 | 5 | 6 | 7 | 8 | 9 | 10 | 11 | 12 | 13 | |
|---|---|---|---|---|---|---|---|---|---|---|---|---|---|---|
| EDAIBAL1 | 0 | 2 | Fused | 4 | 0110 | 2 | 0 | 0.5 | ||||||
| EDAIBAL2 | 0 | 2 | 3 | 6 | 0210 | 3 | 0 | 0.33 | ||||||
| EDAIBAL3 | 0 | 2 | 4 | 6 | 0210 | 3 | ||||||||
| EDAIBAL4 | 0 | 2 | Fused | 6 | 0110 | 2 | 1 | 0.66 | ||||||
| EDAIBAL5 | 0 | 2 | 3 | 5 | 0210 | 3 | 0 | 0.33 | ||||||
| EDAIBAL6 | 0 | 2 | 4 | 7 | 0210 | 3 | ||||||||
| EDAIBBL4 | 0 | 2 | Fused | 5 | 0110 | 2 | 0 | 0.5 | ||||||
| EDAIBBR2 | 0 | 2 | Fused | 5 | 0110 | 2 | 0 | 0.33 | ||||||
| EDAIBDL5 | 0 | 2 | 3 | 6 | 0210 | 3 | 0 | 0.25 | ||||||
| EDAIBEL5 | 0 | 2 | 3 | 5 | 0210 | 3 | 0 | 0.5 | ||||||
| EDAIBER1 | 0 | 2 | Fused | 6 | 0110 | 2 | 0 | 0.33 | ||||||
| EDAIBIR2* | 0 | 2 | 3 | 5 | 0210 | 3 | 1 | 0.66 | ||||||
| EDAIBJL2* | 0 | 2 | Fused | 5 | 0110 | 2 | 0 | 0.5 | ||||||
| EDAIBJL5 | 0 | 2 | 3 | 5 | 0210 | 3 | 0 | 0.33 | ||||||
| EDAIBLR5 | 0 | 2 | 3 | 5 | 0210 | 3 | 0 | 0.33 | ||||||
| 2.5IBAL1 | 2.5 | 1 | 3 | 4 | 0210 | 3 | 0 | 0.5 | ||||||
| 2.5IBDR1 | 2.5 | 4 | 1 | 3 | 4 | 1210 | 4 | 1 | 0.75 | |||||
| 2.5IBBL1 | 2.5 | 1 | Fused | 5 | 0110 | 2 | 1 | 0.75 | ||||||
| 2.5IBCL1 | 2.5 | 1 | 3 | 6 | 0210 | 3 | 0 | 0.33 | ||||||
| 2.5IBDR2 | 2.5 | 1 | 3 | 4 | 0210 | 3 | ||||||||
| 2.5IBBL2 | 2.5 | 1 | 3 | 4 | 0210 | 3 | 2 | 1 | ||||||
| 2.5IBER2 | 2.5 | 1 | 3 | 4 | 0210 | 3 | 1 | 0.66 | ||||||
| 2.5IBCL2 | 2.5 | 1 | 3 | 4 | 0210 | 3 | 0 | 0.5 | ||||||
| 2.5IBFR2 | 2.5 | 1 | 3 | 5 | 0210 | 3 | 0 | 0.5 | ||||||
| 10IBAL1 | 10 | 2 | 3 | 5 | 0210 | 3 | 0 | 0.5 | ||||||
| 10IBAL3 | 10 | 5 | 1 | 3 | 4 | 1210 | 4 | 0 | 0.5 | |||||
| 10IBAR2 | 10 | 4 | 1 | 3 | 4 | 4 | 1220 | 5 | ||||||
| 10IBBL4 | 10 | 4 | 1 | 3 | 4 | 4 | 1220 | 5 | 1 | 0.75 | ||||
| 10IBBR2 | 10 | 4 | 1 | 3 | 4 | 5 | 1220 | 5 | ||||||
| 10IBBR3 | 10 | 5 | 1 | 3 | 4 | 1210 | 4 | 1 | 0.75 | |||||
| 10IBBR4 | 10 | 4 | 1 | 3 | 4 | 5 | 1220 | 5 | 1 | 0.75 | ||||
| 10IBCL2 | 10 | 4 | 1 | 3 | 4 | 4 | 1220 | 5 | 1 | 0.75 | ||||
| 10IBCL3 | 10 | 5 | 1 | 3 | 4 | 1210 | 4 | 1 | 0.75 | |||||
| 10IBCL4 | 10 | 5 | 1 | 3 | 4 | 5 | 1220 | 5 | 1 | 0.75 | ||||
| 10IBCR2 | 10 | 4 | 1 | 3 | 4 | 4 | 1220 | 5 | 2 | 1 | ||||
| 10IBCR4 | 10 | 5 | 1 | 3 | 4 | 5 | 1220 | 5 | 1 | 0.75 | ||||
| 10IBDL4 | 10 | 5 | 1 | 3 | 5 | 1210 | 4 | 1 | 0.75 | |||||
| 10IBDR3 | 10 | 1 | 3 | 4 | 0210 | 3 | 1 | 0.75 | ||||||
| 10IBDR4 | 10 | 4 | 1 | 3 | 4 | 1210 | 4 | 2 | 1 | |||||
| 25IBBL1 | 25 | 4 | 1 | 3 | 4 | 4 | 1220 | 5 | 1 | 0.75 | ||||
| 25IBCL1 | 25 | 4 | 1 | 3 | 4 | 4 | 1220 | 5 | 1 | 0.75 | ||||
| 25IBAL2 | 25 | 4 | 1 | 3 | 4 | 4 | 1220 | 5 | ||||||
| 25IBFR2 | 25 | 4 | 1 | 3 | 4 | 6 | 1220 | 5 | 2 | 1 | ||||
| 25IBER2 | 25 | 4 | 1 | 3 | 4 | 1210 | 4 | 1 | 0.75 | |||||
| 25IBCL2 | 25 | 4 | 1 | 3 | 4 | 4 | 7 | 1221 | 6 | 2 | 1 | |||
| 25IBDL3 | 25 | 4 | 1 | 3 | 4 | 6 | 1220 | 5 | 2 | 1 | ||||
| 25IBAR3 | 25 | 4 | 1 | 3 | 4 | 5 | 1220 | 5 | 1 | 0.75 | ||||
| 25IBAR4 | 25 | 1 | 3 | 5 | 0210 | 3 | 0 | 0.5 | ||||||
| 25IBAR5 | 25 | 1 | 3 | 4 | 0210 | 3 | 0 | 0.5 | ||||||
| 50IBAL3* | 50 | 4 | 1 | 3 | 4 | 4 | 1220 | 5 | ||||||
| 50IBBL1 | 50 | 4 | 1 | 3 | 4 | 1210 | 4 | 2 | 1 | |||||
| 50IBBL2 | 50 | 1 | 3 | 5 | 0210 | 3 | 1 | 0.66 | ||||||
| 50IBBL3* | 50 | 4 | 1 | 3 | 4 | 4 | 6 | 1221 | 6 | 2 | 1 | |||
| 50IBCL1 | 50 | 6 | 2 | 3 | 5 | 1210 | 4 | 1 | 0.66 | |||||
| 50IBCR1 | 50 | 4 | 1 | 3 | 4 | 1210 | 4 | 1 | 0.75 | |||||
| 50IBCR3* | 50 | 4 | 1 | 3 | 4 | 4 | 6 | 1221 | 6 | 2 | 1 | |||
| 50IBDL1 | 50 | 6 | 2 | 3 | 5 | 1210 | 4 | 1 | 0.75 | |||||
| 50IBDR2 | 50 | 4 | 1 | 3 | 5 | 1210 | 4 | 1 | 0.75 | |||||
| 50IBDR3* | 50 | 4 | 1 | 3 | 4 | 4 | 6 | 1221 | 6 | 2 | 1 | |||
| 50IBER2 | 50 | 4 | 1 | 3 | 4 | 4 | 6 | 1221 | 6 | 2 | 1 | |||
| 50IBFR2 | 50 | 4 | 1 | 3 | 4 | 4 | 7 | 1221 | 6 | 2 | 1 | |||
| 50IBGR2 | 50 | 4 | 1 | 3 | 4 | 4 | 6 | 1221 | 6 | 2 | 1 | |||
| 100IBAR1 | 100 | 4 | 1 | 3 | 4 | 4 | 1220 | 5 | 2 | 1 | ||||
| 100IBBL1 | 100 | 4 | 1 | 3 | 4 | 4 | 1220 | 5 | ||||||
| 100IBCL1 | 100 | 4 | 1 | 3 | 4 | 4 | 1220 | 5 | 1 | 0.75 | ||||
| 100IBCL2* | 100 | 4 | 1 | 3 | 4 | 4 | 1220 | 5 | ||||||
| 100IBDR1 | 100 | 4 | 1 | 3 | 4 | 4 | 7 | 1221 | 6 | 2 | 1 | |||
| 100IBEL1 | 100 | 4 | 1 | 3 | 4 | 4 | 1220 | 5 | ||||||
| 100IBFL1 | 100 | 5 | 1 | 3 | 5 | 5 | 1220 | 5 | 1 | 0.75 | ||||
| 100IBFR2 | 100 | 5 | 1 | 3 | 4 | 1210 | 4 | |||||||
| 100IBGL1 | 100 | 4 | 1 | 3 | 4 | 4 | 1220 | 5 | 2 | 1 | ||||
| 100IBGR2* | 100 | 4 | 1 | 3 | 4 | 4 | 6 | 1221 | 6 | 2 | 1 | |||
| 100IBHR2* | 100 | 4 | 1 | 3 | 4 | 4 | 1220 | 5 | 2 | 1 | ||||
| 500IBER1 | 500 | 4 | 1 | 3 | 4 | 4 | 1220 | 5 | 2 | 1 | ||||
| 500IBER2* | 500 | 4 | 1 | 3 | 4 | 4 | bilobed anteroc. | 2220 | 6 | |||||
| 500IBFR1 | 500 | 4 | 1 | 3 | 4 | 4 | 1220 | 5 | ||||||
| 500IBGR1 | 500 | 4 | 1 | 3 | 4 | 4 | 1220 | 5 | ||||||
| 500IBHR1 | 500 | 4 | 1 | 3 | 4 | 4 | 7 | 1221 | 6 | 2 | 1 | |||
| 500IBIL2* | 500 | 4 | 1 | 3 | 5 | 4 | 1220 | 5 | 2 | 1 | ||||
| 500IBIR1 | 500 | 4 | 1 | 3 | 4 | 4 | 1220 | 5 | ||||||
| 500IBJR1 | 500 | 4 | 1 | 3 | 4 | 4 | 6 | bilobed anteroc. | 2221 | 7 | ||||
| 500IBKR1 | 500 | 4 | 1 | 3 | 5 | 5 | 1220 | 5 | 2 | 1 | ||||
| 500IBLR1 | 500 | 4 | 1 | 3 | 4 | 4 | 6 | 1221 | 6 | |||||
| 500IBMR1 | 500 | 4 | 1 | 3 | 4 | 4 | bilobed anteroc. | 2220 | 6 | |||||
| 500IBNR1 | 500 | 4 | 1 | 3 | 4 | 4 | 6 | 1221 | 6 | 2 | 1 | |||
| 1000IBAL1 | 1000 | 4 | 1 | 3 | 4 | 4 | 6 | bilobed anteroc. | 2221 | 7 | 2 | 1 | ||
| 1000IBAR1 | 1000 | 4 | 1 | 3 | trunkated m1 | 1200 | 3 | |||||||
| 1000IBBL1 | 1000 | 4 | 1 | 3 | 4 | 4 | 1220 | 5 | ||||||
| 1000IBBR1 | 1000 | 4 | 1 | 3 | 4 | 4 | 7 | 1221 | 6 | 2 | 1 | |||
| 1000IBCL1 | 1000 | 4 | 1 | 3 | 4 | 4 | 1220 | 5 | 2 | 1 | ||||
| 1000IBDL1 | 1000 | 4 | 1 | 3 | 5 | 5 | 6 | 1221 | 6 | |||||
| 1000IBEL1 | 1000 | 4 | 1 | 3 | 5 | 5 | 7 | 1221 | 6 | 1 | 0.66 | |||
| 1000IBER1 | 1000 | 4 | 1 | 3 | 5 | 5 | 1220 | 5 | 2 | 1 | ||||
| 1000IBFL1 | 1000 | 5 | 1 | 4 | trunkated m1 | 1200 | 3 | |||||||
| 1000IBFR1 | 1000 | 4 | 1 | 3 | 5 | 5 | 1220 | 5 | 2 | 1 | ||||
| 1000IBGR1 | 1000 | 4 | 1 | 3 | 4 | 4 | 6 | 1221 | 6 | 2 | 1 | |||
| 1000IBHR1 | 1000 | 4 | 1 | 3 | 4 | 4 | 6 | 1221 | 6 | 2 | 1 | |||
| WTIBAL1 | 0 | 4 | 2 | 3 | 4 | 4 | 7 | 1221 | 6 | 2 | 1 | |||
| WTIBAL2 | 0 | 5 | 2 | 3 | 4 | 4 | 1220 | 5 | 2 | 1 | ||||
| WTIBAL3 | 0 | 4 | 1 | 3 | 4 | 4 | 6 | 1221 | 6 | |||||
| WTIBBL1 | 0 | 5 | 2 | 3 | 4 | 4 | 7 | 1221 | 6 | 1 | 0.66 | |||
| WTIBBL2 | 0 | 5 | 2 | 3 | 4 | 4 | 1220 | 5 | ||||||
| WTIBBL3 | 0 | 4 | 1 | 3 | 4 | 4 | 1220 | 5 | ||||||
| WTIBCL2 | 0 | 5 | 2 | 3 | 4 | 5 | 1220 | 5 | 2 | 1 | ||||
| WTIBCL3 | 0 | 5 | 1 | 3 | 4 | 4 | bilobed anteroc. | 2220 | 6 | |||||
| WTIBDL1 | 0 | 4 | 2 | 3 | 4 | 4 | 6 | 1221 | 6 | 2 | 1 | |||
| WTIBDL2 | 0 | 4 | 1 | 3 | 4 | 4 | bilobed anteroc. | 2220 | 6 | 2 | 1 | |||
| WTIBDL3 | 0 | 4 | 1 | 3 | 4 | 4 | 1220 | 5 | ||||||
| WTIBEL3 | 0 | 4 | 1 | 3 | 4 | 4 | 1220 | 5 | 2 | 1 | ||||
| WTIBFL1 | 0 | 4 | 2 | 3 | 4 | 4 | bilobed anteroc. | 2220 | 6 | 2 | 1 | |||
| WTIBFL3 | 0 | 5 | 1 | 3 | 5 | 5 | 1220 | 5 | ||||||
| WTIBGL1 | 0 | 4 | 1 | 3 | 4 | 4 | 6 | 1221 | 6 | 2 | 1 | |||
| WTIBGR1 | 0 | 4 | 1 | 3 | 4 | 4 | 6 | 1221 | 6 | 2 | 1 |
1 = EDA ng/ml, 2 = Anteroconid day, 3 = Protoconid day, 4 = Metaconid day, 5 = Talonid day, 6 = Entoconid day, 7 = Hypoconid day, 8 = Hypoconulid, 9 = Comments, 10 = Cuspal characters, 11 = Cusp n, 12 = Talonid/Trigonid height character state, 13 = Measured Talonid/Trigonid height.
Extended Data Table 2. Comparison of talonid height and cusp number in rodents.
Cusp numbers tabulated for the entire anterior (anteroconid + trigonid) and posterior (talonid + hypoconulid) parts of the m1 and corresponding heights of the talonid relative to the trigonid. For experimental data, averages listed for explants with data on both cusps and talonid heights (Extended Data Table 1). For rodent taxa and specimens, see methods.
| Experiment or species | Anterior cusps | Posterior cusps | Talonid height |
|---|---|---|---|
| Eda null (0 ng/ml EDA) | 1.54 | 1.00 | 0.43 |
| Eda null (2.5 ng/ml EDA) | 2.00 | 1.00 | 0.62 |
| Eda null (10 ng/ml EDA) | 2.85 | 1.46 | 0.75 |
| Eda null (25 ng/ml EDA) | 2.78 | 1.78 | 0.78 |
| Eda null (50 ng/ml EDA) | 2.92 | 2.00 | 0.88 |
| Eda null (100 ng/ml EDA) | 3.00 | 2.29 | 0.93 |
| Eda null (500 ng/ml EDA) | 3.00 | 2.40 | 1.00 |
| Eda null (1000 ng/ml EDA) | 3.13 | 2.63 | 0.96 |
| Wild type (0 ng/ml EDA) | 3.20 | 2.50 | 0.97 |
| Tribosphenomys minutus | 3 | 2 | 0.75 |
| Aethomys hindei | 5 | 4 | 1.00 |
| Anisomys imitator | 4 | 3 | 1.00 |
| Apodemus agrarius | 4 | 4 | 1.00 |
| Arvicanthis niloticus | 5 | 4 | 1.00 |
| Bandicota indica | 4 | 3 | 1.00 |
| Berylmys bowersi | 4 | 3 | 1.00 |
| Bunomys coelestis | 4 | 3 | 1.00 |
| Chiropodomys sp. | 5 | 4 | 1.00 |
| Crateromys schadenbergi | 4 | 3 | 1.00 |
| Dasymys sp. | 4 | 4 | 1.00 |
| Dephomys sp. | 4 | 3 | 1.00 |
| Grammomys dolichurus | 5 | 4 | 1.00 |
| Hybomys univittatus | 4 | 4 | 1.00 |
| Hydromys chrysogaster | 3 | 3 | 1.00 |
| Hylomyscus stella | 4 | 4 | 1.00 |
| Hyomys goliath | 6 | 3 | 1.00 |
| Lemniscomys striatus | 5 | 4 | 1.00 |
| Leopoldamys sabanus | 4 | 3 | 1.00 |
| Leptomys elegans | 4 | 3 | 1.00 |
| Malacomys sp. | 4 | 3 | 1.00 |
| Mallomys rothschildi | 4 | 3 | 1.00 |
| Mastomys natalensis | 4 | 3 | 1.00 |
| Mus musculus | 4 | 3 | 1.00 |
| Nesokia indica | 3 | 2 | 1.00 |
| Niviventer rapit | 4 | 3 | 1.00 |
| Notomys mitchellii | 4 | 3 | 1.00 |
| Oenomys hypoxanthus | 4 | 3 | 1.00 |
| Pelomys campanae | 3 | 3 | 1.00 |
| Pogonomys sp. | 5 | 4 | 1.00 |
| Praomys jacksoni | 4 | 4 | 1.00 |
| Rhabdomys pumilio | 6 | 3 | 1.00 |
| Stochomys longicaudatus | 4 | 3 | 1.00 |
| Sundamys muelleri | 4 | 4 | 1.00 |
| Uromys caudimaculatus | 3 | 3 | 1.00 |
| Zelotomys sp. | 4 | 3 | 1.00 |
Extended Data Table 3. Comparison of talonid height and cusp number in carnivorans.
Cusp numbers and OPCs tabulated for the entire anterior (anteroconid + trigonid) and posterior (talonid + hypoconulid) parts of the m1 and corresponding heights of the talonid relative to the trigonid. For taxa and specimens, see methods.
| Species | Anterior cusps | Posterior cusps | Anterior OPC | Posterior OPC | Talonid height |
|---|---|---|---|---|---|
| Acinonyx jubatus | 2 | 0 | 16.75 | 0.00 | 0.16 |
| Ailuropoda melanoleuca | 3 | 4 | 28.63 | 23.75 | 0.83 |
| Ailurus fulgens | 3 | 4 | 33.63 | 27.50 | 0.83 |
| Alopex lagopus | 3 | 2 | 20.63 | 13.25 | 0.46 |
| Canis aureus | 3 | 2 | 19.63 | 17.63 | 0.40 |
| Canis lupus | 3 | 2 | 17.38 | 16.50 | 0.42 |
| Crocuta crocuta | 2 | 1 | 16.50 | 1.75 | 0.42 |
| Felis silvestris | 2 | 0 | 19.13 | 0.00 | 0.02 |
| Galerella sanguinea | 3 | 2 | 30.50 | 11.00 | 0.34 |
| Genetta genetta | 3 | 2 | 29.38 | 17.13 | 0.44 |
| Gulo gulo | 2 | 1 | 14.00 | 6.38 | 0.42 |
| Herpestes ichneumon | 3 | 2 | 25.38 | 11.13 | 0.46 |
| Lutra lutra | 3 | 2 | 22.25 | 13.00 | 0.56 |
| Lynx lynx | 2 | 1 | 19.63 | 5.00 | 0.49 |
| Martes foina | 3 | 1 | 18.25 | 11.63 | 0.52 |
| Martes martes | 3 | 1 | 19.00 | 14.63 | 0.49 |
| Meles meles | 3 | 4 | 21.25 | 25.88 | 0.72 |
| Mustela erminea | 2 | 2 | 14.00 | 6.13 | 0.50 |
| Mustela eversmannii | 2 | 1 | 14.25 | 4.75 | 0.51 |
| Mustela lutreola | 2 | 2 | 15.00 | 9.88 | 0.57 |
| Mustela nivalis | 2 | 1 | 16.00 | 5.88 | 0.52 |
| Mustela putorius | 2 | 1 | 16.75 | 4.50 | 0.51 |
| Otocyon megalotis | 3 | 2 | 23.38 | 20.13 | 0.69 |
| Panthera leo | 2 | 0 | 16.50 | 0.00 | 0.16 |
| Paradoxurus hermaphroditus | 4 | 3 | 36.50 | 21.13 | 0.76 |
| Procyon lotor | 4 | 4 | 30.50 | 24.25 | 0.75 |
| Ursus americanus | 4 | 2 | 31.00 | 25.63 | 0.69 |
| Ursus arctos | 4 | 3 | 28.13 | 21.88 | 0.64 |
| Ursus maritimus | 3 | 2 | 21.88 | 20.38 | 0.57 |
| Viverra zibetha | 3 | 4 | 27.63 | 27.75 | 0.53 |
| Vormela peregusna | 3 | 1 | 19.25 | 6.13 | 0.45 |
| Vulpes vulpes | 3 | 3 | 21.25 | 20.88 | 0.45 |
Extended Data Table 4. Reduced Major Axis regression analyses between talonid height and talonid cusp numbers and complexity.
Talonid tabulations include all the posterior cusps. Explants with EDA include only Eda null teeth cultured with EDA protein (2.5 ng/mm to 1000 ng/ml). Values for carnivoran families are based on the means of species for each family (n = 9). For details, see text and methods.
| Data | Slope (95% CI) | Intercept (95% CI) | r2 | p |
|---|---|---|---|---|
| Experiments | 3.30 (1.76–4.01) | −0.79 (−1.39–0.56) | 0.891 | 0.0003 |
| Experiments (explants with EDA) | 4.22 (3.08–5.07) | −1.63 (−2.38– −0.67) | 0.946 | 0.0005 |
| Line from Tribosphenomys to Mus | 4.00 | −1.00 | ||
| Carnivoran species (cusps) | 6.53 (4.60–7.73) | −1.38 (−2.02– −0.28) | 0.594 | 0.0001 |
| Carnivoran families (cusps) | 6.63 (4.68–7.84) | −1.28 (−2.09– −0.07) | 0.874 | 0.0002 |
| Carnivoran species (OPC) | 48.24 (33.37–56.50) | −10.93 (−15.64– −2.04) | 0.562 | 0.0001 |
| Carnivoran families (OPC) | 50.83 (26.74–62.61) | −12.14 (−20.62–1.64) | 0.812 | 0.0011 |
Acknowledgments
We thank M. Fortelius, J. Eronen, I. Thesleff, P. Munne, for discussions; S. Alto, M. Mäkinen, R. Santalahti, R. Savolainen, and M. Christensen for technical assistance; P. Schneider for the Fc-EDA-A1-protein; F. de Sauvage for HhAntag compound; Hou Yemao for tomography; and Finnish Museum of Natural History (Helsinki, Finland), Museum of Natural History (Stockholm, Sweden), and Museum für Naturkunde (Berlin, Germany) for specimen loans. This work was supported by the Academy of Finland to J.J., M.M., I.S.-C., R01-DE021420 (NIH/NIDCR) and an NIH Director’s New Innovator Award DP2-OD007191 to O.D.K, an Australian Research Council Future Fellowship to A.R.E, and the Major Basic Research Projects (2012CB821904) of MST to Z.-Q.Z.
Footnotes
Supplementary Information is available in the online version of the paper.
Author Contributions E.H., J.J. and O.D.K. designed the project and wrote the initial manuscript. E.H. and E.R. performed culturing experiments and K.S. mouse experiments. E.H., E.R., A.K. and J.J. performed measurements and prepared images. I.J.C., A.R.E. and J.J. analysed evolutionary data. I.S.-C. constructed the computational model and T.H. the ToothMaker. M.L.M., Z.-Q.Z provided materials, observations and scientific interpretations. O.D.K. and J.J. coordinated the study. All authors discussed the results and provided input on the manuscript.
Data are presented in the Supplementary and Extended Data Tables, available in the MorphoBrowser database (http://morphobrowser.biocenter.helsinki.fi/) and from the authors, and models can be accessed at (http://dead.cthulhu.fi/ToothMaker/).
Reprints and permissions information is available at www.nature.com/reprints.
The authors declare no competing financial interests.
Readers are welcome to comment on the online version of the paper.
References
- 1.Luo ZX, Cifelli RL, Kielan-Jaworowska Z. Dual origin of tribosphenic mammals. Nature. 2001;409:53–57. doi: 10.1038/35051023. [DOI] [PubMed] [Google Scholar]
- 2.Meng J, Wyss AR. The morphology of Tribosphenomys (Rodentiaformes, Mammalia): Phylogenetic implications for basal Glires. J Mamm Evol. 2001;8:1–71. [Google Scholar]
- 3.Asher RJ, et al. Stem lagomorpha and the antiquity of Glires. Science. 2005;307:1091–1094. doi: 10.1126/science.1107808. [DOI] [PubMed] [Google Scholar]
- 4.O’Leary MA, et al. The placental mammal ancestor and the post-K-Pg radiation of placentals. Science. 2013;339:662–667. doi: 10.1126/science.1229237. [DOI] [PubMed] [Google Scholar]
- 5.Kluge AG, Farris JS. Quantitative phyletics and the evolution of anurans. Syst Zool. 1969;18:1–32. [Google Scholar]
- 6.Felsenstein J. Maximum-likelihood and minimum-steps methods for estimating evolutionary trees from data on discrete characters. Syst Zool. 1973;22:240–249. [Google Scholar]
- 7.Doyle JJ. Trees within trees: genes and species, molecules and morphology. Syst Biol. 1997;46:537–553. doi: 10.1093/sysbio/46.3.537. [DOI] [PubMed] [Google Scholar]
- 8.O’Keefe FR, Wagner PJ. Inferring and testing hypotheses of cladistic character dependence by using character compatibility. Syst Biol. 2001;50:657–675. doi: 10.1080/106351501753328794. [DOI] [PubMed] [Google Scholar]
- 9.Wake DB. Phylogenetic implications of ontogenetic data. Geobios. 1989;22 (supp 2):369–378. [Google Scholar]
- 10.Kangas AT, Evans AR, Thesleff I, Jernvall J. Nonindependence of mammalian dental characters. Nature. 2004;432:211–214. doi: 10.1038/nature02927. [DOI] [PubMed] [Google Scholar]
- 11.Luo ZX. Transformation and diversification in early mammal evolution. Nature. 2007;450:1011–1019. doi: 10.1038/nature06277. [DOI] [PubMed] [Google Scholar]
- 12.Polly PD. Developmental dynamics and G-matrices: can morphometric spaces be used to model evolution and development? Evol Biol. 2008;35:83–96. [Google Scholar]
- 13.Rice SH. Theoretical approaches to the evolution of development and genetic architecture. Ann NY Acad Sci. 2008;1133:67–86. doi: 10.1196/annals.1438.002. [DOI] [PubMed] [Google Scholar]
- 14.Salazar-Ciudad I, Marin-Riera M. Adaptive dynamics under development-based genotype-phenotype maps. Nature. 2013;497:361–364. doi: 10.1038/nature12142. [DOI] [PubMed] [Google Scholar]
- 15.Grüneberg H. Genes and genotypes affecting the teeth of the mouse. J Embryol Exp Morphol. 1965;14:137–159. [PubMed] [Google Scholar]
- 16.Harfe BD, et al. Evidence for an expansion-based temporal Shh gradient in specifying vertebrate digit identities. Cell. 2004;118:517–528. doi: 10.1016/j.cell.2004.07.024. [DOI] [PubMed] [Google Scholar]
- 17.Jernvall J, Keränen SVE, Thesleff I. Evolutionary modification of development in mammalian teeth: quantifying gene expression patterns and topography. Proc Natl Acad Sci USA. 2000;97:14444–14448. doi: 10.1073/pnas.97.26.14444. [DOI] [PMC free article] [PubMed] [Google Scholar]
- 18.Gaide O, Schneider P. Permanent correction of an inherited ectodermal dysplasia with recombinant EDA. Nature Med. 2003;9:614–618. doi: 10.1038/nm861. [DOI] [PubMed] [Google Scholar]
- 19.Harjunmaa E, et al. On the difficulty of increasing dental complexity. Nature. 2012;483:324–327. doi: 10.1038/nature10876. [DOI] [PubMed] [Google Scholar]
- 20.Arthur W. Evolution: a Developmental Approach. Wiley-Blackwell; 2011. [Google Scholar]
- 21.Salazar-Ciudad I, Jernvall J. A computational model of teeth and the developmental origins of morphological variation. Nature. 2010;464:583–586. doi: 10.1038/nature08838. [DOI] [PubMed] [Google Scholar]
- 22.Butler PM. Early trends in the evolution of tribosphenic molars. Biol Rev Camb Philos Soc. 1990;65:529–552. [Google Scholar]
- 23.Osborn JW, Crompton AW. The evolution of mammalian from reptilian dentitions. Breviora. 1973;399:1–18. [Google Scholar]
- 24.Wessels W. Miocene rodent evolution and migration: Muroidea from Pakistan, Turkey and North Africa. Geol Ultraiectina. 2009;307:1–290. [Google Scholar]
- 25.López Antoñanzas R. First Potwarmus from the Miocene of Saudi Arabia and the early phylogeny of murines (Rodentia: Muroidea) Zool J Linn Soc. 2009;156:664–679. [Google Scholar]
- 26.Van Valkenburgh B. Major patterns in the history of carnivorous mammals. Annu Rev Earth Planet Sci. 1999;27:463–493. [Google Scholar]
- 27.Evans AR, Wilson GP, Fortelius M, Jernvall J. High-level similarity of dentitions in carnivorans and rodents. Nature. 2007;445:78–81. doi: 10.1038/nature05433. [DOI] [PubMed] [Google Scholar]
- 28.Santana SE, Strait S, Dumont ER. The better to eat you with: functional correlates of tooth structure in bats. Funct Ecol. 2011;25:839–847. [Google Scholar]
- 29.Luo ZX, Ji Q, Yuan CX. Convergent dental adaptations in pseudo-tribosphenic and tribosphenic mammals. Nature. 2007;450:93–97. doi: 10.1038/nature06221. [DOI] [PubMed] [Google Scholar]
- 30.Kavanagh KD, Evans AR, Jernvall J. Predicting evolutionary patterns of mammalian teeth from development. Nature. 2007;449:427–432. doi: 10.1038/nature06153. [DOI] [PubMed] [Google Scholar]
- 31.Jacob F. Evolution and tinkering. Science. 1977;196:1161–1166. doi: 10.1126/science.860134. [DOI] [PubMed] [Google Scholar]
- 32.Cho SW, et al. Interactions between Shh, Sostdc1 and Wnt signaling and a new feedback loop for spatial patterning of the teeth. Development. 2011;138:1807–1816. doi: 10.1242/dev.056051. [DOI] [PubMed] [Google Scholar]
- 33.Gomes Rodrigues HG, et al. Roles of dental development and adaptation in rodent evolution. Nat Commun. 2013;4:2504. doi: 10.1038/ncomms3504. [DOI] [PubMed] [Google Scholar]
- 34.Van Valen L. An analysis of developmental fields. Dev Biol. 1970;23:456–477. doi: 10.1016/0012-1606(70)90110-7. [DOI] [PubMed] [Google Scholar]
- 35.Goswami A, Polly PD. In: Carnivoran Evolution: New Views on Phylogeny, Form, and Function. Goswami A, Friscia A, editors. Cambridge University Press; 2010. pp. 141–164. [Google Scholar]
- 36.Bhullar BA, et al. Birds have paedomorphic dinosaur skulls. Nature. 2012;487:223–226. doi: 10.1038/nature11146. [DOI] [PubMed] [Google Scholar]
- 37.Närhi K, Thesleff I. Explant culture of embryonic craniofacial tissues: analyzing effects of signaling molecules on gene expression. Methods Mol Biol. 2010;666:253–267. doi: 10.1007/978-1-60761-820-1_16. [DOI] [PubMed] [Google Scholar]
- 38.Mauldin EA, Gaide O, Schneider P, Casal ML. Neonatal treatment with recombinant ectodysplasin prevents respiratory disease in dogs with X-linked ectodermal dysplasia. Am J Med Genet. 2009;149A:2045–2049. doi: 10.1002/ajmg.a.32916. [DOI] [PMC free article] [PubMed] [Google Scholar]
- 39.Wilson GP, et al. Adaptive radiation of multituberculate mammals before the extinction of dinosaurs. Nature. 2012;483:457–460. doi: 10.1038/nature10880. [DOI] [PubMed] [Google Scholar]
- 40.Hammer Ø, Harper DAT, Ryan PD. PAST: paleontological statistics software package for education and data analysis. Pal Electron. 2001;4 http://palaeo-electronica.org/2001_1/past/issue1_01.htm. [Google Scholar]
- 41.Fliniaux I, Mikkola ML, Lefebvre S, Thesleff I. Identification of dkk4 as a target of Eda-A1/Edar pathway reveals an unexpected role of ectodysplasin as inhibitor of Wnt signalling in ectodermal placodes. Dev Biol. 2008;320:60–71. doi: 10.1016/j.ydbio.2008.04.023. [DOI] [PubMed] [Google Scholar]
- 42.Yauch RL, et al. A paracrine requirement for hedgehog signalling in cancer. Nature. 2008;455:406–410. doi: 10.1038/nature07275. [DOI] [PubMed] [Google Scholar]
- 43.Schindelin J, et al. Fiji: an open-source platform for biological-image analysis. Nature Methods. 2012;9:676–682. doi: 10.1038/nmeth.2019. [DOI] [PMC free article] [PubMed] [Google Scholar]