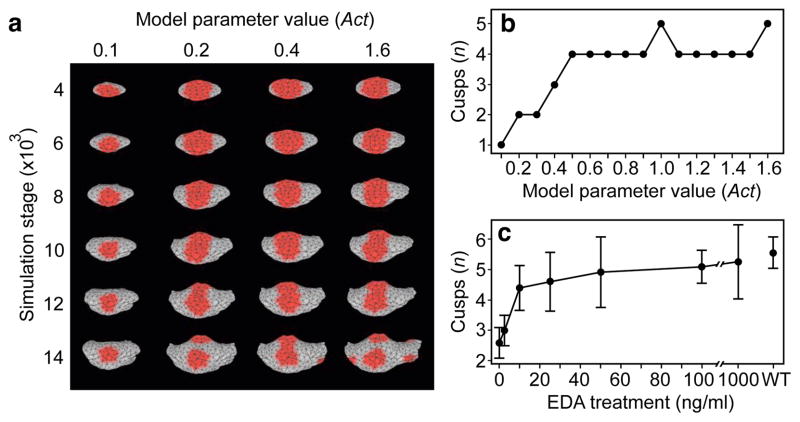
Figure 2. Computational modelling of gradual changes in signalling on cusp patterns.
a, Computer simulations using ToothMaker (Extended Data Fig. 2) of first lower molar development show appearance of cusp areas (red colour). Larger values of activator (Act) parameter increase cusps. b, Modelled wild-type mouse pattern is largely retained until Act = 0.5. Smaller Act values quickly reduce cusps resulting in modelled teeth that resemble Eda null teeth. c, Tabulated data from culture experiments (Supplementary Table 1) show an abrupt change in cusps at low levels of EDA protein (2.5 to 10 ng ml−1), similar to modelling data (b). Increasing EDA concentration does not increase cusps beyond wild type (WT). Error bars denote s.d. Anterior is towards the left in a.

