

Abstract
Background/Objective:
Medication reconciliation at transitions of care decreases medication errors, hospitalizations, and adverse drug events. We compared inpatient medication histories and reconciliation across disciplines and evaluated the nature of discrepancies.
Methods:
We conducted a prospective cohort study of patients admitted from the emergency department at our 760-bed hospital. Eligible patients had their medication histories conducted and reconciled in order by the admitting nurse (RN), certified pharmacy technician (CPhT), and pharmacist (RPh). Discharge medication reconciliation was not altered. Admission and discharge discrepancies were categorized by discipline, error type, and drug class and were assigned a criticality index score. A discrepancy rating system systematically measured discrepancies.
Results:
Of 175 consented patients, 153 were evaluated. Total admission and discharge discrepancies were 1,461 and 369, respectively. The average number of medications per participant at admission was 8.59 (1,314) with 9.41 (1,374) at discharge. Most discrepancies were committed by RNs: 53.2% (777) at admission and 56.1% (207) at discharge. The majority were omitted or incorrect. RNs had significantly higher admission discrepancy rates per medication (0.59) compared with CPhTs (0.36) and RPhs (0.16) (P < .001). RPhs corrected significantly more discrepancies per participant than RNs (6.39 vs 0.48; P < .001); average criticality index reduction was 79.0%. Estimated prevented adverse drug events (pADEs) cost savings were $589,744.
Conclusions:
RPhs committed the fewest discrepancies compared with RNs and CPhTs, resulting in more accurate medication histories and reconciliation. RPh involvement also prevented the greatest number of medication errors, contributing to considerable pADE-related cost savings.
Key Words: admission, evaluation study, discharge, medication reconciliation
Obtaining medication histories and conducting medication reconciliation are challeng ing tasks with the advent of new molecular entities and orphan drugs.1 As Franklin reported, “Patients who once came into the [physician] office carrying their medications in a purse, or pocket, now need a shopping bag.”2 The importance of accurate medication histories cannot be overemphasized; nearly 27% of all hospital prescribing errors originate from incorrect admission medication histories, over 70% of drug-related problems are only discovered through patient interview, and more than 50% of discharge discrepancies are associated with admission discrepancies.3–6
In 2010, an Institute of Medicine report estimated that if hospitals prevented adverse drug events (pADEs) and redundant tests, the associated cost savings would be nearly $25 billion annually.7 One organization decreased inpatient care costs by 30% when no medication reconciliation errors were reported over 24 months. 7
Multiple organizations have supported medication reconciliation to improve quality of care, reduce preventable hospital admissions and readmissions, and decrease the incidence of adverse health care- associated conditions.8–11 Although The Joint Commission does not indicate the discipline to perform this role, evidence supports the role of registered pharmacists (RPhs), pharmacy students, and pharmacy technicians in collecting accurate medication histories. RPhs should be involved when high-risk medications are identified, more than 5 medications are reported, or patients are elderly.6,8,11–40 Therefore, our primary study objective was to compare inpatient medication histories and reconciliation processes across disciplines and to evaluate the nature of discrepancies using a novel method.
Methods
Study Design, Setting, and Participants
A prospective cohort study design was conducted in the Wesley Medical Center 760-bed acute care hospital from February 15, 2010 to April 11, 2010. Eligible patients were consented approximately 18 to 24 hours after being admitted to the hospital from the emergency department. Patients were excluded if they were direct hospital admissions or were readmitted to the hospital during the study period. The Wichita Medical Research and Education Foundation Institutional Review Board approved the study and required patient informed consent.
Medication History and Medication Reconciliation Initiation
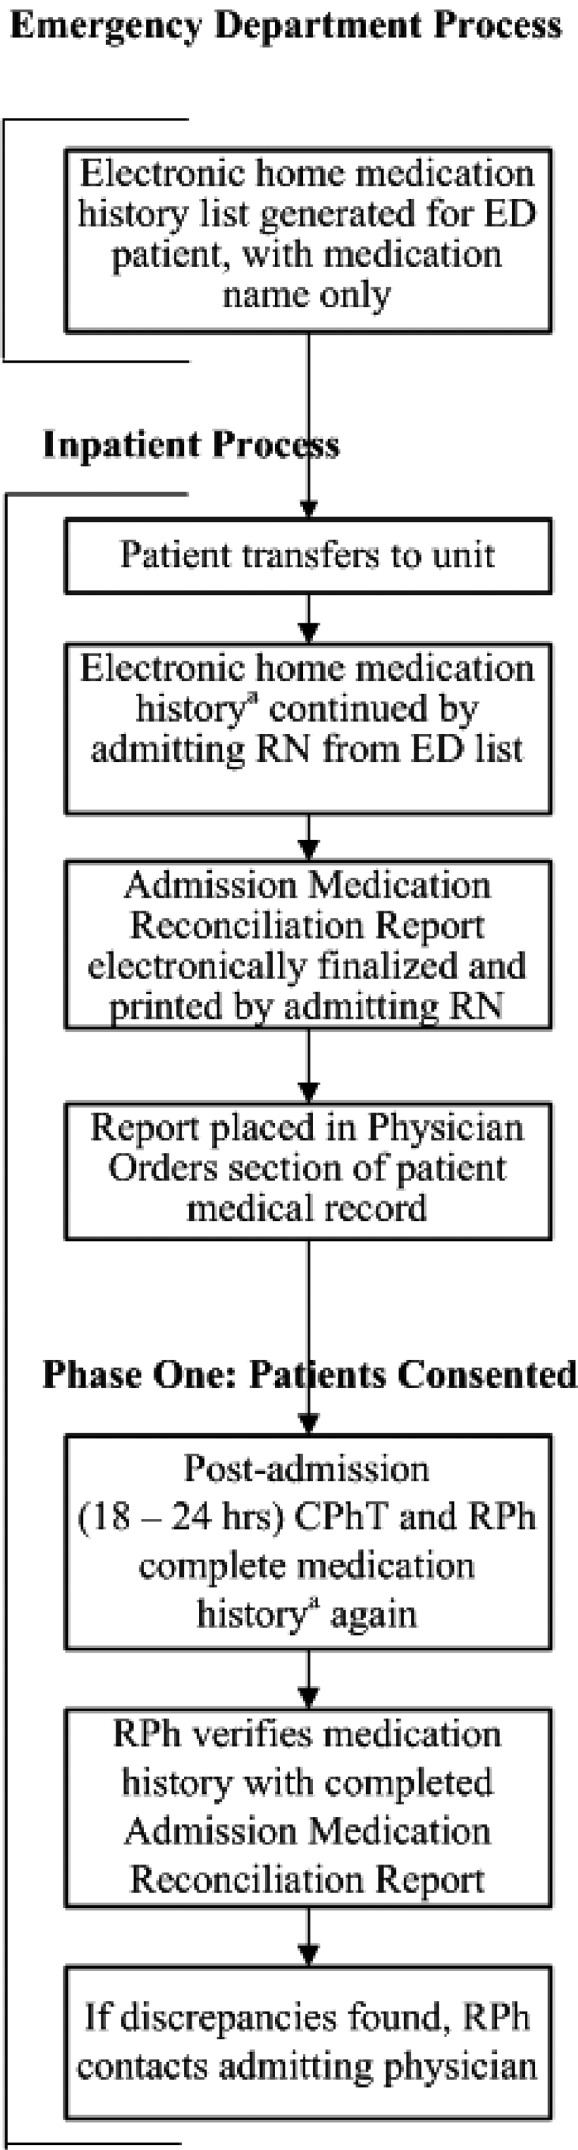
Iatric (version 2.5.151; Iatric Systems, Inc., Boxford, MA) and Meditech (version 5.6.3; MEDITECH, Westwood, MA) software was used for the medication history and reconciliation process. Participants had admission medication histories taken 3 times: first, by the admitting hospital unit nurse (RN), then by a certified pharmacy technician (CPhT), and finally by an RPh (Figure 1). In a previous medication history study at our institution, RNs altered their process when pharmacists were involved; therefore, RNs were blinded to the study protocol.41 CPhTs and RPhs were not blinded to the study protocol. CPhTs telephoned pharmacies and physician offices to request faxed medication lists for review. However, they did not discuss these medication lists, because this has been deemed not permissible by some pharmacy boards.42 Changes to the medication and allergy history could be made electronically by the RN or RPh; the documented history and changes were accessible to the investigators by audit report. Adverse drug reactions (ADRs) and medication errors were reported per hospital policy. The discharge medication reconciliation process was completed according to hospital policy, such that RNs completed the participant discharge medication list with a second RN verifying the list.
Figure 1. Medication history and reconciliation process. CPhT = certified pharmacy technician; ED = emergency department; RN = nurse; RPh = pharmacist. aComplete history obtained: allergies and intolerances, previous vaccinations, prescription medications, over-the-counter products and herbal supplements; medication name, route, dose, frequency, date/time last dose taken, indication (if known).
Primary Outcome: Medication Discrepancies
Medication discrepancies were identified by comparing medication histories and interventions documented by the RN, CPhT, and RPh to each other and to the physician’s home medication orders on admission. Discrepancies were classified using the Medication Discrepancy Tool (MDT) developed by Smith and colleagues,43 which addresses causes and contributing factors at both the patient and system levels. A discrepancy enumeration worksheet was used to capture the discipline committing the discrepancy, the discrepancy category (extra, omitted, duplicate, incomplete, incorrect) and drug data dictionary noncompliance (explanation below), the attribute (medication, dose, route, frequency), occurrence (admit, discharge), drug involved, resolution (fixed, not fixed), discipline resolving the discrepancy, and whether the computer system was involved.
Drug dictionary discrepancies occurred when medications were typed as free text rather than selected using the drug data dictionary, which categorized and sorted medications in the appropriate American Hospital Formulary Service (AHFS) pharmacologictherapeutic classification system.44 Free-text medications appeared in a separate section at the bottom of the discharge medication reconciliation report, potentially allowing medications to be selected from duplicate drug classes, that is, an unclassified home medication (typed as free text) and an AHFS classified hospital administered medication (from the drug data dictionary). Unresolved admission discrepancies were counted at discharge if the provider selected the medication containing the discrepancy for the participant discharge list. Thus, we tracked the number and type of discrepancies that occurred from the beginning through the end of participant hospitalization.
Other Variables
Participant characteristics included sex, age range, body mass index (BMI), reason for admission, concomitant disease state(s), principle diagnosis, length of stay, and 30- and 90-day readmission rates. Number and type of medications (ie, prescription medications, over-the-counter products, herbals) at admission and discharge, medication discrepancies, prevented medication discrepancies, ADRs, pADEs, and core measures falling out of compliance were tabulated. pADEs were defined as those discrepancies committed on admission by the RN that were avoided because of RPh intervention. To be included as pADEs, discrepancies were required to have a severity ranking of 5 or greater and a detection ranking of 5 or greater (see method for calculating below). Information obtained during the medication reconciliation process included number of pharmacies used by participants, number of faxes obtained and phone calls required, and the method for home medication reconciliation.
Calculations for Evaluating Discrepancies
The unit of analysis for comparing discrepancies among the 3 disciplines (RN, CPhT, and RPh) was the medication discrepancy rate, defined as the number of discrepancies per number of medications. To assign a score to each discrepancy, a failure mode effect and criticality analysis (FMECA) was conducted using Williams and Talley definitions.45 The criticality index (CrI) for each failure (discrepancy) was calculated using the following equation:
where FMECA rankings were finite numbers per Williams and Talley definitions45: occurrence frequency = 1 through 10, effect severity = 1 through 9, and detection probability = 1 through 9 (Table 1). Detection probability was subjective because identification of the discrepancy had to occur by the pharmacist reviewer.
Table 1. Failure mode effect and criticality analysis (FMECA) attributes.
| Williams & Talley45 FMECA attributes | Study FMECA attributes | ||
| Occurrence | |||
| Likelihood of occurrence & probability | Ranking | Sample occurrence by discrepancy per patient-days | Ranking |
| Remote, no known occurrence; 1 in 10,000 | 1 | X > 0.0001 (once per 10,000 patient-days) | 1 |
| Low, possible, but no known data; 1 in 5,000 | 2, 3, 4 | X > 0.0002 (once per 5,000 patient-days) | 3 |
| Moderate, documented, but infrequent; 1 in 200 | 5, 6 | X > 0.005 (once per 200 patient-days) | 5 |
| High, documented, and frequent; 1 in 100 and 1 in 50 | 7, 8 | X > 0.01 (once per 100 patient-days) X > 0.02 (once per 50 patient-days) |
7 8 |
| Very high, documented, almost certain error; 1 in 20 and 1 in 10 | 9, 10 | X > 0.05 (once per 20 patient-days) X > 0.1 (once per 10 patient-days) |
9 10 |
| Severity | |||
| Outcome possibilities | Ranking | AHFS classification | Ranking |
| Slight annoyance, may affect the system | 1 | Antihistamine Drugs (4:00), Respiratory Tract Agents (48:00), Local Anesthetics (72:00), Skin and Mucous Membrane Agents (84:00), Vitamins (88:00), Unclassified (grouped as AHFS: 48, 84, 88, 3 = unclassified) |
1 |
| Moderate system problem, may affect the patient | 2, 3 | Autonomic Drugs (12:00); Selective α1-Adrenergic Blocking Agents (12:16.04.12); Antilipemic Agents (24:06); Eye, Ear, Nose, and Throat Preparations (52:00); Gastrointestinal Drugs (56:00); Adrenals (68:04); Smooth Muscle Relaxants (86:00); Genitourinary Smooth Muscle Relaxants (86:12); Vitamin D (88:16); 5-α-Reductase Inhibitors (92:08); Antigout Agents (92:16); Bone Resorption Inhibitors (92:24); Other Miscellaneous Therapeutic Agents (92:92); Herbal Supplements (grouped as AHFS: 12, 24.06, 52, 56, 86, 92, 0=herbal supplements) |
3 |
| Major system problem, may affect the patient | 4, 5 | Anti-infective Agents (8:00); Analgesics and Antipyretics (28:08); Anticonvulsants (28:12); Psychotherapeutic Agents (28:16); Anorexigenic Agents and Respiratory and Cerebral Stimulants (28:20); Anxiolytics, Sedatives, and Hypnotics (28:24); Antimigraine Agents (28:32); Antiparkinsonian Agents (28:36); Central Nervous System Agents, Miscellaneous (28:92); Electrolyte, Caloric, and Water Balance (40:00) (grouped as AHFS: 8, 28, 28.1, 40) |
5 |
| Minor injury | 6 | ||
| Major injury | 7 | Antineoplastic Agents (10:00); Blood Formation, Coagulation, and Thrombosis (20:00); Antianemia Drugs (20:04); Cardiovascular Drugs (24:00); Hormones and Synthetic Substitutes (68:00); Immunosuppressive Agents (92:44) (grouped as AHFS: 10, 20, 24, 68) | 7 |
| Terminal injury or death | 8, 9 | ||
| Detection | |||
| Likelihood of detection & probability | Ranking | Discrepancy type & attribute | Ranking |
| Very high, system will always detect error; 9 of 10 | 1 | Omitted dose, Omitted route, Omitted frequency. Incomplete medication, Incomplete dose, Incomplete route. | 1 |
| High, error likely to be detected before product reaches patient; 7 of 10 | 2, 3 | Extra route, Extra duplicate medication. Incomplete frequency. Incorrect route. | 3 |
| Moderate, moderate likelihood of detection before error reaches patient; 5 of 10 and 4 of 10 | 4, 5, 6 | Incorrect medication, Incorrect dose, Incorrect frequency. | 5 |
| Low, low likelihood that error will be detected before product/service reaches patient; 2 of 10 and 1 of 10 | 7, 8 | Omitted medication. Extra medication, Extra dose, Extra frequency. | 7 |
| Remote, detection not possible at any point within system; 0 of 10 | 9 | ||
Note: AHFS = American Hospital Formulary Service.
A novel method of computer programming, the Discrepancy Rating System (DRS), was developed to systematically evaluate the impact of discrepancies as calculated by the CrI for each discrepancy committed or avoided. First, a search of the discrepancy database was completed to determine the FMECA occurrence frequency ranking. Each discrepancy was assigned an occurrence rating by categorizing all discrepancies by discipline, admit/discharge, drug class, and fixed/not fixed. For each discrepancy, the sum of all other discrepancies matching it in every category was taken and distributed over the entire 718 patient-day study period. The rate (discrepancy of this type per patient-day) was then used to assign an occurrence rating for discrepancy.
Next, the FMECA effect severity ranking was determined by 3 blinded clinical RPhs with medication safety training at our institution using AHFS classification. Finally, the same 3 blinded clinical RPhs determined detection probability ranking by discrepancy type and attribute. Once values were assigned, the discrepancy database was programmed to calculate a CrI for admission and discharge discrepancies, both committed and avoided. CrI scores (CrIS) were tabulated and labeled as positive when discrepancies reached the participant, whereas discrepancies avoided were negative. To calculate the mean CrIS per participant by discipline, CrIS were summed and divided by number of discrepancies, such that
where j = disciplines, n = participants, and d = number of discrepancies. Thus, at admission, each participant had 6 mean CrIS (3 negative and 3 positive) and 4 mean CrIS at discharge (2 negative and 2 positive).
Because participants took various numbers of medications, a weighted criticality index (CrISw) was calculated in order to assign an overall admission score to each participant that represented the severity of medication errors by discipline:
where w = total number of medications prescribed at admission.
Statistical Analysis
A power analysis indicated that 144 patients would be sufficient to detect a 30% discrepancy rate between disciplines, with 80% power and a 5% significance level. This analysis was based on our previously published medication reconciliation study 41 where 30% represents the difference from a 70% accuracy rating for RPhs versus a 40% rating for RNs.
Descriptive statistics were conducted to summarize all variables. Participant characteristics were compared by sex using 2-sample proportions z test, t tests for continuous variables, and chi-square tests for categorical variables. Number of discrepancies per discipline was summarized by drug class and type for both admission and discharge. Discipline groups included in the admission reconciliation process were RN, CPhT, and RPh, whereas disciplines for discharge were RN and RPh. Admission corrections were also summarized by drug class and discipline.
A reliability analysis was conducted to compare medication discrepancy rates among disciplines. Both Cronbach’s alpha and intraclass correlation coefficients (ICCs) were reported. Cronbach’s alpha measured reliability, whereas ICCs assessed agreement between the disciplines. Both single and average ICCs were calculated using 2-way mixed effects models with absolute agreement. The model assumed the disciplines were fixed factors and discrepancy rates were random effects. A fixed rater effect was chosen, because it does not allow findings to be generalized to other raters and because raters were not randomly selected. Absolute agreement measured the extent to which disciplines were assigned the same absolute score and assumed that systematic variability due to the discipline was relevant. Single measures of reliability were those in which the individual scores constituted the unit of analysis and gave reliability of a single discipline’s score, and they were used to assess whether the scores of one discipline were apt to be the same as for another discipline (ie, RNs vs CPhTs). Average measures of reliability assessed the stability of the mean score. Interpretation of analysis results were based on ICC 0.40 or less, poor to fair agreement; 0.41 to 0.60, moderate agreement; 0.61 to 0.80, good agreement; and 0.81 to 1.00, excellent agreement. To compare rates between disciplines, 2-sample proportion z tests were conducted. Because multiple tests were conducted, the Bonferroni correction method was used to determine statistical significance. Similarly to above, 2 additional reliability analyses were conducted to evaluate discipline agreement on both negative and positive CrISw. For these, Hotelling’s T 2 was used to assess the extent to which CrISw (negative or positive) agreed among disciplines. Finally, to evaluate the extent to which medication discrepancies may have influenced patient readmission, the association between admission discrepancy rates and readmission status was examined at 30 and 90 days post discharge. Statistical analyses were conducted using IBM SPSS Statistics (version 20; IBM Corp., Armonk, NY).
Results
A total of 153 consented participants were evaluated in this prospective cohort study (Figure 2). Participant characteristics by sex are summarized in Table 2. There were significantly more females than males (90 of 153 [58.8%]; z = 3.087, P = .002). Whereas there were no significant differences for mean BMI between males and females, examination with standard groupings revealed there were significantly more females within a BMI category of 24.9 or less (36 of 84 [42.9%]; χ2 = 12.6, P = .006). Distribution of principle diagnosis is represented in eFigure 1. Nearly 18% of participants had some type of respiratory disease, followed by circulatory and digestive disorders (13.7% each). The quantity of total medications per participant increased at discharge, with a median of 7 (mean 8.59, SD 5.97) at admission compared to 8 (mean 9.41, SD 5.78) at discharge (Table 3).
Figure 2. Participant flow diagram.
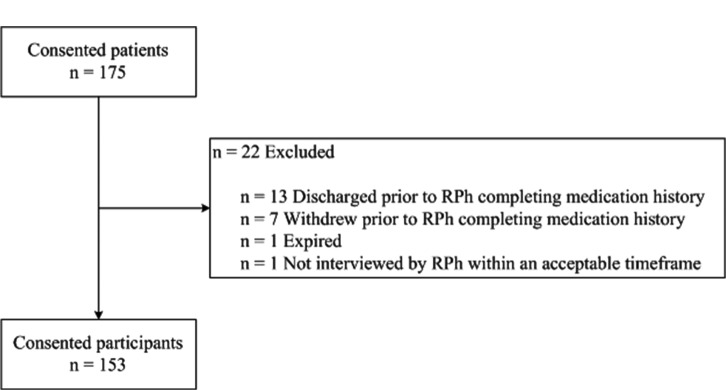
Table 2. Participant characteristics by sex.
| Group, n (%)a | |||
| Characteristics (n = 153) | Males | Females | P |
| Sex | 63 (41.2) | 90 (58.8) | .002 |
| Age group, yearsb | |||
| 0-17 | 7 (11.1) | 4 (4.4) | .31 |
| 18-40 | 11 (17.5) | 25 (27.8) | |
| 41-64 | 21 (33.3) | 27 (30.0) | |
| 65-80 | 16 (25.4) | 19 (21.1) | |
| 81 and over | 8 (12.7) | 15 (16.7) | |
| BMI groupc | |||
| < 18.5 | 0 (0.0) | 5 (6.0) | .006 |
| 18.5 to 24.9 | 10 (18.9) | 31 (36.9) | |
| 25.0 to 29.9 | 21 (39.6) | 15 (17.8) | |
| 30.0 or more | 22 (41.5) | 33 (39.3) | |
| LOS, daysd | |||
| 2 or less | 13 (20.6) | 16 (17.8) | .15 |
| 3 | 15 (23.8) | 21 (23.3) | |
| 4 | 19 (30.2) | 16 (17.8) | |
| 5 or more | 16 (25.4) | 37 (41.1) | |
Note: BMI = body mass index (calculated as weight in kilograms divided by height in meters squared); LOS = length of stay in days (calculated as day of admission through day of discharge).
Percentages have been rounded and might not total 100. Denominators may vary because of missing data.
Mean (SD) age: males = 51.9 (24.9), females = 55.0 (23.2); P = .44.
Mean (SD) BMI (included age >17 years; n = 137): males = 29.3 (7.2), females = 30.2 (13.0); P = 0.59.
Mean (SD) length of stay (LOS): males = 4.4 (3.1), females = 4.9 (3.2); P = .38.
Table 3. Medications and medication reconciliation processes.
| Medications | N |
| Admission (n = 153)a | 1,314 |
| Discharge (n = 146)b | 1,374 |
| Med rec processes | n (%)c |
| No. of pharmacies used by participants | |
| None | 12 (7.8) |
| 1 | 103 (67.3) |
| 2 or more | 38 (24.8) |
| Faxes obtained by CPhT for med rec | |
| None | 47 (30.7) |
| 1 | 96 (62.7) |
| 2 or more | 10 (6.5) |
| Phone calls required by RPh for med rec | |
| None | 134 (87.6) |
| 1 | 17 (11.1) |
| 2 or more | 2 (1.4) |
| Method for home med rec | |
| Signed | 90 (58.8) |
| Telephone order read back | 14 (9.2) |
| Electronic signature | 22 (14.4) |
| Not done | 27 (17.6) |
Note: CPhT = certified pharmacy technician; med rec = medication reconciliation; RPh = pharmacist.
Median (range) = 7 (0, 28); mean (SD) = 8.59 (5.97).
Median (range) = 8 (0, 29); mean (SD) = 9.41 (5.78).
Percentages have been rounded and may not total 100. Denominators may vary because of missing data.
Discrepancies and Reliability Agreement Between Disciplines
The total number of discrepancies at admission across all disciplines (RN, CPhT, and RPh) was 1,461 and at discharge was 369 (RN and RPh) (eTable 1). The majority of discrepancies occurred for RNs at admission and discharge (777 [53.2%] and 207 [56.1%], respectively); of those, Analgesics and Antipyretics/Anorexigenic Agents and Respiratory and Cerebral Stimulants had the most frequently reported discrepancies. The number of corrected admission discrepancies was 1,102. RPhs had the most correction occurrences (977 [88.7%]) at admission. Similar to RNs, discrepancies and corrections occurred most often with Analgesics and Antipyretics/ Anorexigenic Agents and Respiratory and Cerebral Stimulants.
Across all disciplines, the majority of discrepancies were categorized as either omitted or incorrect (Table 4). Of the 777 total discrepancies reported for RNs, 405 (52.1%) were omitted and 204 (26.3%) were incorrect. Overall discrepancy rate occurrence per medication was significantly higher for RNs compared with CPhTs (0.59 vs 0.36, respectively; P < .001) (average number of discrepancies per participant, 5.08 vs 3.10). At admission, RPhs corrected 469 of 1,102 (42.6%) omitted discrepancies. A substantial reduction in the number of all discrepancy types occurred at discharge compared to admission.
Table 4. Frequencies and rates for discrepancies and discrepancy corrections by type, hospital status, and discipline.
| Type of discrepancy a | Overall rates | ||||||||
| DESCRIPTION | Extra | Omitted | Duplicate | Incomplete | Incorrect | Drug data dictionary | PER MEDICATIONb | PER PARTICIPANTc | Pd |
| Admission (n= 153; total medication count = 1,314; mean drug count = 8.59) | |||||||||
| RN | 35 | 405 | 5 | 79 | 204 | 49 | 0.59 | 5.08 | <.001 |
| CPhT | 80 | 187 | 7 | 83 | 117 | 0 | 0.36 | 3.10 | <.001 |
| RPh | 13 | 100 | 5 | 20 | 44 | 28 | 0.16 | 1.37 | |
| Correctede | |||||||||
| RN | 12 | 44 | 0 | 4 | 11 | 2 | 0.06 | 0.48 | <.001 |
| RPh | 89 | 469 | 9 | 131 | 256 | 23 | 0.74 | 6.39 | |
| Discharge (n= 146; total medication count = 1,374; mean drug count = 9.41) | |||||||||
| RN | 17 | 89 | 3 | 18 | 55 | 25 | 0.15 | 1.42 | .01 |
| RPh | 3 | 84 | 2 | 16 | 31 | 26 | 0.12 | 1.11 | |
Note: CPhT = certifieded pharmacy technician; RN = nurse; RPh = pharmacist.
Total discrepancies = 1,830; admission discrepancies = 1,461; discharge discrepancies = 369.
Medication discrepancy rate = discrepancy count/total medication count.
Participant rate = discrepancy count/participant count (n).
Two sample proportions z test. Admission: RN vs CPhT = 11.84, CPhT vs RPh = 11.74. Corrections: RN vs RPh = 36.00. Discharge: RN vs RPh = 2.52.
Admission corrections. CPhTs did not correct discrepancies; MDs made 52 corrections not reported here; see eTable 1.
Criticality Index Assessment
Using CrI scores and the ICC criterion from above, both single and average ICC were poor agreement, with 0.16 and 0.37, respectively; Cronbach’s alpha was 0.45. Evaluation of agreement for CrISw
scores among disciplines is shown in Table 5. Results from reliability analyses for negative scores (discrepancies avoided) and positive scores (discrepancies reaching the participant) are displayed. Cronbach’s alpha revealed poor reliability when evaluating among negative scores (α = 0.36), whereas α = 0.80 for positive scores. Higher scores, both negative and positive, indicated more severe discrepancies committed by the discipline that required resolution; negative scores were ultimately resolved. The lowest measures of agreement occurred for single measures on the negative scores (ICC = 0.14), indicating that scores had poor agreement among disciplines, and on average measures (ICC = 0.32), indicating that scores had poor stability. Improved agreement was observed for positive scores. Admission CrI percent reduction by discrepancy type and attribute for RN discrepancies corrected by the RPh is reported in eTable 2. The average CrI reduction was 79.0% with RPh involvement, preventing discrepancies from reaching participants.
Table 5. Admission interrater reliability (ICC) of discrepancies requiring reconciliation among RNs, CPhTs, and RPhs.
| Discipline, mean (SD) | |||||
| ICCa (95% CI) | RN | CPhT | RPh | Pb | |
| Weighted negative CrISc (nd = 141) | -40.8 (68.8) | -24.0 (46.3) | -2.0 (8.0) | <.001 | |
| Cronbach’s α = 0.36 | |||||
| Single measures | 0.14 (0.04, 0.24) | ||||
| Average measures | 0.32 (0.12, 0.49) | ||||
| Weighted positive CrISe (nd = 141) | 6.9 (14.7) | 1.0 (4.7) | 5.3 (12.9) | <.001 | |
| Cronbach’s α = 0.80 | |||||
| Single measures | 0.53 (0.42, 0.64) | ||||
| Average measures | 0.77 (0.68, 0.84) | ||||
Note: CPhT = certified pharmacy technician; CrIS = criticality index score from failure mode effect and criticality analysis (FMECA); RN = nurse; RPh = pharmacist.
Intraclass correlation coefficient 2-way mixed effects model, absolute agreement.
Hotelling’s T2.
Weighted negative CrIS are discrepancies avoided = (negative FMECA criticality index/discrepancy count/total medications prescribed).
n = 141 due to listwise deletion, ie, only those participants with discrepancy counts across all disciplines are included and with ≥1 medication.
Weighted positive CrIS are discrepancies that reached the participant = (positive FMECA criticality index/discrepancy count/total medications prescribed).
Medication Reconciliation and pADE Cost Savings
A total of 120 (78.4%) participants had admission discrepancies that were identified and fixed (negative CrI score) by the RPh. Using the cost-benefit ratio of $23.8:1,46 assuming a mean time of 20 minutes per participant for an RPh-conducted medication history and reconciliation17 and an RPh salary of $50 per hour, each RPh participant intervention would
result in a cost avoidance of $397 per participant for a total cost savings of $47,640. There were 262 pADEs in 96 participants: 1 pADE (n = 31), 2 pADEs (n = 23), 3 pADEs (n = 17), 4 pADEs (n = 9), 5 pADEs (n = 9), 6 pADEs (n = 3), 7 pADEs (n = 2), 10 pADEs (n = 1), and 11 pADEs (n = 1). Number of admission pADEs classified by AHFS, discrepancy type, and attribute is represented in Figure 3. Assuming an ADE cost of $2,378 per event,27 a conservative value, and excluding 14 pADE occurrences of the same drug and patient (ie, an incorrect drug dose and frequency), the total pADE-related cost savings was $589,744.
Figure 3.

Admission prevented adverse drug events (pADEs) by American Hospital Formulary Service (AHFS) drug class, discrepancy type, and attribute.
Adverse Drug Reactions and Medication Errors
Five (3.3%) study participants were admitted to the hospital because of documented adverse drug reactions (ADRs). There were no ADRs during hospitalization related to admission medication reconciliation; however, there was 1 ADR during hospitalization in a participant who experienced a rash to ketorolac, classified as a mild, type B reaction, nondose-related. There was 1 medication error during hospitalization related to admission medication reconciliation; per hospital policy, The National Coordinating Council for Medication Error Reporting and Prevention (NCC MERP) Classification was 2z (event occurred, no harm). There were no ADR or medication error readmissions related to discharge reconciliation.
Core Measure Interventions
RPhs intervened 12 times in 10 participants to meet core measures: 2 stroke interventions in 2 participants, 6 deep vein thrombosis prophylaxis interventions, and 2 acute coronary syndrome/acute myocardial infarction interventions. No participants fell out of compliance in any core measures.
Readmission Results
The association between admission discrepancy rates and readmission status at 90 days for 135 participants is shown in eFigure 2. Evaluation at 30 days is not shown, because data were sparse and few readmissions had occurred. RN discrepancy rates, compared to all other disciplines, were more pronounced in the 2 or more readmissions category; however, data were sparse and 4 participants had 2 or more readmissions during this period.
Discussion
Our study results indicate that CPhTs and RPhs prevented more discrepancies and committed less severe discrepancies than RNs. One possible explanation for these findings could be the dedicated time that both CPhTs and RPhs had to perform medication histories, whereas RNs are frequently required to multitask. Ophir and colleagues47 reported that people who multitask are more distracted compared to those who infrequently multitask. Another explanation may be that CPhTs received specialized training concerning what questions to ask when obtaining participant medication histories and were encouraged to call pharmacies and physician offices to have medication lists faxed when participants were unsure of their medications. CPhTs work with medications routinely; both CPhTs had retail pharmacy backgrounds and may have been more familiar with over-the-counter products and herbal supplements than RNs. Indeed, CPhTs had the lowest positive CrISw admission scores; no data dictionary discrepancies were attributed to this discipline. Finally, CPhTs and RPhs may have had an advantage in that participants had additional time after admission to recall their medication history due to the order and timing of the intervention by discipline. It is unknown whether reversing the timing of the intervention (ie, CPhT or RPh completing the medication history first) or providing RNs and CPhTs with the same access to medication information would have caused the results to differ. Regardless, because RNs were blinded, they had the same opportunity to verify the medication history and perform clarifications. In all, RNs corrected a total of 6 RN admission discrepancies (eTable 2).
This study presented a novel DRS using FMECA attributes to develop a CrISw to measure the magnitude and severity of medication discrepancies. This system, when used as outlined in the Methods section, could monitor potential and committed medication errors for continuous quality improvement programs in the hospital setting. For example, use of a CrISw paired with CPhT and RPh involvement targeting high-risk patient populations could quantitatively demonstrate a reduction in medication history and reconciliation errors. Moreover, implementing the DRS to improve the medication reconciliation process could potentially decrease the need for patient readmissions associated with medication errors at discharge. Systems of evaluating medication discrepancies using FMECA attributes may be helpful to other institutions that wish to consistently measure discrepancies, although these institutions may apply different ranking assignments to severity, detection, and occurrence. Therefore, future research is needed to evaluate discrepancies by discipline using a DRS.
This study had several limitations. First, it was originally proposed as a 2-phase project. However, phase 2 of the study was not initiated because there was no apparent relationship between raters, participant characteristics, and reliability (Table 5 and eTables 3 and 4). The use of fixed rater effects allows our results to be applied to the disciplines we used, but not to other disciplines. Second, because pADE cost was determined by discrepancies avoided, the cost savings that occurred because of RPh involvement unrelated to medications were not reported. One example was the identification of an incorrect weight (computer entry of 196 kg rather than 196 lbs) discovered by the RPh on participant interview. During hospitalization, the participant had medication orders for heparin using a weight-based nomogram and subsequently enoxaparin was dosed at 1 mg/kg, thus the weight clarification avoided a potential bleeding event. Bleeding prevention cost savings has been reported as $6,702 per event prevented.48 Third, a larger sample size may have been able to identify how to properly assign a specific health care discipline to a participant based upon admission characteristics. Last, future studies should consider a triage approach for conducting medication histories at admission with identical access to medication information for all disciplines, as well as conducting a sensitivity analysis for pADE-related cost savings.
Conclusions
This study used a novel method to evaluate discrepancies by discipline. RPhs committed fewer discrepancies than RNs and CPhTs, resulting in more accurate
medication histories and reconciliation, particularly when detecting omitted and incorrect medications. RPh involvement in medication history and reconciliation prevented the greatest number of medication errors, leading to substantial pADE-related cost savings.
Supplementary Material
Acknowledgments
Financial support/disclosures: This research was supported in part by a grant from the Cardinal Health Foundation for study conduct and data collection, management, analysis, and interpretation. The Cardinal Health Foundation did not participate in study design and conduct; collection, management, analysis, and data interpretation; and preparation, review, or approval of the manuscript. The University of Kansas School of Medicine Wichita received payment for Ms. Zackula’s role as statistical consultant and Mr. Stewart received payment for computer programming as a certified pharmacist technician. Dr. Kramer served as a Regional Cluster Coach for the US Department of Health and Human Services Health Resources and Services Administration Patient Safety and Pharmacy Services Collaborative (PSPC) from October 2011 to September 2012 and was a guest speaker at the North Dakota Health Care Review 2012 Quality Forum. Mr. Bond currently serves on the CareFusion Advisory Board. Dr. Fogg, Dr. Schminke, Dr. Nester, Dr. Eidem, Mr. Rosendale, Mr. Ragan, and Mr. Goertzen have no conflicts of interest to disclose.
Additional contributions: We acknowledge the Wesley Medical Center pharmacists and pharmacy technicians and Rebecca Lamis, PharmD, FISMP; Shauna Horacek, CPhT; Terry Steele, BSPharm; J. Alex DeBaun, MD; Laura A. Romine, PharmD; Tammy Northrop, RN; Jeremy Pauly, RN, BSN; and Rosie McCafferty.
References
- 1.IMS Institute for Healthcare Informatics. The Use of Medicines in the United States: Review of 2011. Parsippany, NJ: IMS Health Incorporated; 2012. [Google Scholar]
- 2.Franklin C.America’s epidemic of over-prescribing. http://gu.com/p/3v2eb/em Accessed November20, 2012.
- 3.Dobrzanski S, Hammond I, Khan G, et al. The nature of hospital prescribing errors. Br J Clin Govern. 2002;7(3):187–193. [Google Scholar]
- 4.Jameson JP, VanNoord GR.Pharmacotherapy consultation on polypharmacy patients in ambulatory care. Ann Phar-macol. 2001; 35 (7-8): 835–840. [DOI] [PubMed] [Google Scholar]
- 5.Patanwala AE, Sanders AB, Thomas MC, et al. A prospective, multicenter study of pharmacist activities resulting in medication error interception in the emergency department. Ann Emerg Med. 2012;59:369–373. [DOI] [PubMed] [Google Scholar]
- 6.Cornu P, Steurbaut S, Leysen T, et al. Effect of medication reconciliation at hospital admission on medication discrepancies during hospitalization and at discharge for geriatric patients. Ann Pharmacother. 2012;46:484–494. [DOI] [PubMed] [Google Scholar]
- 7.Institute of Medicine. The Healthcare Imperative: Lowering Costs and Improving Outcomes: Workshop Series Summary. Washington, DC: The National Academies Press; 2010. [PubMed] [Google Scholar]
- 8.Joint Commission on Accreditation of Health Organizations. Approved: Modifications to National Patient Safety Goal on reconciling medication information. Jt Comm Per-spect. 2011;31(1):1, 3–7. [PubMed] [Google Scholar]
- 9.National Quality Forum. Safe Practices for Better Healthcare: 2006 Update – A Consensus Report. Washington, DC: National Quality Forum; 2007. [Google Scholar]
- 10.National Priorities Partnership Convened by the National Quality Forum. Input to the Secretary of Health and Human Services on priorities for the National Quality Strategy. http://www.qualityforum.org/WorkArea/linkit.aspx?ItemID=68238 Accessed November20, 2012.
- 11.Massachusetts Coalition for the Prevention of Medical Errors and the Massachusetts Hospital Association. Reconciling medications safe practice recommendations. http://www.macoalition.org/Initiatives/RecMeds/SafePractices.pdf Accessed November20, 2012.
- 12.Giberson S, Yoder S, Lee MP.Improving Patient and Health System Outcomes through Advanced Pharmacy Practice. A Report to the U.S. Surgeon General. Rockville, MD: Office of the Chief Pharmacist, US Public Health Service; December2011. [Google Scholar]
- 13.Mueller SK, Sponsler KC, Kripalani S, et al. Hospitalbased medication reconciliation practices a systemic review. Arch Intern Med. 2012;172(14):1057–1069. [DOI] [PMC free article] [PubMed] [Google Scholar]
- 14.Koehler BE, Richter KM, Youngblood L, et al. Reduction of 30-day postdischarge hospital readmission or emergency department (ED) visit rates in high-risk elderly medical patients through delivery of a targeted care bundle. J Hosp Med. 2009;4:211–218. [DOI] [PubMed] [Google Scholar]
- 15.Gillespie U, Alassaad A, Henrohn D, et al. A comprehensive pharmacist intervention to reduce morbidity in patients 80 years or older. Arch Intern Med. 2009;169(9):894–900. [DOI] [PubMed] [Google Scholar]
- 16.Michels RD, Meisel SB.Program using pharmacy technicians to obtain medication histories. Am J Health Syst Pharm. 2003;60:1982–1986. [DOI] [PubMed] [Google Scholar]
- 17.Nester TM, Hale LS.Effectiveness of a pharmacistacquired medication history in promoting patient safety. Am J Health Syst Pharm. 2002;59:2221–2225. [DOI] [PubMed] [Google Scholar]
- 18.Schnipper JL, Kirwin JL, Cotugno MC, et al. Role of pharmacist counseling in preventing adverse drug events after hospitalization. Arch Intern Med. 2006;166:565–571. [DOI] [PubMed] [Google Scholar]
- 19.Kaboli PJ, Hoth AB, McClimon BJ, et al. Clinical pharmacists and inpatient medical care. Arch Intern Med. 2006;166:955–964. [DOI] [PubMed] [Google Scholar]
- 20.Boockvar KS, LaCorte HC, Giambanco V, et al. Medication reconciliation for reducing drug-discrepancy adverse events. Am J Geriatr Pharmacother. 2006;4:236–243. [DOI] [PubMed] [Google Scholar]
- 21.Gleason KM, Groszek JM, Sullivan C, et al. Reconciliation of discrepancies in medication histories and admission orders of newly hospitalized patients. Am J Health Syst Pharm. 2004;61:1689–1695. [DOI] [PubMed] [Google Scholar]
- 22.Hayes BD, Donovan JL, Smith BS, et al. Pharmacistcon ducted medication reconciliation in an emergency department. Am J Health Syst Pharm. 2007;64:1720–1723. [DOI] [PubMed] [Google Scholar]
- 23.Reeder TA, Mutnick A.Pharmacist- versus physicianobtained medication histories. Am J Health Syst Pharm. 2008;65:857–860. [DOI] [PubMed] [Google Scholar]
- 24.Lubowski TJ, Cronin LM, Pavelka RW, et al. Effectiveness of a medication reconciliation project conducted by PharmD students Am J Pharm Educ. 2007;71(5):94. [DOI] [PMC free article] [PubMed] [Google Scholar]
- 25.Mersfelder TL, Bickel RJ.Inpatient medication history verification by pharmacy students. Am J Health Syst Pharm. 2008;65:2273–2275. [DOI] [PubMed] [Google Scholar]
- 26.Bond CA, Raehl CL, Franke T.Clinical pharmacy services and hospital mortality rates. Pharmacotherapy. 1999;19(5):556–564. [DOI] [PubMed] [Google Scholar]
- 27.Bond CA, Raehl CL, Franke T.Clinical pharmacy services, hospital pharmacy staffing, and medication errors in United States hospitals. Pharmacotherapy. 2002;22(2):134–147. [DOI] [PubMed] [Google Scholar]
- 28.Aldridge VE, Park HK, Bounthavong M, et al. Implementing a comprehensive, 24-hour emergency department pharmacy program. Am J Health Syst Pharm. 2009;66:1943–1947. [DOI] [PubMed] [Google Scholar]
- 29.Gizzi LA, Slain D, Hare JT, et al. Assessment of a safety enhancement to the hospital medication reconciliation process for elderly patients. Am J Geriatr Pharmacother. 2010;8:127–135. [DOI] [PubMed] [Google Scholar]
- 30.Kwan Y, Fernandes OA, Nagge JJ, et al. Pharmacist medication assessments in a surgical preadmission clinic. Arch Intern Med. 2007;167:1034–1040. [DOI] [PubMed] [Google Scholar]
- 31.Lada P, Delgado G.Documentation of pharmacists’ interventions in an emergency department and associated cost avoidance. Am J Health Syst Pharm. 2007;64:63–68. [DOI] [PubMed] [Google Scholar]
- 32.Lee AJ, Boro MS, Knapp KK, et al. Clinical and economic outcomes of pharmacist recommendations in a Veterans Affairs medical center. Am J Health Syst Pharm. 2002;59:2070–2077. [DOI] [PubMed] [Google Scholar]
- 33.Murphy EM, Oxencis CJ, Klauck JA, et al. Medication reconciliation at an academic medical center: implementation of a comprehensive program from admission to discharge. Am J Health Syst Pharm. 2009;66:2126–2131. [DOI] [PubMed] [Google Scholar]
- 34.Rothschild JM, Churchill W, Erickson A, et al. Medication errors recovered by emergency department pharmacists. Ann Emerg Med. 2010;55:513–521. [DOI] [PubMed] [Google Scholar]
- 35.Ranelli PL, Svarstad BL, Boh L.Factors affecting outcomes of medication-history interviewing by pharmacy students. Am J Hosp Pharm. 1989;46:267–281. [PubMed] [Google Scholar]
- 36.Karnon J, Campbell F, Czoski-Murray C.Model-based cost-effectiveness analysis of interventions aimed at preventing medication error at hospital admission (medicines reconciliation). J Eval Clin Pract. 2009;15(2):299–306. [DOI] [PubMed] [Google Scholar]
- 37.Carter MK, Allin DM, Scott LA, et al. Pharmacist-acquired medication histories in a university hospital emergency department. Am J Health Syst Pharm. 2006;63:2500–2503. [DOI] [PubMed] [Google Scholar]
- 38.Myers CE.Opportunities and challenges related to pharmacy technicians in supporting optimal pharmacy practice models in health systems. Am J Health Syst Pharm. 2011;68:1128–1136. [DOI] [PubMed] [Google Scholar]
- 39.Johnston R, Saulnier L, Gould O.Best possible medication history in the emergency department: Comparing pharmacy technicians and pharmacists. Can J Hosp Pharm. 2010;63(5):359–365. [DOI] [PMC free article] [PubMed] [Google Scholar]
- 40.van den Bemt PM, van den Broek S, van Nunen AK, et al. Medication reconciliation performed by pharmacy technicians at the time of preoperative screening. Ann Pharmaco-ther. 2009;43(5):868–874. [DOI] [PubMed] [Google Scholar]
- 41.Kramer JS, Hopkins PJ, Rosendale JC, et al. Implementation of an electronic system for medication reconciliation. Am J Health Syst Pharm. 2007;64(4):404–422. [DOI] [PubMed] [Google Scholar]
- 42.Thompson CA.Legality of technicians’ involvement in medication reconciliation not clear. Am J Health Syst Pharm. 2009;66:433–434. [DOI] [PubMed] [Google Scholar]
- 43.Smith JD, Coleman E, Min S-J.A new tool for identifying discrepancies in postacute medications for community-dwelling older adults. Am J Geriatr Pharmacother. 2004;2(2):141–148. [DOI] [PubMed] [Google Scholar]
- 44.McEvoy GK, Snow EK, Miller J, et al. eds. AHFS Drug Information. Bethesda, MD: American Society of Health-System Pharmacists; 2010. [Google Scholar]
- 45.Williams E, Talley R.The use of failure mode effect and criticality analysis in a medication error subcommittee. Hosp Pharm. 1994;29:331–332, 334-337. [PubMed] [Google Scholar]
- 46.Schumock GT, Butler MG, Meek PD, et al. Evidence of the economic benefit of clinical pharmacy services: 1996-2000. Pharmacotherapy. 2003;23(1):113–132. [DOI] [PubMed] [Google Scholar]
- 47.Ophir E, Nass C, Wagner AD.Cognitive control in media multitaskers. Proc Natl Acad Sci. 2009;106(37):15583–15587. [DOI] [PMC free article] [PubMed] [Google Scholar]
- 48.Classen DC, Pestonik SL, Evans RS, et al. Adverse drug events in hospitalized patients. JAMA. 1997;277(4): 301–306. [PubMed] [Google Scholar]
Associated Data
This section collects any data citations, data availability statements, or supplementary materials included in this article.