Abstract
BACKGROUND/OBJECTIVES
Dietary guidelines for Korean children were released in 2009. The goal of the present study was to examine diet quality in terms of adherence to these dietary guidelines as well as explore the association between guideline adherence and risk of obesity in Korean children.
SUBJECTS/METHODS
Children aged 5-11 years (mean age = 8.9 years old, n = 191, 80.6% girls) were recruited from a university hospital in Seoul, Korea. Adherence to dietary guidelines for Korean children was calculated using the Likert scale (1-5), and children were then categorized into low, moderate, and high groups based on adherence scores. Obesity or being overweight was determined based on an age- and gender- specific percentile for body mass index (BMI) of the 2007 Korean National Growth Charts. Diet quality was evaluated from 3 days of dietary intake data.
RESULTS
Children in the high adherence group were characterized by significantly lower BMI percentiles and paternal BMIs as well as higher percentages of fathers with a high level of education and higher household incomes compared to those in the low or moderate group. Children in the high adherence group consumed significantly higher amounts of milk and dairy products, were less likely to consume lower than the EAR of phosphorus and iron, and had higher NARs for calcium, phosphorus, iron, zinc, and MAR than those in low groups. The ORs for obesity (BMI ≥ 95th percentile) or being overweight including obesity (BMI ≥ 85th percentile) were significantly lower in the high adherence group compared to the low adherence group (OR: 0.33, 95% CI = 0.13-0.82, P for trend = 0.019; OR: 0.26, 95% CI: 0.11-0.61 P for trend = 0.002).
CONCLUSIONS
Korean children who adhered to dietary guidelines displayed better diet quality and a reduced risk of obesity.
Keywords: Children, obesity, adherence, dietary guidelines, Korean
INTRODUCTION
The number of overweight and obese children has increased worldwide in recent years and is now a significant public health problem. According to the 2013 Korea School Health Examination, the prevalence of obesity in children and adolescents increased from 13.2% in 2009 to 15.3% in 2013 in South Korea [1]. Overweight and obese children may suffer psychological and social problems and are more likely to be diagnosed with metabolic diseases such as metabolic syndrome [2,3], diabetes [4,5] and chronic diseases in adulthood [6].
Even though there are many contributing factors associated with childhood obesity, the key modifiable factors are diet and physical activity. As with many other countries, Korea has experienced rapid economic development, Westernization of diets, and an increasingly sedentary lifestyle. Several studies on Korean children have demonstrated imbalanced nutrient intake [7,8] and poor dietary behaviors such as skipping breakfast [7,8,9,10], frequent unhealthy snacking [11], excessive dieting among girls [12,13], and reduced physical activity [7,14].
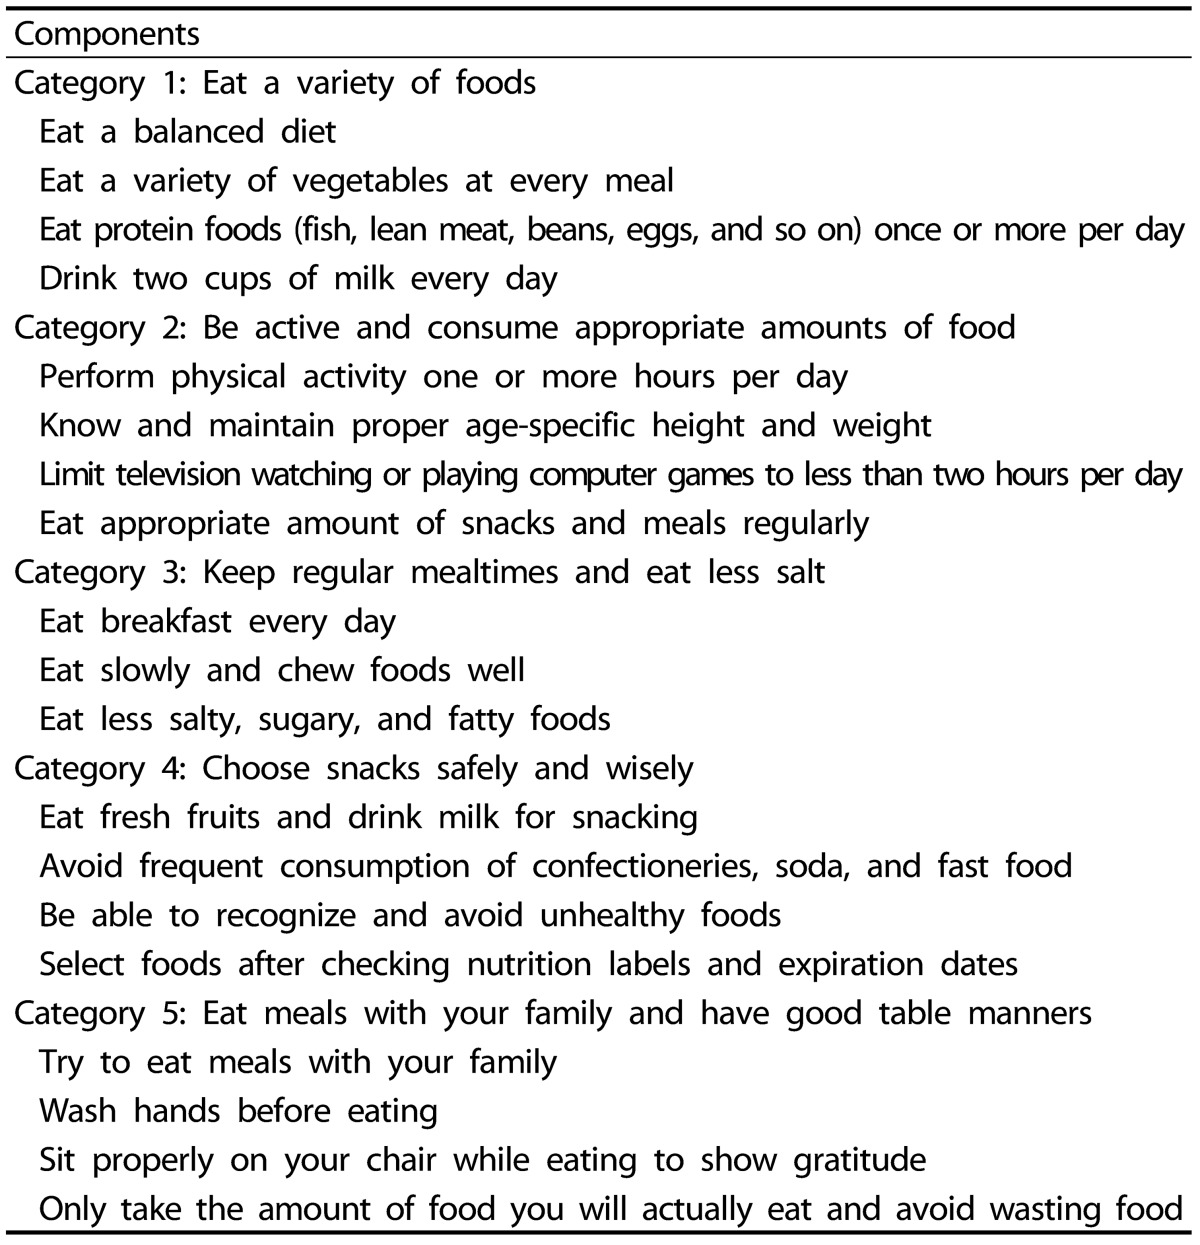
In 2009, the Ministry of Health and Welfare in Korea released dietary guidelines for Korean children aged 3-11 years, with a focus on improving overall diet quality and thus preventing childhood obesity. The guidelines were developed to satisfy the goals of the 2010 Health Plan of Korea using an evidence-based approach based on data from the Korea National Health and Nutrition Examination Survey (KNHANES). After professional review, dietary guidelines for Korean children were finalized into five categories and 19 specific statements with emphasis on adequate micronutrient intake, maintenance of proper body weight, reduction of sodium intake, and healthy dietary behaviors (Table 2) [15].
Table 2.
2009 dietary guidelines for Korean children
However, very few studies have evaluated the relationship between adhering to these dietary guidelines and obesity in Korean children. Thus, the aim of this study was to evaluate how adherence to dietary guidelines is related with diet quality, which includes food, energy, and nutrient intakes, as well as the relationship between guideline adherence and risk of obesity in Korean children.
SUBJECTS AND METHODS
Subjects
From March to September 2011, 256 children aged 5-11 years who visited a growth clinic at Inje University Sanggye Paik Hospital for general growth evaluation in Seoul, Korea were recruited. Of these 256 children, those with incomplete anthropometric measurements, questionnaires, or 3-day dietary intake data were excluded. After applying the exclusion criteria, 191 children were enrolled in the study. This study was performed according to the Declaration of Helsinki, and the Institutional Review Board at Inje University Sanggye Paik Hospital approved all study procedures. Before study participation, all children and their parents provided written informed consent.
Adherence to dietary guidelines
Adherence to dietary guidelines for Korean children was evaluated using a five-point Likert scale ranging from strongly disagree (1) to strongly agree (5). Children were grouped into tertiles according to adherence scores, but due to tie scores, subjects were classified as 45-64 (n = 60), 65-72 (n = 68), and 73-88 (n = 63). Children in the lowest tertile were considered to be in the low adherence group, those in the second tertile were moderate, and those in the highest tertile were in the high adherence group. A parent or caregiver assisted in responding to the interviewer's questions regarding dietary guidelines depending on the child's age.
Dietary assessment
Dietary intake was obtained from 1- and 2-day 24 hr recall food records, which included 2 weekdays and 1 weekend day. Food records included questions about food ingredients, brand name, portion size, as well as food and drink names. During the first visit, trained interviewers provided detailed verbal and written instructions to the parent or caregiver present with the child. Parents were instructed to record the child's food records with the child using food models and pictures in the provided journal. Moreover, 1-day 24 hr recall was carried out at the hospital on the first visit and recorded at home an additional 2 days out of the week. During the second visit, trained interviewers reviewed all food records of the children brought by the parents or caregivers through a face-to-face interview in order to obtain any missing information.
Dietary data were coded, and food and nutrient intakes were calculated using the CAN-Pro 3.0 (The Korean Nutrition Society, 2003). The 3-day dietary data were used to calculate average daily nutrient and energy intakes. Recipes in the Can-Pro 3.0 were revised based on children's 3-day dietary intake data. Foods were categorized as one of the following 17 groups: grains & grain products, potatoes, sugars & sweets, legumes, nuts & seeds, vegetables, mushrooms, fruits, meat & meat products, eggs, fish & shellfish, seaweed, milk & dairy products, beverages, seasonings, oil, and animal fat. Macronutrient intakes as percentages of total energy intake were also calculated. Age- and sex-specific Estimated Energy Requirement (EER) or Estimated Average Requirement (EAR) of dietary reference intakes for Koreans (KDRIs) was used to evaluate energy or nutrient intake in children [16]. To evaluate overall diet quality of children, the Mean Adequacy Ratio (MAR) was determined as a mean of the Nutrient Adequacy Ratios (NARs) for the 11 nutrients (protein, calcium, phosphorus, iron, zinc, vitamin A, thiamin, riboflavin, niacin, vitamin C, and folate). NARs for each nutrient were calculated as the ratio of personal daily nutrient intakes to Recommended Nutrient Intake (RNIs) for Koreans [16] and truncated at 1.
Anthropometric measurements and definition of childhood obesity
Height and weight were measured using a JENIX stadiometer, after which BMI (kg/m2) was calculated. Children wore light clothes and no shoes when measured. Children were classified as obese if they were at or above the 95th percentile for ageand gender-specific BMI, and children were considered overweight if 85th ≤ BMI percentile < 95th on the Korean National Growth Charts (2007) [17]. Children in the 5th-84th percentiles of BMI were classified as normal. There were no children below the 5th percentile of BMI.
Potential confounders
General characteristics, including age and sex, were collected. In addition, parents' self-reported heights and weights were considered to control for genetic factors. Parents' BMIs (kg/m2) were calculated, and parental obesity was defined as a BMI of 25 or over according to the Korean definition of adult obesity [18]. Due to the impact of socio-economic status on children's weight [8], relevant variables such as parental employment, parental education level, and monthly household income were collected. Parental employment was categorized as either "yes" or "no" (If parents' primary responsibility was care of the child and/or household, employment status was considered "no"). Parental education level was categorized as either (1) college level or higher; (2) secondary education or lower. Monthly household income was classified as: (1) < 3,000,000 KRW; (2) 3,000,000-5,999,999 KRW; or (3) ≥ 6,000,000 KRW), where 1,100 Korean won was considered equal to approximately one US dollar. To assess children's health behaviors as they relate to weight, physical activity levels were classified as low, moderate, and vigorous based on the International Physical Activity Questionnaire (IPAQ) [19].
Trained interviewers collected information, and all information in this study was provided by children with parent or caregiver assistance.
Statistical analysis
All statistical analyses were performed using SAS version 9.3 (SAS Institute Inc., Cary, NC, USA). Continuous variables were tested across tertiles of adherence scores using Generalized Linear Model (GLM) adjusted for potential confounding variables. Categorical variables were tested by χ2-test. Multivariate logistic regression analysis was performed to estimate odds ratios and 95% Confidence Intervals (CI) to assess risk of obesity or being overweight including obesity across tertiles of adherence scores after adjusting for age, sex, paternal BMI, paternal education level, and monthly household income. Statistical significance was defined as P < 0.05 (two sided).
RESULTS
General characteristics by level of adherence
As shown in Table 1, there was no difference in age or gender across the groups. Children in the high adherence group had a significantly lower body weight and BMI percentiles than those in the low or moderate adherence group (P = 0.007 and 0.003). Fathers with children in the high adherence group were more likely to have a lower BMI and higher level of education compared to fathers with children in the low or moderate group (P = 0.040 and 0.010). Children in the high adherence group also had a higher household income compared to those in the low or moderate group (P = 0.022). Children in the high adherence group showed significantly higher scores for all dietary guidelines compared to those in lower adherence groups (P for trend = 0.001; Table 3).
Table 1.
General characteristics of Korean children by adherence level to dietary guidelines
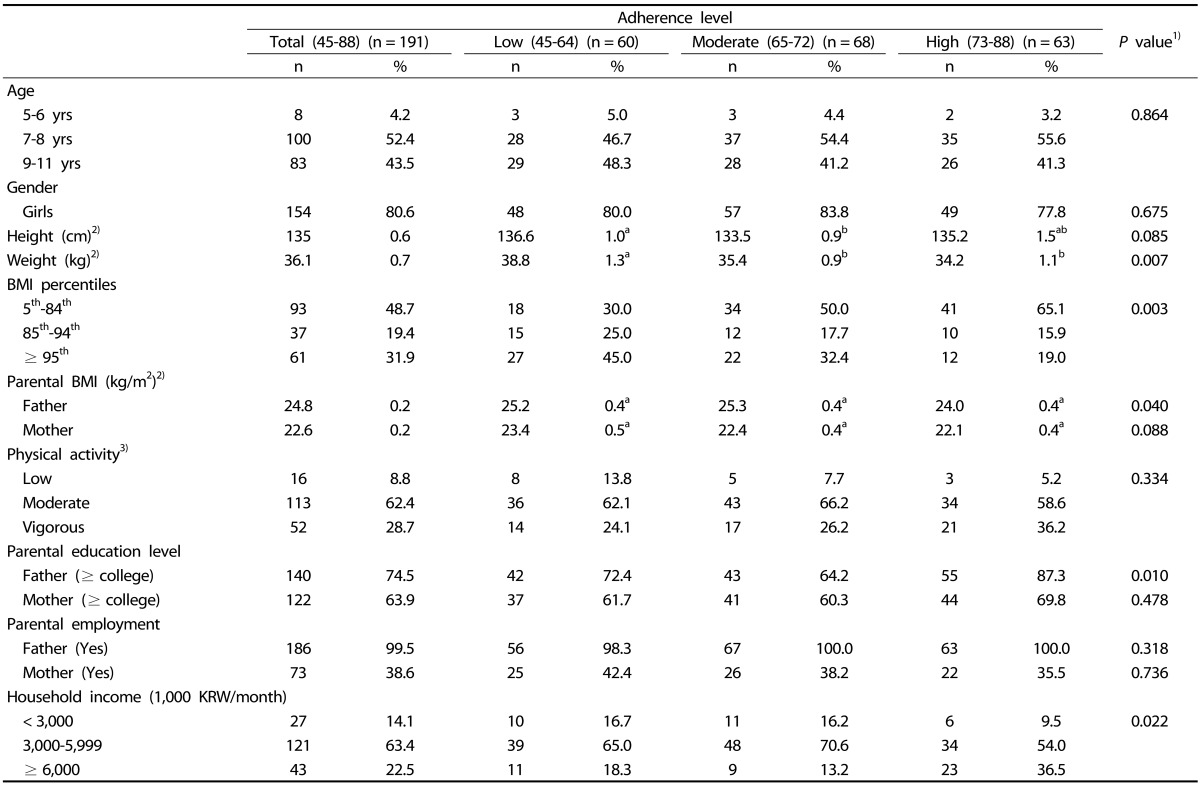
1)Continuous variables were tested using General Linear Model (GLM) adjusted for age and sex. Tukey's multiple comparison test was used as the post-hoc test; Categorical variables were tested by chi-square test.
2)Mean ± SE.
3)Low activity: < 600 (MET-min/week), Moderate: 600-2999 (MET-min/week), and Vigorous: 3,000 ≤ (MET-min/week): International Physical Activity Questionnaires (IPAQ) [19].
Table 3.
Comparison of adherence to each item by adherence level to dietary guidelines in Korean children
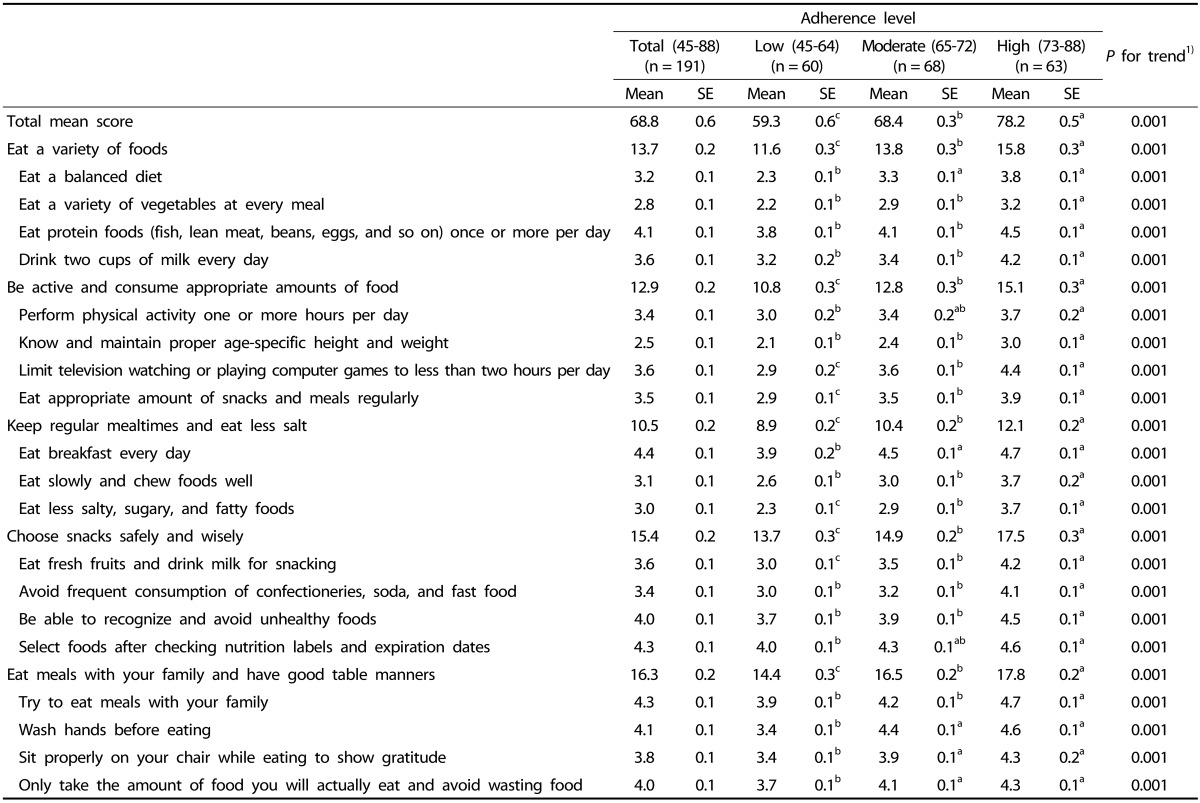
1)P for trend was tested using General Linear Model (GLM) adjusted for age, sex, children's BMI percentiles, paternal BMI, paternal education level, and household income.
Tukey's multiple comparison test was used as the post-hoc test.
Dietary intake by level of adherence
In terms of children's food consumption, children in the highest tertile of adherence scores consumed significantly more milk & dairy products and less seaweed than those in lower adherence groups (P for trend = 0.010, and 0.041; Table 4). Furthermore, a significantly lower percentage of children in the high adherence group consumed less than the EAR of phosphorus and iron compared to those in lower adherence groups (P for trend = 0.024 and 0.006; Table 5). Children in the high adherence group showed higher NARs for calcium, phosphorus, iron, zinc, and MAR compared to those in lower adherence groups (P for trend = 0.021, 0.010, 0.001, 0.021 and 0.008; Table 6).
Table 4.
Daily food, energy intakes, and percent of energy by adherence level to dietary guidelines in Korean children
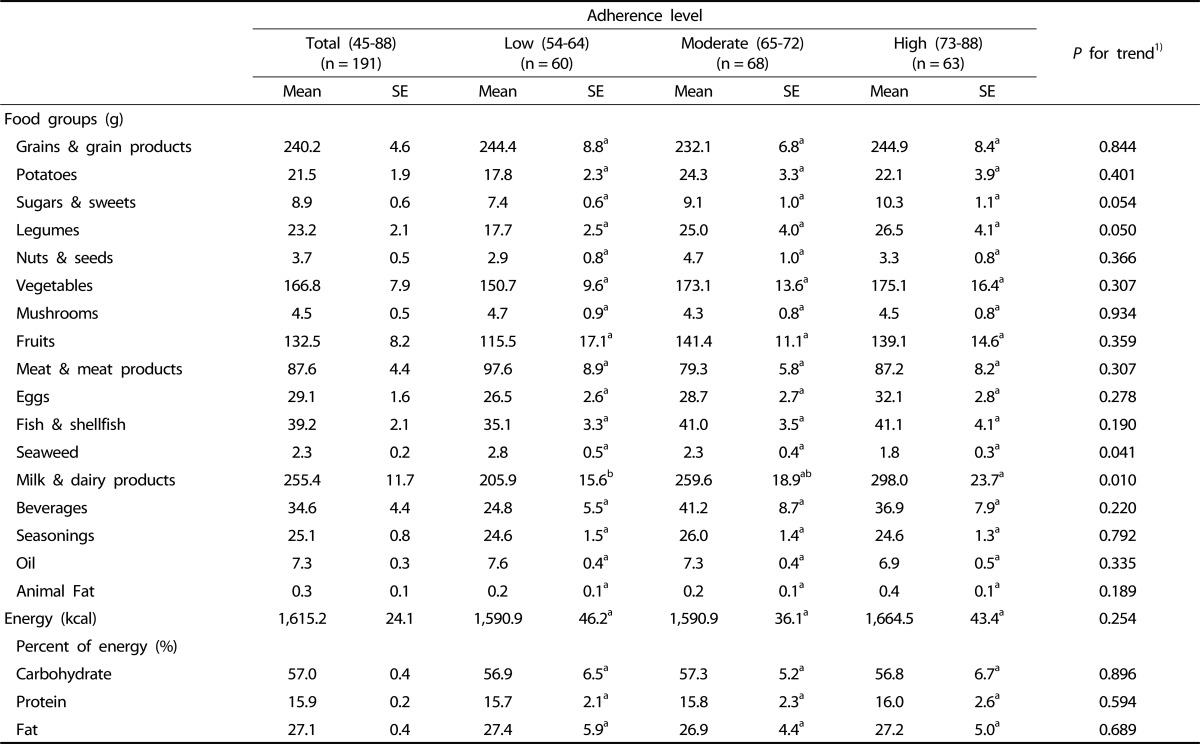
1)P for trend was tested using General Linear Model (GLM) adjusted for age, sex, children's BMI percentiles, paternal BMI, paternal education level, and household income.
Tukey's multiple comparison test was used as the post-hoc test.
Table 5.
Percentages of children that did not meet the Estimated Energy Requirement (EER) (< 75%) or the Estimated Average Requirement (EAR) by adherence level to dietary guidelines in Korean children
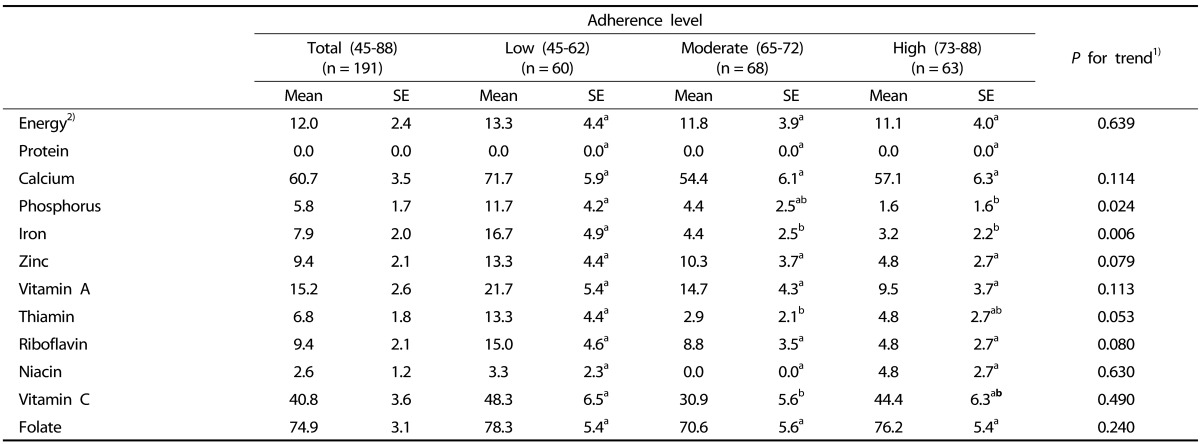
1)P for trend was tested using General Linear Model (GLM) adjusted for age, sex, children's BMI percentiles, paternal BMI, paternal education level, and household income.
Tukey's multiple comparison test was used as the post-hoc test.
2)The percentage of children consumed under 75% of the EER.
Table 6.
Nutrition Adequacy Ratios (NARs) and Mean Adequacy Ratio (MAR) by adherence level to dietary guidelines in Korean children
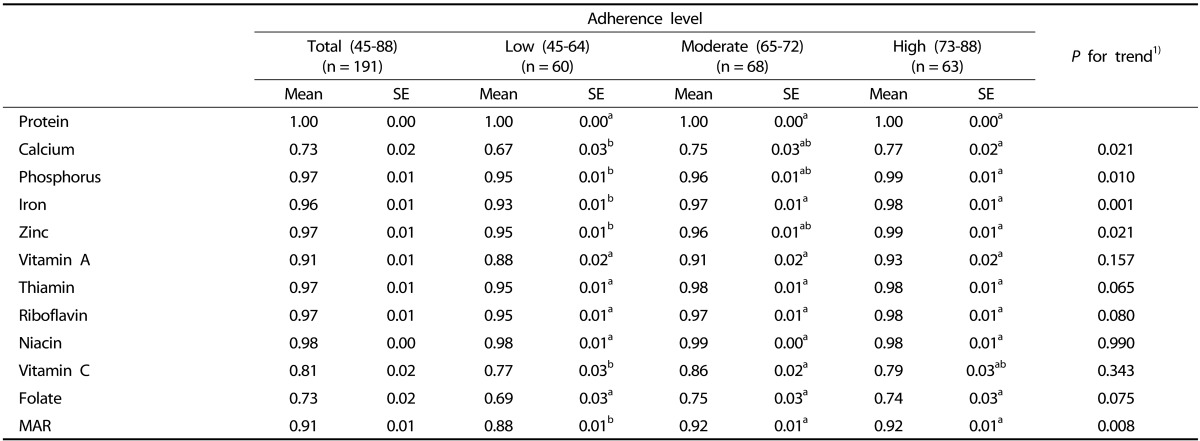
1)P for trend was tested using General Linear Model (GLM) adjusted for age, sex, children's BMI percentiles, paternal BMI, paternal education level, and household income.
Tukey's multiple comparison test was used as the post-hoc test.
Adherence to dietary guidelines and obesity
Risk of obesity (BMI ≥ 95th percentile) or being overweight including obesity (BMI ≥ 85th percentile) decreased significantly in the high adherence group compared to the low adherence group after adjusting for age, sex, paternal BMI, paternal education level, and monthly household income (OR: 0.33, 95% CI = 0.13-0.82, P for trend = 0.019; OR: 0.26, 95% CI: 0.11-0.61, P for trend = 0.002; Table 7).
Table 7.
Odds ratios (95% confidence intervals) for obesity (BMI ≥ 95th percentile) or being overweight including obesity (BMI ≥ 85th percentile) by adherence level in Korean children

1)P for trend was tested using General Linear Model (GLM) adjusted for age, sex, paternal BMI, paternal education level, and household income.
DISCUSSION
This study found that adherence to dietary guidelines for Korean children was positively related with reduced risk of obesity. Children in the high adherence group were associated with improved diet quality compared to those in lower adherence groups. Children in the high adherence group also showed higher consumption of milk and dairy products compared to children in lower adherence groups. Furthermore, a significantly lower percentage of children in the high adherence group consumed less than the EAR of phosphorus and iron, whereas they had higher NARs for calcium, phosphorus, iron, zinc, and MAR compared to those in lower adherence groups. In addition, high adherence was related with lower paternal BMI, higher paternal education level, and higher monthly household income.
Analysis of adherence to dietary guidelines revealed that children who closely adhered to dietary guidelines were more likely to have a normal body weight and BMI percentiles for their age and sex. These findings are in agreement with previous studies carried out in other countries demonstrating the effectiveness of dietary guidelines on weight management in children [20,21]. A prospective study on adolescent girls in the US showed that higher adherence to a Diet Approaches to Stop Hypertension (DASH) style diet was consistently associated with lower BMIs over a 10-year follow-up [20]. Another study on Canadian children reported that higher adherence to DASH diet was significantly associated with reduced measures of adiposity [21]. However, in the Australian study, dietary guideline index scores showed no or weak association with BMI and waist circumference Z-scores in children depending on their age [22].
Previous studies have recommended dietary guidelines for adequate consumption of nutrients, similar to those for Korean children [20,21,22]. In our study, children in all groups did not consume enough energy and nutrients, except for protein based on the EER or the EAR of KDRIs [16]. In terms of calcium, vitamin C, and folate, percentages of children that did not meet the EAR were relatively higher compared with other nutrients in Table 5 (60.7%, 40.8%, and 74.9%, respectively). According to the 2012 KNHANES, energy and nutrient intakes of children aged 6-11 years were lower than the EER or the EAR. Particularly, percentages of children that did not meet the EAR were 77.3% and 46.8% for calcium and vitamin C, respectively [8]. Furthermore, average daily energy intake of children in our study was lower than that of children aged 6-11 years in the 2012 KNHANES (1,615.2 kcal versus 1,806.8 kcal) [8].
Our study also found that children in the highest tertile of adherence scores consumed more milk and dairy products. Furthermore, a significantly lower percentage of children in the high adherence group consumed less than the EAR of phosphorus and iron compared to those in lower tertiles. In terms of NARs and MAR, children in the highest adherence group had significantly better NARs for calcium, phosphorous, iron, zinc, and MAR. This result was similar to a previous Korean study in which primary school children with high adherence to 2003 Korean dietary guidelines showed higher intake of several nutrients [23]. In a study on Korean adolescents, adherence to dietary guidelines was shown to be positively correlated with dietary fiber intake [24]. In addition, two studies on Australian [22] and Brazilian children [25] observed that compliance to dietary guidelines was associated with better food and nutrient consumption.
In terms of the association between dietary behaviors and weight status in Korean children, several studies reported that eating foods derived from animals [26], a high percentage of one's energy intake from fat, Western dietary patterns [27], frequent snacking [28], and parent-reported high appetites [29] are positively associated with being overweight or obese. These results also indicate that a balanced diet might help prevent excessive weight gain in children.
The present study found that adherence to dietary guidelines in children was associated with parental socio-economic variables. This finding was in agreement with a study that people at the highest household income level are more likely to exhibit healthy behaviors compared to those at lower income levels [8]. Other studies reported that family income or parental socio-economic status affects nutritional intake in children [30,31]. Based on the inverse relationship between paternal BMI and adherence to dietary guidelines, parental healthy behaviors likely determine those of children. Hence, family environment should be considered when trying to improve adherence to dietary guidelines.
However, this study has several limitations. First, external validity of the results could be limited since the subjects were recruited from a hospital. Secondly, adherence to dietary recommendations was measured using the Likert scale, which is limited in its ability to accurately classify adherence in all components. In addition, participants' adherence to dietary guidelines was based on how they conceived of dietary guidelines rather than what they actually did. This gap between perception and performance could be another limitation. Lastly, this study was a cross-sectional study, which means it is not possible to determine a causal relationship between adherence to dietary guidelines and risk of obesity in Korean children.
On the other hand, this study has several strengths. To the best of the author's knowledge, this is the first study to evaluate risk of obesity and diet quality by degree of adherence to dietary guidelines for Korean children, which were developed with a focus on creating a balanced diet and preventing pediatric obesity. Availability of detailed dietary information allows this study to predict typical dietary intake relatively accurately.
In conclusion, adherence to dietary guidelines may be related to improved diet quality, high levels of parental education, lower parental BMIs, and higher household income, resulting in prevention of childhood obesity. These findings support the broader use of dietary guidelines for weight management as a means of establishing healthy eating habits during childhood, which could help prevent metabolic disease later in life.
ACKNOWLEDGEMENT
The authors appreciate all interviewers and Inje University Sanggye Paik Hospital staffs who assisted in implementation of the survey. This research was supported by a grant from the Korea Food and Drug Administration (KFDA) (11162KFDA 701). The KFDA had no role in the design, analysis, or writing of this article. None of the authors have any conflicts of interest to declare. All authors reviewed and approved the final manuscript. The Institutional Review Board at Inje University Sanggye Paik Hospital approved this study.
References
- 1.Ministry of Education (KR) Results of the 2013 Korea school health examination (sample survey) [Internet] Sejong: Ministry of Education; 2014. [cited 2014 June 28]. Available from: http://www.moe.go.kr/web/45859/ko/board/view.do?bbsId=294&boardSeq=52706. [Google Scholar]
- 2.Weiss R, Dziura J, Burgert TS, Tamborlane WV, Taksali SE, Yeckel CW, Allen K, Lopes M, Savoye M, Morrison J, Sherwin RS, Caprio S. Obesity and the metabolic syndrome in children and adolescents. N Engl J Med. 2004;350:2362–2374. doi: 10.1056/NEJMoa031049. [DOI] [PubMed] [Google Scholar]
- 3.Valle M, Martos R, Gascón F, Cañete R, Zafra MA, Morales R. Low-grade systemic inflammation, hypoadiponectinemia and a high concentration of leptin are present in very young obese children, and correlate with metabolic syndrome. Diabetes Metab. 2005;31:55–62. doi: 10.1016/s1262-3636(07)70167-2. [DOI] [PubMed] [Google Scholar]
- 4.Wabitsch M, Hauner H, Hertrampf M, Muche R, Hay B, Mayer H, Kratzer W, Debatin KM, Heinze E. Type II diabetes mellitus and impaired glucose regulation in Caucasian children and adolescents with obesity living in Germany. Int J Obes Relat Metab Disord. 2004;28:307–313. doi: 10.1038/sj.ijo.0802555. [DOI] [PubMed] [Google Scholar]
- 5.Young TK, Dean HJ, Flett B, Wood-Steiman P. Childhood obesity in a population at high risk for type 2 diabetes. J Pediatr. 2000;136:365–369. doi: 10.1067/mpd.2000.103504. [DOI] [PubMed] [Google Scholar]
- 6.Whitaker RC, Wright JA, Pepe MS, Seidel KD, Dietz WH. Predicting obesity in young adulthood from childhood and parental obesity. N Engl J Med. 1997;337:869–873. doi: 10.1056/NEJM199709253371301. [DOI] [PubMed] [Google Scholar]
- 7.Ministry of Health and Welfare; Seoul National University R&DB Foundation. Children and youth life in Korea [Internet] Seoul: Ministry of Health and Welfare; 2009. [cited 2013 July 10]. Available from: http://www.bokjiro.go.kr/data/statusView.do?board_sid=297&data_sid=6015601. [Google Scholar]
- 8.Ministry of Health and Welfare, Korea Centers for Disease Control and Prevention. Korea Health Statistics 2012: Korea National Health and Nutrition Examination Survey (KNHANES V-3) [Internet] Cheongwon: Korea Centers for Disease Control and Prevention; 2013. [cited 2014 July 11]. Available from: http://knhanes.cdc.go.kr/knhanes/index.do. [Google Scholar]
- 9.Yeoh YJ, Yoon JH, Shim JE, Chung SJ. Factors associated with skipping breakfast in Korean children: analysis of data from the 2001 National Health and Nutrition Survey. Korean J Community Nutr. 2008;13:62–68. [Google Scholar]
- 10.Yeoh YJ, Yoon J, Shim JE. Relation of breakfast intake to diet quality in Korean school-aged children: analysis of the data from the 2001 National Health and Nutrition Survey. Korean J Community Nutr. 2009;14:1–11. [Google Scholar]
- 11.Kang SA, Lee JW, Kim KE, Koo JO, Park DY. A study of the frequency of food purchase for snacking and its related ecological factors on elementary school children. Korean J Community Nutr. 2004;9:453–463. [Google Scholar]
- 12.Park YH, Park ES. Body weight control, attitudes, lifestyle and dietary habits in elementary school students according to the obesity index. J East Asian Soc Diet Life. 2010;20:175–186. [Google Scholar]
- 13.Park JO, Jun SS, Kim YH, Ahn SH. Relationships between sex and perception of body shape, satisfaction with body weight, and experiences of weight control according to obesity level among elementary schoolers. J Korean Soc Matern Child Health. 2005;9:63–71. [Google Scholar]
- 14.Kim B. Factors associated with physical activity and sedentary behavior among elementary school students. J Korean Soc Health Educ Promot. 2010;27:33–47. [Google Scholar]
- 15.Joung H, Paik HY, Ahn HS, Kim CI, Chang N, Lee KH, Yoon JS, Kim DW. Revised dietary guidelines for Koreans, II. Infants, children, and adolescents. Nutr Diet. 2010;33:22–26. [Google Scholar]
- 16.The Korean Nutrition Society. Dietary Reference Intakes for Koreans 2010. Seoul: The Korean Nutrition Society; 2010. [Google Scholar]
- 17.Korea Centers for Disease Control and Prevention; The Korean Pediatric Society; The Committee for the Growth Standard for Korean Children and Adolescents. 2007 Korean Children and Adolescents Growth Standard (Commentary for the development of 2007 growth chart) [Internet] Seoul: Korea Centers for Disease Control and Prevention; 2007. [cited 2013 July 10]. Available from: http://www.cdc.go.kr/CDC/info/CdcKrInfo0201.jsp?menuIds=HOME001-MNU1155-MNU1083-MNU1375-MNU0025&cid=1235. [Google Scholar]
- 18.Korean Endocrine Society; Korean Society for the Study of Obesity. Management of obesity, 2010 recommendation. Endocrinol Metab. 2010;25:301–304. [Google Scholar]
- 19.IPAQ research committee. Guidelines for data processing and analysis of the international physical activity questionnaire (IPAQ) [Internet] [place unknown]: IPAQ research committee; 2005. [cited 2014 July 19]. Available from: http://www.ipaq.ki.se/scoring.pdf. [Google Scholar]
- 20.Berz JP, Singer MR, Guo X, Daniels SR, Moore LL. Use of a DASH food group score to predict excess weight gain in adolescent girls in the National Growth and Health Study. Arch Pediatr Adolesc Med. 2011;165:540–546. doi: 10.1001/archpediatrics.2011.71. [DOI] [PubMed] [Google Scholar]
- 21.Hajna S, Liu J, LeBlanc PJ, Faught BE, Merchant AT, Cairney J, Hay J. Association between body composition and conformity to the recommendations of Canada's Food Guide and the Dietary Approaches to Stop Hypertension (DASH) diet in peri-adolescence. Public Health Nutr. 2012;15:1890–1896. doi: 10.1017/S1368980012001024. [DOI] [PubMed] [Google Scholar]
- 22.Golley RK, Hendrie GA, McNaughton SA. Scores on the dietary guideline index for children and adolescents are associated with nutrient intake and socio-economic position but not adiposity. J Nutr. 2011;141:1340–1347. doi: 10.3945/jn.110.136879. [DOI] [PubMed] [Google Scholar]
- 23.Kim BH, Sung MY, Lee Y. Comparison of the nutrient intakes by the score of Dietary Action Guides for Korean children among the elementary school students in Gwangju city. Korean J Community Nutr. 2011;16:411–425. [Google Scholar]
- 24.Park S, Na W, Kim M, Kim E, Sohn C. Correlation between intake of dietary fiber and adherence to the Korean National Dietary Guidelines in adolescents from Jeonju. Prev Nutr Food Sci. 2012;17:254–260. doi: 10.3746/pnf.2012.17.4.254. [DOI] [PMC free article] [PubMed] [Google Scholar]
- 25.Rauber F, da Costa Louzada ML, Vitolo MR. Healthy eating index measures diet quality of Brazilian children of low socioeconomic status. J Am Coll Nutr. 2014;33:26–31. doi: 10.1080/07315724.2014.869979. [DOI] [PubMed] [Google Scholar]
- 26.Shin KO, Oh SY, Park HS. Empirically derived major dietary patterns and their associations with overweight in Korean preschool children. Br J Nutr. 2007;98:416–421. doi: 10.1017/S0007114507720226. [DOI] [PubMed] [Google Scholar]
- 27.Song Y, Park MJ, Paik HY, Joung H. Secular trends in dietary patterns and obesity-related risk factors in Korean adolescents aged 10-19 years. Int J Obes (Lond) 2010;34:48–56. doi: 10.1038/ijo.2009.203. [DOI] [PubMed] [Google Scholar]
- 28.Lee HH, Park HA, Kang JH, Cho YG, Park JK, Lee R, Yoon JY, Kim OH. Factors related to body mass index and body mass index change in Korean children: preliminary results from the obesity and metabolic disorders cohort in childhood. Korean J Fam Med. 2012;33:134–143. doi: 10.4082/kjfm.2012.33.3.134. [DOI] [PMC free article] [PubMed] [Google Scholar]
- 29.Lee K, Song YM. Parent-reported appetite of a child and the child's weight status over a 2-year period in Korean children. J Am Diet Assoc. 2007;107:678–680. doi: 10.1016/j.jada.2007.01.012. [DOI] [PubMed] [Google Scholar]
- 30.Xie B, Gilliland FD, Li YF, Rockett HR. Effects of ethnicity, family income, and education on dietary intake among adolescents. Prev Med. 2003;36:30–40. doi: 10.1006/pmed.2002.1131. [DOI] [PubMed] [Google Scholar]
- 31.Junior EV, Cesar CL, Fisberg RM, Marchioni DM. Socio-economic variables influence the prevalence of inadequate nutrient intake in Brazilian adolescents: results from a population-based survey. Public Health Nutr. 2011;14:1533–1538. doi: 10.1017/S1368980011000760. [DOI] [PubMed] [Google Scholar]


