

Abstract
Recent electrophysiological and neuroimaging studies provide converging evidence that attending to sounds increases the response selectivity of neuronal ensembles even at the first cortical stage of auditory stimulus processing in primary auditory cortex (A1). This is achieved by enhancement of responses in the regions that process attended frequency content, and by suppression of responses in the surrounding regions. The goals of our study were to define the extent to which A1 neuronal ensembles are involved in this process, determine its effect on the frequency tuning of A1 neuronal ensembles, and examine the involvement of the different cortical layers. To accomplish these, we analyzed laminar profiles of synaptic activity and action potentials recorded in A1 of macaques performing a rhythmic intermodal selective attention task. We found that the frequency tuning of neuronal ensembles was sharpened due to both increased gain at the preferentially processed or best frequency and increased response suppression at all other frequencies when auditory stimuli were attended. Our results suggest that these effects are due to a frequency-specific counterphase entrainment of ongoing delta oscillations, which predictively orchestrates opposite sign excitability changes across all of A1. This results in a net suppressive effect due to the large proportion of neuronal ensembles that do not specifically process the attended frequency content. Furthermore, analysis of laminar activation profiles revealed that although attention-related suppressive effects predominate the responses of supragranular neuronal ensembles, response enhancement is dominant in the granular and infragranular layers, providing evidence for layer-specific cortical operations in attentive stimulus processing.
Keywords: auditory, current source density, entrainment, macaque, oscillations, selective attention
Introduction
In the auditory modality it has been shown that focusing attention to a specific stimulus feature (e.g., pitch) augments neuronal selectivity for that feature (Fritz et al., 2007b; Okamoto et al., 2007; Neelon et al., 2011). In support of this notion, single-unit recordings in behaving animals have shown task-related bandwidth modulations of frequency tuning or even “retuning” of receptive fields of A1 neurons to behaviorally relevant frequencies (Ohl and Scheich, 1996; Fritz et al., 2007a; Atiani et al., 2009; Galindo-Leon et al., 2009).
The sharpening of frequency tuning by “sideband” inhibition in A1 has long been observed, even in anesthetized or nonbehaving animals (Shamma and Symmes, 1985; Suga, 1995; Sutter et al., 1999; Wang et al., 2000; Foeller et al., 2001; Sadagopan and Wang, 2010). It has been theorized that attentive listening may change the balance of excitatory and inhibitory inputs, thereby augmenting sideband inhibition, while also increasing response gain (Hromadka and Zador, 2007). A study of population level sideband inhibition in passively behaving monkeys revealed a potential mechanism: tones that resulted in the largest stimulus related inhibition reset ongoing neuronal oscillations to their low excitability phases (O'Connell et al., 2011). A recent study by Lakatos et al. (2013a) did provide evidence that this process serves as a dynamic mechanism during attention that augments sideband inhibition in primary auditory cortex (A1). The current study had two main goals: (1) to establish whether the attention related modulation of neuronal ensemble excitability is confined to regions receiving direct lemniscal thalamocortical input, or is it more widespread across A1. (2) To determine whether the effects of attention are layer-specific.
We presented streams of different frequency pure tones covering the monkey's entire hearing range (Pfingst et al., 1978), as they performed an intermodal selective attention task. Our reasoning was that the range of pure tones with attention related amplitude modification indirectly reveals the degree to which neuronal ensembles across A1 are involved in the modulation of sensory information, because frequency is projected onto cortical space (tonotopy) in the auditory system (Kaas and Hackett, 2000). To discern layer-specific effects of attention, we analyzed auditory stimulus related responses and oscillatory activity in the different cortical layers separately.
Our results indicate that surprisingly, despite A1's strict frequency specificity, neuronal ensembles along the entire tonotopic axis of A1 act in harmony to predictively modulate inputs related to attended pure tones: when rhythmic tone streams are attended, subthreshold neuronal oscillations are aligned to their temporal structure and alter responses, resulting in an overall sharpening of frequency tuning. Our results also reveal that both supragranular and infragranular layer oscillatory activity becomes synchronized to attended streams. Finally, we demonstrate that stimulus related activity in distinct laminar locations with largely differing connectivity patterns (feedforward vs feedback), is dissimilarly modulated by auditory attention. Based on these findings we put forth the hypothesis that although the main role of the supragranular neuronal ensemble sheet acting in unison across A1 is the filtering of relevant sensory information that is transmitted for further analysis to higher order regions, the chief role of the infragranular layers is the boosting of feedback from neuronal ensembles processing relevant information.
Materials and Methods
Subjects.
In the present study, we analyzed the electrophysiological data recorded during 39 penetrations of area A1 of the auditory cortex of two female rhesus macaques (19 and 20 penetrations) weighing 5–7 kg, who had been prepared surgically for chronic awake electrophysiological recordings. Before surgery, each animal was adapted to a custom-fitted primate chair and to the recording chamber. All procedures were approved in advance by the Animal Care and Use Committee of the Nathan Kline Institute.
Surgery.
Preparation of subjects for chronic awake intracortical recording was performed using aseptic techniques, under general anesthesia, as described previously (Schroeder et al., 1998). The tissue overlying the calvarium was resected and appropriate portions of the cranium were removed. The neocortex and overlying dura were left intact. To provide access to the brain and to promote an orderly pattern of sampling across the surface of the auditory areas, plastic recording chambers (Crist Instrument) were positioned normal to the cortical surface of the superior temporal plane for orthogonal penetration of area A1, as determined by preimplant MRI. Together with socketed Plexiglas bars (to permit painless head restraint), they were secured to the skull with orthopedic screws and embedded in dental acrylic. A recovery time of 6 weeks was allowed before we began behavioral training and data collection.
Electrophysiology.
During the experiments, animals sat in a primate chair in a dark, isolated, electrically shielded, sound-attenuated chamber with head fixed in position, and were monitored with infrared cameras. Neuroelectric activity was obtained using linear array multicontact electrodes (23 contacts, 100 μm intercontact spacing, Plexon). The multielectrodes were inserted acutely through guide tube grid inserts, lowered through the dura into the brain, and positioned such that the electrode channels would span all layers of the cortex (Fig. 1A), which was determined by inspecting the laminar response profile to binaural broadband noise bursts. Neuroelectric signals were impedance matched with a preamplifier (10× gain, bandpass dc 10 kHz) situated on the electrode, and after further amplification (500×) they were recorded continuously with a 0.01–8000 Hz bandpass digitized with a sampling rate of 20 kHz and precision of 16 bits using custom-made software in Labview. The signal was split into the field potential (0.1–300 Hz) and multiunit activity (MUA; 300–5000 Hz) range by zero phase shift digital filtering. MUA data were also rectified to improve the estimation of firing of the local neuronal ensemble (Legatt et al., 1980). One-dimensional current source density (CSD) profiles were calculated from the local field potential profiles using a three-point formula for the calculation of the second spatial derivative of voltage (Freeman and Nicholson, 1975). The advantage of CSD profiles is that they are not affected by volume conduction like the local field potentials, and they also provide a more direct index of the location, direction, and density of the net transmembrane current flow (Mitzdorf, 1985; Schroeder et al., 1998). At the beginning of each experimental session, after refining the electrode position in the neocortex, we established the best frequency (BF) of the recording site using a “suprathreshold” method (Steinschneider et al., 1995; Lakatos et al., 2005a). The method entails presentation of a stimulus train consisting of 100 random order occurrences of a broadband noise burst and pure tone stimuli with frequencies ranging from 353.5 Hz to 32 kHz in half-octave steps [duration: 100 ms, r/f time: 5 ms; stimulus onset asynchrony (SOA) = 624.5]. Auditory stimuli were produced using Tucker Davis Technology's System III coupled with MF-1 free-field speakers which were calibrated as described in the next section.
Figure 1.

Representative laminar CSD and MUA profiles in response to AA and IA BF and off-BF streams in A1. A, Schematic of a linear array multielectrode positioned in primary auditory cortex (A1). Cortical layers are indicated by numbers. To the right are CSD and concomitant MUA response profiles related to the AA condition BF (8 kHz) and an off-BF (2 kHz) tone stream. B, The CSD and MUA profiles evoked by the same tone streams as in A, but while they were in the IA condition. Note that there is a response enhancement for the BF tone in the AA versus IA condition, whereas in the case of the off-BF tone there appears to be a response-suppression. C, The frequency tuning curves created using cross-laminar (averaged across all layers) MUA amplitudes in response to 14 different frequency tones presented in blocks during both attentional conditions (AA, red; IA, blue) for this particular A1 site. Arrows mark the frequencies of BF and off-BF tone streams.
Behavioral task and stimuli.
We trained two monkeys to perform an intermodal selective attention oddball task, which required them to attend to and discriminate stimuli in one modality, while ignoring stimuli in the other modality. Auditory and visual stimulus streams were presented simultaneously with differing SOAs so that visual and auditory stimuli did not have a constant temporal relationship. This was meant to eliminate any multisensory “binding” effects, and facilitate the segregation of the two different modality streams. Monkeys were either cued to detect frequency deviants occurring at random time intervals in the auditory stream, or a color change in rhythmically flashing LEDs or a more intense flash in the visual stream. The auditory stream consisted of pure tone beeps at 40 dB SPL (25 ms duration, 5 ms rise/fall time) with a constant SOA of 624.5 ms (1.6 Hz), whereas the visual stream had a 1.8 Hz repetition rate. Both of these rates are close to the frequency of dominant ongoing delta frequency band oscillatory activity in A1 (Lakatos et al., 2005b). The frequency of the auditory standards was parametrically varied across blocks in half-octave steps between 0.3–32 kHz, resulting in 14 different frequency tone streams. Frequency deviants (∼4 semitones different from the standard) occurred in the stream of standard tones every 3–9 s randomly. The pure tones used in the experiments were calibrated using an ACO Pacific PS 9200 microphone. For calibration purposes, the tones were recorded with a 100 kHz sampling rate using a National Instruments USB-6259 data acquisition system.
To get the monkeys to attend to the rhythmic streams of tones, in the beginning of training, 0.25–1 ml of juice reward was delivered to them simultaneously with each deviant through a spout. The spout was positioned such that the monkeys had to stick out their tongue to get the juice. Licking was monitored using a simple contact detector circuit (Slotnick, 2009), the output of which was continuously recorded with Labview, together with the timing of standard and deviant tones for off-line analyses. In this phase of training, the frequency difference between the standard and deviant tones was approximately 1 octave. After two sessions, the juice reward was omitted on every 10th deviant. If the monkeys licked on these deviants without a paired juice reward, signaling that they were attending to the tones and actively discriminating the deviants, we omitted the reward on 20% of the deviants, and also gradually lowered the frequency difference to two to four semitones. After 10–20 training sessions on average, the monkey's performance became relatively stable: they were reliably licking on juiceless deviants before the next stimulus occurred in the train. At this time, we introduced the visual stream first in isolation, and after two to three sessions, when the monkeys reliably responded to visual deviants we started to overlap streams, and used cueing streams (isolated visual or auditory streams) to indicate the to be attended modality. One of the subjects performed this task 76% correct, whereas the other monkey only 64% correct, as determined by licking on juiceless deviants, which remained stable throughout the course of all experiments. There was no difference between behavioral performances in the auditory versus the visual task. We only analyzed standards that preceded deviants (with or without juice) on which the subjects licked. When subjects became satiated, they stopped licking even when juice was delivered; this usually occurred after >500 deviants.
Data analysis.
Data were analyzed offline using native and custom-written functions in MATLAB (MathWorks). After selective averaging of the CSD and MUA responses to the tones presented in the suprathreshold tonotopy paradigm, recording sites were functionally defined as belonging to AI or belt auditory cortices based on the sharpness of frequency tuning, the inspection of the tonotopic progression across adjacent sites, relative sensitivity to pure tones versus broadband noise of equivalent intensity, and measurement of granular MUA response onset latencies to BF tones (Merzenich and Brugge, 1973; Rauschecker et al., 1997; Lakatos et al., 2005a). Recording sites whose BF progressed sequentially as expected, i.e., from low to high-frequency in an anterolateral to posteromedial direction combined with expected BF tone related granular MUA response onset latency were assigned to A1. Granular layer MUA response onset latency was defined as the earliest significant (>2 SD units) divergence of the averaged waveforms from their baseline (−50 to 0 ms), that was maintained for at least 5 ms. We found that our BF related MUA onset latencies were on par with previous reports, and similarly decreased as BF increased (Mendelson et al., 1997; Lakatos et al., 2005a; O'Connell et al., 2011). The median onset value for all BFs (7.75 ms) was not significantly different from that previously reported for BF-related MUA onset latencies in A1 (9 ms; Wilcoxon signed rank test, p = 0.016; Lakatos et al., 2005a). The difference in observed median values could be because our sample consists of more high-frequency A1 sites than those used in previous reports. In the present study, only recordings obtained from area A1 were analyzed.
All analyses were conducted on the neural responses to standard stimuli and the responses to the first three standards after each deviant were excluded to avoid reward related artifacts (licking) and due to the fact that deviant stimuli could never occur in these stimulus positions. Utilizing the BF-tone related laminar CSD profile, the functional identification of the supragranular, granular, and infragranular cortical layers in area A1 (Fig. 1A) is straightforward based on our earlier studies (Schroeder et al., 1998, 2001; Lakatos et al., 2005b, 2007). For the analysis of laminar response amplitude effects, we averaged MUA activity across electrodes spanning the supragranular, granular and infragranular layers (on average 8.26, 3.72, and 5.2 electrodes, respectively).
Because one of the major goals of our present study was to examine the expanse of previously reported oscillatory entrainment (Lakatos et al., 2013a) along the entire tonotopic axis of A1, we decided to use the same stimulation rate that corresponds to the frequency of delta band oscillatory activity. As entrainment results in a matching of the frequency of rhythmic neuronal activity to the stimulation rate, we primarily focused our analysis on oscillatory activity whose frequency matched the rate of auditory stimulation (i.e., 1.6 Hz). To be able to determine the phase relationship of delta oscillatory activity (Lakatos et al., 2005b, 2007, 2008, 2013a; O'Connell et al., 2011) to the timing of attended and ignored stimuli in stimulus streams, instantaneous phase in single trials was extracted by wavelet decomposition (Morlet wavelet) on 135 scales from 0.5 to 3.2 Hz. Independent of their frequency composition, cyclically occurring events like the suprathreshold, “evoked type” response waveforms can artificially bias phase measures at the frequency that corresponds to the stimulus presentation rate (Lakatos et al., 2013a, their Fig. S3 shows examples and further explanation). To minimize this bias, a linear interpolation was applied to the single trials before wavelet analysis in the 5–150 ms time interval which in the case of most BF tones contained evoked-type activation (Lakatos et al., 2013a). To characterize delta phase distribution across trials, the mean angle and the resultant length of the mean vector was extracted at 1.6 Hz (stimulation rate) at stimulus onset from the wavelet transformed data. To calculate the mean resultant length, also called intertrial coherence (ITC), for a specific frequency and time point, the magnitude of each single-trial vector was set to 1 (normalized), and then averaged across trials giving a single resultant or mean vector (Bruns, 2004, their Eq. 8). The length of the resultant vector can range from 0 to 1, and is also termed ITC, because it represents how similar phases across trials are. Higher values indicate that the observations (oscillatory phase at a given time-point across trials) are clustered more closely around the angle of the resultant vector (i.e., phase distribution is biased) than distributions with lower values (i.e., phase distribution is random). Significant deviation from uniform (random) phase distribution was tested with Rayleigh's uniformity test. The α value was set at 0.01 for all statistical tests. The degree-of-phase opposition (see Fig. 3C) in each experiment was determined by subtracting the mean delta phase related to the attended BF stream from the mean phase measured at stimulus onset for each of the attended off-BF tone streams. All 13 tone streams whose frequency did not match the BF of the recording site were classified as off-BF streams.
Figure 3.

Delta entrainment to different frequency tone streams. A, Overlaid frequency tuning curves created from cross-laminar MUA responses to AA and IA stimulus streams from a representative experiment where the BF of the site was 4 kHz. Inset, Layer-specific MUA tuning curves in AA versus IA conditions from same experiment. Asterisks denote significant differences (Wilcoxon rank sum, p < 0.01) between attention conditions: red asterisks indicate that responses to a given frequency tone were significantly larger, whereas blue asterisks denote that responses were significantly smaller when the tone stream was attended. Note the gradual transition from more suppressive to more enhancing effects of attention from supragranular to infragranular layers. Bottom, Red histograms show the supragranular delta frequency (1.6 Hz, which matches the repetition rate of tones) CSD phase distribution across single trials at time of stimulus onset, related to a subset of AA tone streams (shown by arrows), black vertical lines denote the mean phase. Blue histograms show the delta-phase distribution across single trials related to the same tone streams but in the IA condition. B, Red trace shows supragranular delta ITC values for each AA tone stream in the same experiment. The purple dotted line denotes the average value above which ITC can be considered significantly nonrandom. All 14 frequency-tone streams resulted in significantly biased delta phase distribution at this specific A1 site (100% significant delta ITC). C, Graph shows the phase opposition index for the same experiment. Phase opposition was defined as a mean phase that differs at least a half-π radians from the BF-tone related delta phase (shown by green oval), and thus falls within the opposite half of the delta oscillatory cycle. Mean delta phases associated with all off-BF tone streams are shown by red ovals. Only one other tone stream resulted in a mean delta phase that fell within a half-π (shown by the dotted blue lines) of the BF stream-related phase. In this specific case the phase opposition index was 86%.
Phase distributions and mean phases were evaluated both in the supragranular and infragranular layers at the laminar locations determined by maximal delta frequency band neuronal activity and a sink in response to BF tones. The reason for this is that based on previous studies (Lakatos et al., 2005b, 2013a), CSD at these locations represent the main net supragranular and infragranular active currents in neuronal ensembles. The phase of stimulus related delta oscillatory activity in the granular layer could not be analyzed due to the small amplitude of ongoing delta oscillations and the large amplitude of evoked type activity in this layer that resulted in spurious phase distributions even after applying the linear interpolation described above.
Previous studies (Fries et al., 2001, Lakatos et al., 2008) indicate that the amplitude of gamma frequency band prestimulus neuronal activity is a good indicator for the net excitability of a given neuronal ensemble. For the purpose of determining whether and how attention affected the amplitude of gamma in our experiments, gamma amplitudes (Fig. 6) were extracted from CSD and local field potential (LFP) signals by first bandpass filtering in the 25–55 Hz band, and then calculating the analytic amplitude of the signal using the Hilbert transform in each single trial before averaging them.
Figure 6.
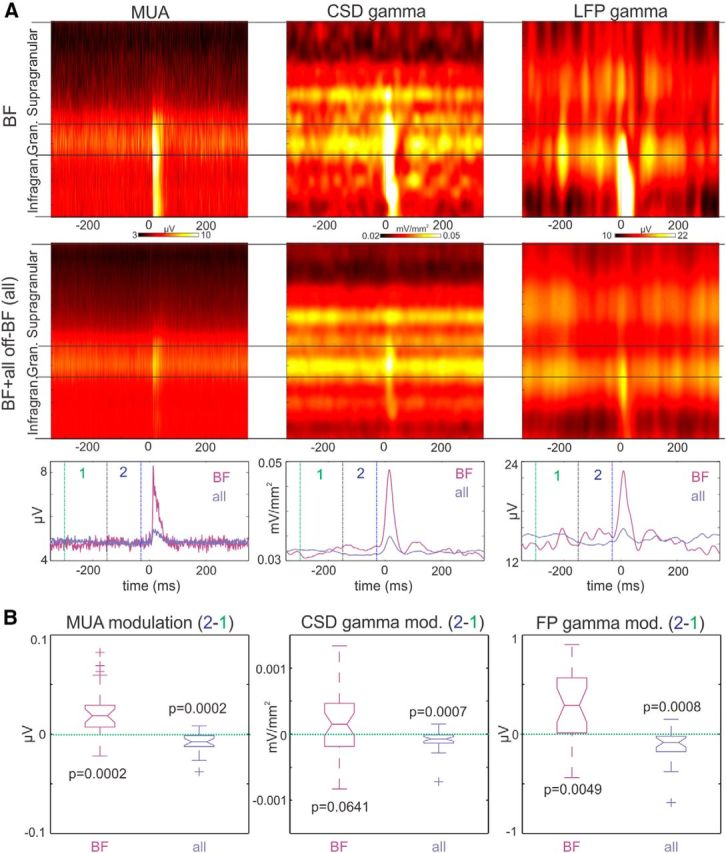
Modulation of prestimulus excitability. A, The first column of color maps shows representative laminar MUA profiles related to the AA BF tone stream (top) and related to all AA tone streams (averaged), including the BF (bottom). Color maps in the middle and to the right show gamma band activity (25–55 Hz) amplitude profiles extracted from CSD and LFP, respectively. Traces on the bottom display the time course of MUA and gamma range activity averaged across all layers. Dotted vertical lines denote the immediate prestimulus (2) and interstimulus (1) timeframes used to calculate the modulation indices in B. B, Boxplots display the pooled difference of immediate prestimulus (−150—30 ms, marked by 2) and interstimulus (−300 to −150 ms, marked by 1), MUA and gamma band activity. Note that in the case of BF stream related prestimulus activity, MUA and gamma are up-modulated toward the timing of attended stimuli, in the net activity related to all streams these measures indexing the excitability of the local neuronal ensemble are down-modulated. Inset p values indicate the probability that the pooled measures are not significantly different from zero (Wilcoxon signed rank).
Results
We recorded the neuroelectric activity of 39 primary auditory cortex sites which were distributed reasonably evenly along the tonotopic axis of A1, with BFs ranging from 0.5 kHz to 32 kHz. Fifteen (38.5%) of the sites had a BF < = 8 kHz, whereas 24 (61.5%) of the sites had a BF > 8 kHz. During recordings, the two subjects had to perform a selective intermodal attention task: in separate blocks, the monkeys either had to attend to a rhythmic stream of auditory tone beeps and detect deviant tones that differed in their frequency while ignoring visual stimuli or they had to attend to rhythmically presented LED light flashes and detect deviant flashes that differed from standards either in color or intensity while ignoring stimuli in the auditory modality.
Sharpening of frequency tuning by attention
To facilitate the comparison of attended versus ignored response amplitudes, we created frequency tuning curves by averaging event related cross-laminar (averaged across all layers) MUA amplitudes in the 15–40 ms poststimulus time interval (O'Connell et al., 2011), in response to the 14 different frequency tone streams presented when the monkeys were attending to versus ignoring auditory streams. Figure 1 shows a representative example from a recording site with a BF of 8 kHz. The color plots show laminar profiles of CSD and MUA responses to attended (Fig. 1A) and ignored (Fig. 1B) BF and off-BF tones. We selected responses related to off-BF tones with the largest suppressive attention effect (Fig. 1C, see tuning curves). As expected based on the tuning curves, both CSD and MUA responses in the case of the BF tone streams were larger when the monkey was attending to the auditory modality. In contrast, but not surprisingly, because we selected responses to tones with largest attention related suppressive effect; the attended off-BF tone stream resulted in reduced CSD and MUA responses compared with when the same tones were ignored (same CSD and MUA scales). Although the frequency difference between the tone resulting in the largest suppression effect and the BF varied from recording site to recording site (mean = 2.11 octave, SD = 1.3), the largest response enhancement always occurred to attended BF tones, except for 3 sites (8% of all sites) where we did not observe an attention related response enhancement.
Although we initially created frequency tuning curves using the 15–40 ms poststimulus time interval, because previous studies suggest that response to pure tones is largest in this “transient response” time interval (Steinschneider et al., 2008; O'Connell et al., 2011), we next wanted to empirically test whether this was actually the timeframe in which the largest attention related MUA effects arose. Figure 2A shows the time course of pooled averaged cross-laminar MUA responses to BF and off-BF tones (selected as described above) normalized to peak ignored BF response amplitude in each experiment, for all 39 experiments, in attend (red) versus ignore auditory (blue) conditions. After statistically comparing MUA amplitudes recorded during the two attentional conditions at each time point, it is clear that the largest significant attention effect occurs between the 10–40 ms time interval (marked with dotted green vertical lines) for both types of responses, as shown by the p value graphs underneath the responses (Wilcoxon signed rank test). Remarkably, significant differences in response amplitudes to attended versus ignored BF and off-BF tones start before response onset, indicating that MUA is modulated predictively when anticipating BF versus off-BF tones in A1.
Figure 2.

The effect of attention on the MUA response and frequency tuning. A, Pooled cross-laminar MUA responses to BF (top) and off-BF (middle) tone streams during AA (red traces) and IA (blue traces) conditions. The off-BF responses shown here were selected based on largest MUA response amplitude difference between attention conditions in each experiment. p Value graph (bottom) displays the result of AA versus IA statistical comparison for each time point (Wilcoxon signed rank test). Even though the sign of the attention effect on response amplitudes is different, the largest significant effect occurs around the same time from response onset (10 ms) to ∼40 ms poststimulus (marked with dotted green vertical lines) for both BF and off-BF responses. B, The frequency tuning curves display tuning curves pooled across all experiments in the AA and AI conditions. For each site (n = 39) frequency tuning curves were created from cross-laminar MUA responses to streams of different frequency tones in the 10–40 ms poststimulus timeframe. The tuning curves were then normalized to the value of the ignored BF MUA response measure, and shifted to align the BF of all sites (n = 39) in the same position (BF in the graph). Asterisks indicate significantly different MUA amplitudes between the two conditions (Wilcoxon signed rank test). C, Boxplots show the pooled amplification indices (AA–IA BF-related MUA response amplitudes, top) and suppression indices (ΣAA-ΣIA of all off-BF related MUA response amplitudes, bottom). The indices indicate opposite sign attentional modulation (enhancement vs suppression for BF vs off-BF response related measures), both of which are significant (see Results). D, Supragranular, granular, and infragranular MUA responses associated with BF and selected (same as in A) off-BF stimuli averaged across all experiments. The 10–40 ms time interval is marked with dotted green vertical lines. E, Same modulation indices as in C but separately for each layer.
To quantify attention effects on the tuning of A1 neuronal ensembles, the frequency tuning curves of the 39 individual A1 sites were shifted to align the BF of all sites in the same position, and all values were normalized to the ignored BF related cross-laminar response amplitude in each experiment (Fig. 2B). Asterisks denote significantly different MUA response amplitudes to attended versus ignored stimuli across experiments (Wilcoxon signed rank test, p < 0.01). It is apparent that in the case of stimulus streams with tone frequencies matching the BF of the recording site, attending to the auditory modality resulted in a significantly enhanced response amplitude (mean increase = 28.61%, SD = 38.61%). For off-BF tone streams, significantly suppressive attention effects were detected to tones with frequencies as close as 1 octave to the BF, and as far away as 4.5 octaves. Note that at the extreme ends of the pooled tuning curves there were very few data points (Fig. 2B, large SE), thus it is possible that suppressive effects not detected statistically extend even to frequencies further removed from the BF.
Results presented thus far indicate that selective attention to a stream of pure tones results in both the enhancement of BF tone related responses and a suppression of responses to most other frequency tones, and therefore, a sharpening of frequency tuning. To quantify these opposing effects, we devised two indices (Fig. 2C): (1) the amplification index is simply a subtraction of the ignored normalized (as above) BF-tone related MUA response amplitude from the attended normalized BF-tone related response amplitude. If positive, this indicates an attention related enhancement of the response; this was observed in 36 (92.3%) of the experiments. (2) The suppression index is the subtraction of the sum of ignored off-BF tone related normalized MUA amplitudes from the sum of the attended off-BF tone related normalized MUA amplitudes. If negative, this index indicates a net suppressive effect of attention on off-BF tones; we found this in 29 (74.36%) of the experiments. As boxplots of the pooled indices show (Fig. 2C), the amplification index (top) was significantly larger than zero (Wilcoxon signed rank test, p < 0.001), whereas the suppression index (bottom) was significantly smaller than zero (Wilcoxon signed rank test, p = 0.0034). The finding that in most A1 sites we found a positive amplification coupled with a negative suppression index indicates that selective auditory attention results in contrast gain (increased neuronal selectivity) as opposed to simply response gain (increased neuronal activity).
Thus far, our analyses focused on MUA responses averaged across all cortical layers. To determine whether attention effects on MUA responses differed across layers, we selectively averaged MUA responses across supragranular, granular and infragranular electrode sites (see Materials and Methods). Figure 2D displays these layer-specific MUA responses related to BF and off-BF tones (selected the same way as in Fig. 2A). At first inspection, it appears that in the case of the BF related responses the largest enhancement occurs in the middle and lower layers, whereas for off-BF related responses, suppression is most prevalent in the supragranular layers. To better quantify layer-specific attention effects, we calculated amplification and suppression indices for all layers separately (Fig. 2E). We found that as foreshadowed by the averaged MUA responses, although the amplification index was significant at a very conservative criterion for the granular and infragranular layers, it was significant only with a relaxed criterion for the supragranular layers (Wilcoxon signed rank test; gran: p < 0.0001, infra: p < 0.0001, supra: p = 0.010). Additionally, the suppression index was only significantly smaller than zero for the supragranular layers (Wilcoxon signed rank test, supra: p = 0.0009, gran: p = 0.230, infra: p = 0.204). Together these results indicate that attention has differential effects on the representation of attended auditory stimuli in different layers, which we will discuss in more detail later.
Entrainment of delta oscillations by attended tone streams
The purpose of our next set of analyses was to determine whether the attention-dependent alignment of ongoing delta frequency band excitability fluctuations to the temporal structure of attended auditory streams (oscillatory entrainment) could be responsible for the opposite sign (BF vs off-BF) MUA response amplitude effects seen above, as was suggested by a prior study (Lakatos et al., 2013a). As it has been shown that inputs related to attended stimulus streams modulate the phase of (or entrain) neuronal oscillations whose frequency matches the stimulation rate (Lakatos et al., 2008, 2013a) and because our stimulation rate was at a delta rate (1.6 Hz), we specifically chose to examine delta band oscillatory. If attention-dependent frequency-specific delta entrainment is to serve as the mechanism of sharpening the frequency tuning of A1 neuronal ensembles, two basic predictions should hold true: (1) Supragranular and infragranular delta oscillations (because infragranular oscillations have been shown to be coherent with supragranular oscillations in ongoing neuronal activity; Lakatos et al., 2013a, their Fig. S1) should be entrained by most attended stimulus streams, and remain unmodulated by ignored ones. (2) Delta oscillations should be entrained to their high excitability, depolarizing phases by attended BF streams to predictively amplify responses, whereas they should be entrained to opposite, hyperpolarizing phases for the predictive suppression of off-BF stimulus stream related responses.
To test these predictions, we first examined the consistency and angle of supragranular delta phases in response to the 14 different frequency tone streams in the attended and ignored conditions. Figure 3A again shows cross-laminar MUA tuning curves from a representative site (BF = 4 kHz). The insets to the right (Fig. 3A), which show the layer-specific MUA tuning curves from attend versus ignore auditory conditions, nicely illustrate that, as our results above indicate (Fig. 2E), predominantly attention related suppression sharpens the tuning in the supragranular, whereas attention related enhancement sharpens tuning in the infragranular layers. Below the tuning curves, histograms display single trial supragranular delta (1.6 Hz corresponding to the repetition rate of the auditory streams) phases measured at stimulus onset for a subset of different frequency streams. The most apparent difference between delta phases related to attended and ignored streams is that, whereas in the attend auditory condition, delta phases are pooled around a mean phase value, phases appear completely random in the case when the same auditory streams are ignored; this satisfies our first prediction. Additionally, an examination of the phase distributions related to each of the attended streams reveals that in the case of the BF (4 kHz) stream, phases are pooled between 0 and π (the downslope of the oscillation signaling the high excitability, depolarizing phase based on previous studies; Lakatos et al., 2005b, 2008, 2013a). In contrast, in the case of the off-BF tone streams, phases are pooled oppositely, between −π and 0 (the hyperpolarizing phase), thus satisfying our second prediction. This delta band phase opposition around the time of stimulus onset is also evident in the averaged CSD plots in Figure 1A, as an opposite baseline fluctuation can be seen for attended stimuli: in the case of the BF stream a supragranular source over sink is visible just before stimulus onset (0 ms), whereas in the case of the off-BF stream a sink over source is apparent. When these stimuli are ignored the baseline fluctuation is absent (Fig. 1B), indicating a lack of entrainment in this condition.
To determine whether the above described delta phase effects hold true across all of our experiments, we first calculated the supragranular delta ITC, quantifying phase-similarity across trials, at time of stimulus onset for all tone streams in each experiment (n = 14 for both attended and ignored conditions). ITC was calculated using standard algorithms as described in Materials and Methods. We then calculated the ratio of stimulus streams with significant delta ITC (Rayleigh's uniformity test, p < 0.05) within each attention condition. Figure 3B shows ITC values in the attend condition for same experiment as in Figure 3A. In this example, all tone streams resulted in significant delta ITC indicating that regardless of their frequency relationship to the site's BF (i.e., BF or off-BF tones) delta oscillatory activity became significantly aligned or entrained to the occurrence of the tones within the stream.
Next we wanted to determine how many of the tone streams which significantly entrained supragranular delta oscillations, did so with a low excitability (or hyperpolarizing) phase. To do this we calculated the mean phase of delta oscillations at stimulus onset, and devised an index, the “phase opposition index,” which determined the percentage of attended tone streams in each experiment that entrained oscillations to a phase that was in the opposite half of the delta oscillatory cycle as the BF stream related phase. The rationale for this analysis was that since ongoing neuronal oscillations reflect rhythmic net excitability fluctuations of the local neuronal ensemble, and BF streams entrain ongoing oscillations to their high excitability phases (Fig. 3A; Lakatos et al., 2013a), we can assume that the opposite phase (the opposite half) of the delta oscillatory cycle is the low-excitability phase. Therefore, the phase opposition index is a measure of the percentage of tone streams that result in a low-excitability delta phase entrainment and consequently a predictive suppression of inputs. The phase opposition index was defined as a mean phase that differs at least a quarter cycle (half-π radians) from the BF-tone related delta phase. The graph in Figure 3C shows the results of this analysis for the representative example. Because the mean phase associated with the BF stream is subtracted from all mean phases, the BF stream related phase on the graph (green oval) becomes zero and the new mean delta phases related to all the off-BF tone streams are shown as red ovals. In this experiment, only one other tone stream resulted in a delta phase that fell within the same half of the delta oscillatory cycle (shown by the dotted blue lines) as the BF stream related phase. In this specific case, the phase opposition index was thus 86%.
Figure 4 shows the supragranular delta phase related measures across all experiments. First, as predicted by previous studies (O'Connell et al., 2011; Lakatos et al., 2013a) delta phase at stimulus onset is significantly clustered 1.10. (Rayleigh's uniformity test, p < 0.001) between 0 and π (depolarizing phase) in the case of most attended BF tone streams (Fig. 4A, purple histogram bars), thus indicating that as predicted, attending to BF tone streams resulted in the entrainment of delta oscillations to their high excitability phases. However, the distribution of off-BF tone stream related delta phases (Fig. 4A, blue histogram bars) is biased toward hyperpolarizing delta phases opposite to the BF stream related phases. This makes it unlikely that the phase difference between BF tone stream related delta phases and off-BF stream related delta phases reflects a frequency difference between the BF of a given site and the attended tone frequency. Nevertheless, we calculated the correlation of frequency difference (BF, tone frequency) and delta phases measured in different trial blocks in the attend auditory condition, and did not find a significant correlation in any of our experiments (Pearson's linear correlation, p > 0.05).
Figure 4.

Pooled delta phase measures. A, Pooled mean supragranular delta oscillatory phases related to all 14 AA tone streams in all of the 39 A1 sites (n = 14 × 39 = 546). Purple bars show mean delta phases related to AA BF tone streams, while the blue bars display the delta phase distribution related to all other AA tone streams. B, Boxplots show percentage of tone streams across all experiments, which resulted in significant supragranular delta ITC in the AA (red) and IA (blue) conditions. C, Boxplot shows percentage of AA tone streams in each experiment which entrained supragranular delta oscillations to a phase opposite to the BF stream related phase (calculated as in Fig. 3C). D, Boxplots show the pooled suppression indices (Fig. 2C) of A1 sites that showed greater, equal to or lesser phase opposition than the median phase opposition across all experiments (79%). The bracket indicates significant difference (Wilcoxon rank sum, p < 0.05).
As Figure 4B shows, regardless of tone frequency, almost all attended tone streams resulted in significant delta ITC in all experiments indicative of entrainment (like in our illustrative experiment; Fig. 3B). As opposed to this, significant delta ITC was only detected in ∼5% of the cases when the same tone streams were ignored. Finally, as Figure 4C shows, in nearly 80% of the cases, attended tone streams entrained delta oscillatory activity to a phase that was opposite to the BF tone stream related phase (mean = 77.29%, SD = 10.98%). To verify the notion that delta phase opposition is related to the sharpening of frequency tuning when rhythmic streams are attended versus when they are ignored, we split the experiments into three groups based on the phase opposition index. Fifteen sites had smaller phase opposition indices than the median (<79%), 11 sites had larger (>79%), and the rest (n = 13) had median phase opposition indices (=79%). Our prediction was that larger phase opposition ratios should result in larger suppression indices, because in this case more tone streams entrain delta oscillations to their hyperpolarizing phases resulting in a predictive suppression of responses to these tones. As Figure 4D shows, this is exactly what we found: the suppression index for the “larger than median” phase opposition group was significantly greater than the “smaller than median” group (Wilcoxon rank sum, p = 0.0127) indicating greater sharpening of tuning, while the suppression index of A1 sites with phase opposition indices equal to the median was somewhere in-between (mean suppression indices for the smaller, equal to or larger than median phase opposition: −0.0627, −0.3717, and −0.6313). Although this only supplies indirect evidence for the involvement of delta oscillations and does not prove causality, it does however suggest that the frequency selectivity of delta entrainment is related to the sharpening of tuning in a given experiment.
Next, we wondered whether the above described differing effect of attention on MUA responses in different layers, namely the domination of suppression in supragranular versus the prevalence of response enhancement in the infragranular layers (Figs. 2E, 3A) could be due to conflicting delta oscillatory dynamics in these cortical layers. Figure 5A shows another representative example of layer-specific effects of attention on the sharpness of tuning. While in the supragranular layers, the sharpness of tuning is enhanced when tones are attended by suppressing responses to off-BF tones, granular and infragranular MUA responses to BF tones are significantly larger when they are attended, thereby increasing their contrast. In an overwhelming majority of recording sites a pair of supragranular and infragranular delta amplitude peaks could be distinguished (Fig. 5B illustrates examples from 3 different recording sites), which is in line with results of previous studies (Lakatos et al., 2013a). Based on the relation of delta phases to MUA in ongoing neuronal activity in these sites, and the configuration of BF tone related laminar CSD responses, previous studies determined that in each layer, one of the delta peaks represents active, whereas the other passive net transmembrane current in the CSD profiles (Lakatos et al., 2005b, 2013a). Thus in each experiment, we measured delta oscillatory phases at only the “active” location in the supragranular and infragranular layers (Fig. 5B, s2 and i1, respectively). Figure 5C shows the distribution of supragranular and infragranular delta phases at stimulus onset when different frequency tone streams were attended. It is apparent from these distributions and the tone frequency related covariation of their mean phases (Fig. 5D), that infragranular delta phases are largely similar to supragranular ones, independent of tone frequency: whereas BF tone streams entrain delta to its high, most other tones entrain delta to its low excitability phase in extragranular layers. To be able to measure the consistency of this finding across all experiments, we calculated the phase difference between supragranular and infragranular delta phases (i.e., subtracted mean infragranular phases from mean supragranular phases) for all 14 different frequency tones (Fig. 5D, histogram) and determined whether the distribution of phase differences was significantly nonrandom within each experiment using the Rayleigh statistic. The rationale for this analysis is that if supragranular and infragranular delta phases would be entrained differently by different frequency tones, we should get phase differences that vary and thus result in a broad phase difference distribution. Figure 5E shows the result of this analysis for all experiments; we found that in most cases (27 of 39 experiments) the distribution of supra and infragranular phase differences was significantly nonrandom, and that mean phase difference values pooled slightly lower than 0. This indicates that supragranular and infragranular delta oscillatory activity is entrained similarly by attended tone streams, and that infragranular delta is slightly offset compared with supragranular delta (on average by 0.37 rad). Interestingly, this effect is also visible on phase triggered laminar CSD profiles of ongoing delta oscillatory activity (Lakatos et al., 2013a, their Fig. S1), and thus might represent a basic organizational principle of cortical operations, possibly offsetting the timing of feedforward and feedback communications within cortical columns.
Figure 5.

Layer-specific sharpening of frequency tuning and delta entrainment. A, Tuning curves in the AA (red) and IA (blue) conditions based on layer-specific MUA responses to different frequency tone streams averaged in the 10–40 ms poststimulus time interval. Note that as indicated by the blue asterisks, supragranular responses to AA tones that do not match the BF of this representative recording site (5.6 kHz) are generally significantly suppressed (Wilcoxon rank sum, p < 0.01) compared with responses to the same tones during the IA condition. In contrast, in the granular and infragranular layers of this site while there was no significant suppression of responses to AA off-BF tone streams, responses to the AA BF tone stream were significantly enhanced (indicated by red asterisks). B, Laminar delta amplitude profiles from three representative sites from AA off-BF tone trial blocks. Blue arrows indicate that the BF tone related initial CSD response in the laminar location of a given delta peak is a source (Fig. 1 shows a representative BF response profile), whereas red arrows denote laminar locations of BF related initial sinks. The peaks associated with BF related sinks represent active, whereas peaks associated with BF-related sources represent passive current in the supragranular and infragranular layers. C, Red and blue histograms show the distribution of single-trial delta phases related to 14 different frequency AA tone streams in a supragranular (B, red, marked by s2) and infragranular location (B, blue, marked by i1), from same experiment as A. Black lines denote mean phases. Note the opposition of supragranular delta phase distributions related to BF versus off-BF tone streams (similar to Fig. 3A) and the matching phase opposition in the infragranular layers. D, Red and blue squares show the mean phases of stimulus related delta oscillations in the supragranular and infragranular layers respectively (again from same experiments as in A), which appear largely the same within trial blocks. This is nicely illustrated by the distribution of the supragranular–infragranular delta phase differences related to different frequency tones (histogram on the right), which show a significantly nonrandom distribution (Rayleigh p < 0.0001), with a mean of −0.49 radians. E, The histogram displays the distribution of mean supra–infragranular phase differences across all experiments (n = 39). The black line indicates the mean (−0.37 radians), the Rayleigh p value signals a significantly nonrandom phase-difference distribution.
The somewhat contrasting findings that delta oscillations in the supra and infragranular layers are entrained to similar frequency-dependent phases by attended tone streams, but that attention influences tuning differently in these layers, most likely indicates that in addition to the phase of oscillatory entrainment (i.e., high vs low excitability) the local circuitry and connectivity of each layer greatly influences the effect of attentional modulation on their responses. One reason that suppression dominates sharpening in the supragranular layers may be that inhibition plays a more significant role in shaping neuronal ensemble activity there, compared with in the lower layers (for review, see Petersen and Crochet, 2013). For example, in vitro experiments found that the resting membrane potential of supragranular excitatory neurons is lower than infragranular ones (Lefort et al., 2009). On the other hand, a likely contributor for the higher degree of response enhancement in the granular and infragranular layers is the amplification of thalamocortical, lemniscal auditory inputs that terminate in these layers.
The net effect of attention on the excitability of A1 neuronal ensembles
The data described above show that, at least during a frequency discrimination task, delta oscillatory activity in an A1 site entrains with its low excitability phase to most rhythmic streams of tones covering the hearing range of the monkey, with the exception of tones that the given neuronal ensemble is tuned to. If true, this should be reflected in the modulation of ongoing or baseline MUA and gamma frequency oscillatory activity, two measures that index the excitability of a neuronal ensemble (Fries et al., 2001; Lakatos et al., 2008). Specifically, while excitability, and thus MUA and the amplitude of gamma band oscillatory activity, should be predictively upregulated in “anticipation” of BF tones, it should be down modulated in anticipation of most other tones. This would support a net predictive suppressive effect across narrowly tuned A1 neuronal ensembles. To test this, we compared prestimulus activity associated with attended BF streams versus averaged prestimulus activity associated with all tone streams (including the BF stream). Along with MUA and gamma oscillatory activity in the CSD, we also analyzed gamma in the LFP, due to its implications for human electrocorticogram and scalp recordings.
Figure 6A shows nonbaseline corrected laminar MUA, and gamma band filtered CSD and LFP amplitude profiles from an A1 site related to attended BF tone streams (top), and related to all attended tone streams (averaged across all streams, including the BF stream; bottom). It is apparent that although both prestimulus and poststimulus MUA is largest in the granular layer, gamma oscillatory activity has an additional supragranular maximum, similar to visual cortex (Maier et al., 2010). This pattern was the most common, but varied considerably across recording sites. Because it appears that the excitability of all cortical layers tends to fluctuate largely synchronously (O'Connell et al., 2011; Lakatos et al., 2013a), and because one of the objectives of this analysis was to estimate what effects macroscopic human recordings would detect, we averaged gamma amplitudes and MUA across all layers for quantitative analyses (Fig. 6A, bottom). In the MUA signal, there is a small fluctuation in baseline activity that is opposite in sign for BF and all stimuli: for BF stimuli MUA was elevated immediately before stimulus onset, signaling enhanced excitability compared with the average activity related to all tone streams. This effect was even more obvious in the amplitude changes of gamma frequency range CSD and LFP, which further supports the notion that gamma and MUA provide complimentary measures of the excitability of a neuronal ensemble. To quantify this excitability modulation, we calculated a modulation index which is simply a subtraction of the “interstimulus” MUA or gamma band amplitude (Fig. 6A; marked as 1, between green and black dotted lines, −300 to −150 ms) from the immediate prestimulus amplitude (marked as 2, between black and blue dotted lines, −150 to −30 ms). If positive, this index signals increasing MUA and gamma band activity in the prestimulus timeframe (predictive enhancement of excitability), whereas if negative it implies the reverse (predictive suppression of excitability). Boxplots in Figure 6B show the pooled modulation indices associated with BF and all tone streams for the three different neuronal measures. Statistical analyses comparing whether the distributions are significantly different from zero, which would signify no modulation, show that for all tone streams combined the modulation index is significantly smaller than zero for all three measures, whereas the MUA and gamma range LFP modulation indices are significantly greater than zero for BF streams. These gamma band and MUA findings demonstrate two important effects: first, as suspected, there is a significant attention related, stimulus frequency-dependent difference in prestimulus excitability, which aids in suppressing or enhancing later stimulus-related responses. Second, as predicted by our delta phase related findings and results of a recent human EEG study (Lakatos et al., 2013b), when a subject attends to a stream of pure tones the net effect across the tonotopic surface of A1 is predictive suppression, as the vast majority of A1 neuronal ensembles are not tuned to the attended tone frequency.
Although we did not analyze cross-frequency coupling in the present study, the opposite sign fluctuation of gamma amplitude related to BF versus off-BF tone streams together with the opposite phase delta entrainment does implicate delta phase–gamma amplitude coupling as a mechanism of gamma modulation.
Discussion
Our results add to the mounting evidence that the processing of specific sensory inputs relaying information about the physical properties of the external world are modulated purposefully during attentive sensing by the internal neurophysiological context, a spatial and temporal hierarchy of neuronal excitability fluctuations or oscillations. We found that during a rhythmic intermodal attention task, attending to auditory stimuli sharpened the frequency tuning of neuronal ensembles all along the tonotopic axis of A1 regardless of the frequency of attended tones. This was due to both response enhancement, if the attended frequency matched the BF of the neuronal ensemble, and response suppression when it did not. The opposite sign response amplitude effects were accompanied by an entrainment of supragranular and infragranular delta band oscillatory activity to opposing, high- versus low-excitability phases that again depended on whether attended tone frequency matched the BF of the neuronal ensemble or not: in the former case delta oscillations were entrained to their depolarizing phases, whereas in the latter to their hyperpolarizing phases by task structure. Because the greatest portion of the audible frequency spectrum can be viewed as consisting of off-BF content from the point-of-view of narrowly tuned A1 neuronal ensembles, together our results indicate that the net effect of attention to pure tones on A1 is a predictive suppression of temporally overlapping nonrelevant frequency inputs. This is signified by the finding that the excitability of the immediate baseline activity was suppressed when summed across all attended tone streams, whereas in the case of attended BF tone streams prestimulus excitability was anticipatorily increased. Together these results reveal a new property of auditory cortical operations, namely that A1 acts in unison to sharpen the representation of attended auditory objects. Another novel finding of our study is the opposing superficial to lower-layer gradients in the suppressive versus augmenting effects of attention: whereas the degree of response enhancement related to attended BF tones increased from supra- toward lower-layers, suppression related to all other tones increased in the opposite direction.
The close correspondence between response enhancement versus suppression and the opposing phases at which delta oscillations are entrained by BF and off-BF stimulus streams, together with opposite sign gamma amplitude and MUA modulation suggests a strong connection between these phenomena. To summarize, the most likely mechanistic relationship between the attention related effects in our study is the following: attended tone streams entrain ongoing oscillations to their high excitability phases in regions that preferentially process the attended frequency content, whereas outside this “BF region” oscillations are entrained to their low excitability phases, minimizing the effect of auditory inputs in nonattended frequency channels at times when attended stimuli are predicted to occur. This mechanism would be especially useful in noisy environments, where it would act as a narrow spectrotemporal filter. Accordingly, a degradation of the frequency-specific entrainment would lead to poor hearing performance in these conditions. Another prediction is that since the sharpening of tuning, in theory, allows for better frequency discrimination, a lack of entrainment would lead to inferior frequency discrimination performance. Interestingly, this is precisely what a recent study found in schizophrenia patients, who lack the entrainment of delta oscillations by the temporal structure of attended tone streams (Lakatos et al., 2013b).
There are at least two distinct ways frequency-specific oscillatory entrainment could be engaged by top-down attentive mechanisms to a stream of tones. One possibility is that predictive enhancement and suppression via opposite phase delta entrainment is “set up” simultaneously by modulating the balance of inputs mediating counter-phase phase reset and thereby the excitability of neuronal ensembles independently. A more “economical” and therefore more likely scenario is that the predictive enhancement of a given frequency channel results in suppression of all others, via a “winner take all” type mechanism. For example, afferent horizontal connections from the neuronal ensembles processing attended frequency content could reset and entrain neuronal oscillations in the rest of A1 to their hyperpolarizing phases. Whichever the case, there are also at least three anatomical routes through which attention can result in frequency-specific entrainment: top-down “tuning” of phase reset via corticocortical feedback connections, horizontal tuning of phase reset via either excitatory or inhibitory connections by neuronal ensembles tuned to the attended frequency content or modulation of nonspecific thalamocortical inputs either via intrathalamic connections or corticothalamic feedback. Disentangling which of these functional-anatomical routes is the main culprit in orchestrating the predictive spatiotemporal modulation of differently tuned neuronal ensembles in A1 will likely require a combination of techniques, such as electrophysiological recordings combined with electrical microstimulation, optogentics, pharmacological manipulations, and computational modeling.
Previous studies from our group (O'Connell et al., 2011; Lakatos et al., 2013a) have shown that off-BF tones which result in the largest suppression and are approximately 2 octaves different in frequency from the BF tone (which the present results verified) reset or entrain ongoing oscillations to the low excitability phase. The current study extends this finding by showing that response suppression is not confined to the peri-BF frequency range. This is important because it suggests that these suppressive effects are mediated by mechanisms that differ from feedforward inhibition, because that only affects a relatively narrow frequency range (Shamma and Symmes, 1985; Suga, 1995; Sutter et al., 1999).
Our study took an important first step in trying to unravel the functional circuitry underlying the mechanism of selective auditory attention in A1 by demonstrating layer-specific attentional effects: specifically we found that MUA response suppression related to attended off-BF tones is largest in the supragranular layers, whereas BF and peri-BF tone related response enhancement dominated in the granular and infragranular layers. It is known that in both the visual and auditory cortices the supragranular layers receive a large amount of input from local and long range horizontal connections (Gilbert and Wiesel, 1983; Ts'o et al., 1986; Ojima et al., 1991; Wallace et al., 1991; Bosking et al., 1997; Ojima and Takayanagi, 2004). Accordingly recent studies conducted in the primary auditory cortex of both anesthetized and awake passive mice have shown degraded frequency selectivity in the supragranular layers compared with other layers (Guo et al., 2012; Winkowski and Kanold, 2013), which is thought to be due to projections from other spectrally distinct columns in A1 (Kaur et al., 2004, 2005; Happel et al., 2010; Moeller et al., 2010). This connectivity pattern across disparately tuned neuronal ensembles in the supragranular layers might enable attention to orchestrate opposite phase effects that are temporally linked across A1, as mentioned above. In addition, studies have demonstrated the existence of long range horizontal intracortical inhibitory connections in layer II (Tomioka et al., 2005), and long range (up to 3 mm) excitatory projections terminating on inhibitory interneurons especially in the supragranular layers (Kurt et al., 2008). Either of these suppressive horizontal pathways could explain our results.
Aside from horizontal corticocortical connections, an alternative possibility is that these opposite phase effects are orchestrated by nonspecific thalamocortical inputs via thalamocortical or corticothalamo-cortical circuitry, which are known to target the supragranular layer (Molinari et al., 1995; Jones, 1998; Huang and Winer, 2000). Whatever the mechanism, since the supragranular layers of A1 project overwhelmingly to higher-order cortical regions, the attention related response selectivity in these layers will result in sharpened feedforward output from A1.
In contrast to the supragranular layers, our results indicate that the main effect of attention in the granular and infragranular layers is response enhancement. The infragranular layers of A1 are known to be part of the corticofugal system and its projections feedback to all divisions of the medial geniculate body (MGB; Winer and Prieto, 2001; Winer, 2005). Therefore, it is possible that the attentional response gain we observe in the BF region's infragranular layer serves mainly to increase the responsiveness and selectivity of the thalamic regions processing the ascending sensory input. The presence of topographically organized corticothalamic fibers (Winer et al., 2001) and frequency-specific corticothalamic modulation (Zhang and Suga, 2000) supports this notion. Another possibility is that corticothalamic feedback projections are boosted at the attended frequency channel to support a corticothalamo-cortical winner take all mechanism. This could occur through two possible routes: (1) via collaterals to the reticular nucleus of the thalamus, or (2) similar to what has been shown in the visual system (Murphy and Sillito, 1987; Olsen et al., 2012) via corticothalamic projections suppressing thalamocortically projecting neurons by terminating on inhibitory interneurons of the MGB. In both scenarios, the boosted cortical feedback from A1 neuronal ensembles processing attended frequency content would sharpen the frequency tuning of thalamocortical projections.
Together our results indicate that subthreshold neuronal oscillations across all of primary auditory cortex are modulated in concert to sharpen the frequency tuning of neuronal ensembles and thereby enhance the representation of the attended auditory stream in a layer-specific manner.
Footnotes
This work was supported by NIH Grant R01DC012947 from the NIDCD.
The authors declare no competing financial interests.
References
- Atiani S, Elhilali M, David SV, Fritz JB, Shamma SA. Task difficulty and performance induce diverse adaptive patterns in gain and shape of primary auditory cortical receptive fields. Neuron. 2009;61:467–480. doi: 10.1016/j.neuron.2008.12.027. [DOI] [PMC free article] [PubMed] [Google Scholar]
- Bosking WH, Zhang Y, Schofield B, Fitzpatrick D. Orientation selectivity and the arrangement of horizontal connections in tree shrew striate cortex. J Neurosci. 1997;17:2112–2127. doi: 10.1523/JNEUROSCI.17-06-02112.1997. [DOI] [PMC free article] [PubMed] [Google Scholar]
- Bruns A. Fourier-, Hilbert- and wavelet-based signal analysis: are they really different approaches? J Neurosci Methods. 2004;137:321–332. doi: 10.1016/j.jneumeth.2004.03.002. [DOI] [PubMed] [Google Scholar]
- Foeller E, Vater M, Kössl M. Laminar analysis of inhibition in the gerbil primary auditory cortex. J Assoc Res Otolaryngol. 2001;2:279–296. doi: 10.1007/s101620010069. [DOI] [PMC free article] [PubMed] [Google Scholar]
- Freeman JA, Nicholson C. Experimental optimization of current source-density technique for anuran cerebellum. J Neurophysiol. 1975;38:369–382. doi: 10.1152/jn.1975.38.2.369. [DOI] [PubMed] [Google Scholar]
- Fries P, Reynolds JH, Rorie AE, Desimone R. Modulation of oscillatory neuronal synchronization by selective visual attention. Science. 2001;291:1560–1563. doi: 10.1126/science.1055465. [DOI] [PubMed] [Google Scholar]
- Fritz JB, Elhilali M, David SV, Shamma SA. Does attention play a role in dynamic receptive field adaptation to changing acoustic salience in A1? Hear Res. 2007a;229:186–203. doi: 10.1016/j.heares.2007.01.009. [DOI] [PMC free article] [PubMed] [Google Scholar]
- Fritz JB, Elhilali M, Shamma SA. Adaptive changes in cortical receptive fields induced by attention to complex sounds. J Neurophysiol. 2007b;98:2337–2346. doi: 10.1152/jn.00552.2007. [DOI] [PubMed] [Google Scholar]
- Galindo-Leon EE, Lin FG, Liu RC. Inhibitory plasticity in a lateral band improves cortical detection of natural vocalizations. Neuron. 2009;62:705–716. doi: 10.1016/j.neuron.2009.05.001. [DOI] [PMC free article] [PubMed] [Google Scholar]
- Gilbert CD, Wiesel TN. Clustered intrinsic connections in cat visual cortex. J Neurosci. 1983;3:1116–1133. doi: 10.1523/JNEUROSCI.03-05-01116.1983. [DOI] [PMC free article] [PubMed] [Google Scholar]
- Guo W, Chambers AR, Darrow KN, Hancock KE, Shinn-Cunningham BG, Polley DB. Robustness of cortical topography across fields, laminae, anesthetic states, and neurophysiological signal types. J Neurosci. 2012;32:9159–9172. doi: 10.1523/JNEUROSCI.0065-12.2012. [DOI] [PMC free article] [PubMed] [Google Scholar]
- Happel MF, Jeschke M, Ohl FW. Spectral integration in primary auditory cortex attributable to temporally precise convergence of thalamocortical and intracortical input. J Neurosci. 2010;30:11114–11127. doi: 10.1523/JNEUROSCI.0689-10.2010. [DOI] [PMC free article] [PubMed] [Google Scholar]
- Hromádka T, Zador AM. Toward the mechanisms of auditory attention. Hear Res. 2007;229:180–185. doi: 10.1016/j.heares.2007.01.002. [DOI] [PMC free article] [PubMed] [Google Scholar]
- Huang CL, Winer JA. Auditory thalamocortical projections in the cat: laminar and areal patterns of input. J Comp Neurol. 2000;427:302–331. doi: 10.1002/1096-9861(20001113)427:2<302::AID-CNE10>3.0.CO%3B2-J. [DOI] [PubMed] [Google Scholar]
- Jones EG. Viewpoint: the core and matrix of thalamic organization. Neuroscience. 1998;85:331–345. doi: 10.1016/S0306-4522(97)00581-2. [DOI] [PubMed] [Google Scholar]
- Kaas JH, Hackett TA. Subdivisions of auditory cortex and processing streams in primates. Proc Natl Acad Sci U S A. 2000;97:11793–11799. doi: 10.1073/pnas.97.22.11793. [DOI] [PMC free article] [PubMed] [Google Scholar]
- Kaur S, Lazar R, Metherate R. Intracortical pathways determine breadth of subthreshold frequency receptive fields in primary auditory cortex. J Neurophysiol. 2004;91:2551–2567. doi: 10.1152/jn.01121.2003. [DOI] [PubMed] [Google Scholar]
- Kaur S, Rose HJ, Lazar R, Liang K, Metherate R. Spectral integration in primary auditory cortex: laminar processing of afferent input, in vivo and in vitro. Neuroscience. 2005;134:1033–1045. doi: 10.1016/j.neuroscience.2005.04.052. [DOI] [PubMed] [Google Scholar]
- Kurt S, Deutscher A, Crook JM, Ohl FW, Budinger E, Moeller CK, Scheich H, Schulze H. Auditory cortical contrast enhancing by global winner-take-all inhibitory interactions. PLoS One. 2008;3:e1735. doi: 10.1371/journal.pone.0001735. [DOI] [PMC free article] [PubMed] [Google Scholar]
- Lakatos P, Pincze Z, Fu KM, Javitt DC, Karmos G, Schroeder CE. Timing of pure tone and noise-evoked responses in macaque auditory cortex. Neuroreport. 2005a;16:933–937. doi: 10.1097/00001756-200506210-00011. [DOI] [PubMed] [Google Scholar]
- Lakatos P, Shah AS, Knuth KH, Ulbert I, Karmos G, Schroeder CE. An oscillatory hierarchy controlling neuronal excitability and stimulus processing in the auditory cortex. J Neurophysiol. 2005b;94:1904–1911. doi: 10.1152/jn.00263.2005. [DOI] [PubMed] [Google Scholar]
- Lakatos P, Chen CM, O'Connell MN, Mills A, Schroeder CE. Neuronal oscillations and multisensory interaction in primary auditory cortex. Neuron. 2007;53:279–292. doi: 10.1016/j.neuron.2006.12.011. [DOI] [PMC free article] [PubMed] [Google Scholar]
- Lakatos P, Karmos G, Mehta AD, Ulbert I, Schroeder CE. Entrainment of neuronal oscillations as a mechanism of attentional selection. Science. 2008;320:110–113. doi: 10.1126/science.1154735. [DOI] [PubMed] [Google Scholar]
- Lakatos P, Musacchia G, O'Connel MN, Falchier AY, Javitt DC, Schroeder CE. The spectrotemporal filter mechanism of auditory selective attention. Neuron. 2013a;77:750–761. doi: 10.1016/j.neuron.2012.11.034. [DOI] [PMC free article] [PubMed] [Google Scholar]
- Lakatos P, Schroeder CE, Leitman DI, Javitt DC. Predictive suppression of cortical excitability and its deficit in schizophrenia. J Neurosci. 2013b;33:11692–11702. doi: 10.1523/JNEUROSCI.0010-13.2013. [DOI] [PMC free article] [PubMed] [Google Scholar]
- Lefort S, Tomm C, Floyd Sarria JC, Petersen CC. The excitatory neuronal network of the C2 barrel column in mouse primary somatosensory cortex. Neuron. 2009;61:301–316. doi: 10.1016/j.neuron.2008.12.020. [DOI] [PubMed] [Google Scholar]
- Legatt AD, Arezzo J, Vaughan HG., Jr Averaged multiple unit activity as an estimate of phasic changes in local neuronal activity: effects of volume-conducted potentials. J Neurosci Methods. 1980;2:203–217. doi: 10.1016/0165-0270(80)90061-8. [DOI] [PubMed] [Google Scholar]
- Maier A, Adams GK, Aura C, Leopold DA. Distinct superficial and deep laminar domains of activity in the visual cortex during rest and stimulation. Front Syst Neurosci. 2010;4:31. doi: 10.3389/fnsys.2010.00031. [DOI] [PMC free article] [PubMed] [Google Scholar]
- Mendelson JR, Schreiner CE, Sutter ML. Functional topography of cat primary auditory cortex: response latencies. J Comp Physiol A. 1997;181:615–633. doi: 10.1007/s003590050145. [DOI] [PubMed] [Google Scholar]
- Merzenich MM, Brugge JF. Representation of the cochlear partition of the superior temporal plane of the macaque monkey. Brain Res. 1973;50:275–296. doi: 10.1016/0006-8993(73)90731-2. [DOI] [PubMed] [Google Scholar]
- Mitzdorf U. Current source-density method and application in cat cerebral cortex: investigation of evoked potentials and EEG phenomena. Physiol Rev. 1985;65:37–100. doi: 10.1152/physrev.1985.65.1.37. [DOI] [PubMed] [Google Scholar]
- Moeller CK, Kurt S, Happel MF, Schulze H. Long-range effects of GABAergic inhibition in gerbil primary auditory cortex. Eur J Neurosci. 2010;31:49–59. doi: 10.1111/j.1460-9568.2009.07039.x. [DOI] [PubMed] [Google Scholar]
- Molinari M, Dell'Anna ME, Rausell E, Leggio MG, Hashikawa T, Jones EG. Auditory thalamocortical pathways defined in monkeys by calcium-binding protein immunoreactivity. J Comp Neurol. 1995;362:171–194. doi: 10.1002/cne.903620203. [DOI] [PubMed] [Google Scholar]
- Murphy PC, Sillito AM. Corticofugal feedback influences the generation of length tuning in the visual pathway. Nature. 1987;329:727–729. doi: 10.1038/329727a0. [DOI] [PubMed] [Google Scholar]
- Neelon MF, Williams J, Garell PC. Elastic attention: enhanced, then sharpened response to auditory input as attentional load increases. Front Hum Neurosci. 2011;5:41. doi: 10.3389/fnhum.2011.00041. [DOI] [PMC free article] [PubMed] [Google Scholar]
- O'Connell MN, Falchier A, McGinnis T, Schroeder CE, Lakatos P. Dual mechanism of neuronal ensemble inhibition in primary auditory cortex. Neuron. 2011;69:805–817. doi: 10.1016/j.neuron.2011.01.012. [DOI] [PMC free article] [PubMed] [Google Scholar]
- Ohl FW, Scheich H. Differential frequency conditioning enhances spectral contrast sensitivity of units in auditory cortex (field AL) of the alert Mongolian gerbil. Eur J Neurosci. 1996;8:1001–1017. doi: 10.1111/j.1460-9568.1996.tb01587.x. [DOI] [PubMed] [Google Scholar]
- Ojima H, Takayanagi M. Cortical convergence from different frequency domains in the cat primary auditory cortex. Neuroscience. 2004;126:203–212. doi: 10.1016/j.neuroscience.2004.03.018. [DOI] [PubMed] [Google Scholar]
- Ojima H, Honda CN, Jones EG. Patterns of axon collateralization of identified supragranular pyramidal neurons in the cat auditory cortex. Cereb Cortex. 1991;1:80–94. doi: 10.1093/cercor/1.1.80. [DOI] [PubMed] [Google Scholar]
- Okamoto H, Stracke H, Wolters CH, Schmael F, Pantev C. Attention improves population-level frequency tuning in human auditory cortex. J Neurosci. 2007;27:10383–10390. doi: 10.1523/JNEUROSCI.2963-07.2007. [DOI] [PMC free article] [PubMed] [Google Scholar]
- Olsen SR, Bortone DS, Adesnik H, Scanziani M. Gain control by layer six in cortical circuits of vision. Nature. 2012;483:47–52. doi: 10.1038/nature10835. [DOI] [PMC free article] [PubMed] [Google Scholar]
- Petersen CC, Crochet S. Synaptic computation and sensory processing in neocortical layer 2/3. Neuron. 2013;78:28–48. doi: 10.1016/j.neuron.2013.03.020. [DOI] [PubMed] [Google Scholar]
- Pfingst BE, Laycock J, Flammino F, Lonsbury-Martin B, Martin G. Pure tone thresholds for the rhesus monkey. Hear Res. 1978;1:43–47. doi: 10.1016/0378-5955(78)90008-4. [DOI] [PubMed] [Google Scholar]
- Rauschecker JP, Tian B, Pons T, Mishkin M. Serial and parallel processing in rhesus monkey auditory cortex. J Comp Neurol. 1997;382:89–103. doi: 10.1002/(SICI)1096-9861(19970526)382:1<89::AID-CNE6>3.0.CO%3B2-G. [DOI] [PubMed] [Google Scholar]
- Sadagopan S, Wang X. Contribution of inhibition to stimulus selectivity in primary auditory cortex of awake primates. J Neurosci. 2010;30:7314–7325. doi: 10.1523/JNEUROSCI.5072-09.2010. [DOI] [PMC free article] [PubMed] [Google Scholar]
- Schroeder CE, Mehta AD, Givre SJ. A spatiotemporal profile of visual system activation revealed by current source density analysis in the awake macaque. Cereb Cortex. 1998;8:575–592. doi: 10.1093/cercor/8.7.575. [DOI] [PubMed] [Google Scholar]
- Schroeder CE, Lindsley RW, Specht C, Marcovici A, Smiley JF, Javitt DC. Somatosensory input to auditory association cortex in the macaque monkey. J Neurophysiol. 2001;85:1322–1327. doi: 10.1152/jn.2001.85.3.1322. [DOI] [PubMed] [Google Scholar]
- Shamma SA, Symmes D. Patterns of inhibition in auditory cortical cells in awake squirrel monkeys. Hear Res. 1985;19:1–13. doi: 10.1016/0378-5955(85)90094-2. [DOI] [PubMed] [Google Scholar]
- Slotnick B. A simple 2-transistor touch or lick detector circuit. J Exp Anal Behav. 2009;91:253–255. doi: 10.1901/jeab.2009.91-253. [DOI] [PMC free article] [PubMed] [Google Scholar]
- Steinschneider M, Reser D, Schroeder CE, Arezzo JC. Tonotopic organization of responses reflecting stop consonant place of articulation in primary auditory cortex (A1) of the monkey. Brain Res. 1995;674:147–152. doi: 10.1016/0006-8993(95)00008-E. [DOI] [PubMed] [Google Scholar]
- Steinschneider M, Fishman YI, Arezzo JC. Spectrotemporal analysis of evoked and induced electroencephalographic responses in primary auditory cortex (A1) of the awake monkey. Cereb Cortex. 2008;18:610–625. doi: 10.1093/cercor/bhm094. [DOI] [PubMed] [Google Scholar]
- Suga N. Sharpening of frequency tuning by inhibition in the central auditory system: tribute to Yasuji Katsuki. Neurosci Res. 1995;21:287–299. doi: 10.1016/0168-0102(94)00868-G. [DOI] [PubMed] [Google Scholar]
- Sutter ML, Schreiner CE, McLean M, O'connor KN, Loftus WC. Organization of inhibitory frequency receptive fields in cat primary auditory cortex. J Neurophysiol. 1999;82:2358–2371. doi: 10.1152/jn.1999.82.5.2358. [DOI] [PubMed] [Google Scholar]
- Tomioka R, Okamoto K, Furuta T, Fujiyama F, Iwasato T, Yanagawa Y, Obata K, Kaneko T, Tamamaki N. Demonstration of long-range GABAergic connections distributed throughout the mouse neocortex. Eur J Neurosci. 2005;21:1587–1600. doi: 10.1111/j.1460-9568.2005.03989.x. [DOI] [PubMed] [Google Scholar]
- Ts'o DY, Gilbert CD, Wiesel TN. Relationships between horizontal interactions and functional architecture in cat striate cortex as revealed by cross-correlation analysis. J Neurosci. 1986;6:1160–1170. doi: 10.1523/JNEUROSCI.06-04-01160.1986. [DOI] [PMC free article] [PubMed] [Google Scholar]
- Wallace MN, Kitzes LM, Jones EG. Intrinsic inter- and intralaminar connections and their relationship to the tonotopic map in cat primary auditory cortex. Exp Brain Res. 1991;86:527–544. doi: 10.1007/BF00230526. [DOI] [PubMed] [Google Scholar]
- Wang J, Caspary D, Salvi RJ. GABA-A antagonist causes dramatic expansion of tuning in primary auditory cortex. Neuroreport. 2000;11:1137–1140. doi: 10.1097/00001756-200004070-00045. [DOI] [PubMed] [Google Scholar]
- Winer JA. Decoding the auditory corticofugal systems. Hear Res. 2005;207:1–9. doi: 10.1016/j.heares.2005.06.007. [DOI] [PubMed] [Google Scholar]
- Winer JA, Prieto JJ. Layer V in cat primary auditory cortex (AI): cellular architecture and identification of projection neurons. J Comp Neurol. 2001;434:379–412. doi: 10.1002/cne.1183. [DOI] [PubMed] [Google Scholar]
- Winer JA, Diehl JJ, Larue DT. Projections of auditory cortex to the medial geniculate body of the cat. J Comp Neurol. 2001;430:27–55. doi: 10.1002/1096-9861(20010129)430:1<27::AID-CNE1013>3.0.CO%3B2-8. [DOI] [PubMed] [Google Scholar]
- Winkowski DE, Kanold PO. Laminar transformation of frequency organization in auditory cortex. J Neurosci. 2013;33:1498–1508. doi: 10.1523/JNEUROSCI.3101-12.2013. [DOI] [PMC free article] [PubMed] [Google Scholar]
- Zhang Y, Suga N. Modulation of responses and frequency tuning of thalamic and collicular neurons by cortical activation in mustached bats. J Neurophysiol. 2000;84:325–333. doi: 10.1152/jn.2000.84.1.325. [DOI] [PubMed] [Google Scholar]