

Abstract
Functional connectivity magnetic resonance imaging (fcMRI) is a powerful tool for understanding the network level organization of the brain in research settings and is increasingly being used to study large-scale neuronal network degeneration in clinical trial settings. Presently, a variety of techniques, including seed-based correlation analysis and group independent components analysis (with either dual regression or back projection) are commonly employed to compute functional connectivity metrics. In the present report, we introduce template based rotation,1 a novel analytic approach optimized for use with a priori network parcellations, which may be particularly useful in clinical trial settings. Template based rotation was designed to leverage the stable spatial patterns of intrinsic connectivity derived from out-of-sample datasets by mapping data from novel sessions onto the previously defined a priori templates. We first demonstrate the feasibility of using previously defined a priori templates in connectivity analyses, and then compare the performance of template based rotation to seed based and dual regression methods by applying these analytic approaches to an fMRI dataset of normal young and elderly subjects. We observed that template based rotation and dual regression are approximately equivalent in detecting fcMRI differences between young and old subjects, demonstrating similar effect sizes for group differences and similar reliability metrics across 12 cortical networks. Both template based rotation and dual-regression demonstrated larger effect sizes and comparable reliabilities as compared to seed based correlation analysis, though all three methods yielded similar patterns of network differences. When performing inter-network and sub-network connectivity analyses, we observed that template based rotation offered greater flexibility, larger group differences, and more stable connectivity estimates as compared to dual regression and seed based analyses. This flexibility owes to the reduced spatial and temporal orthogonality constraints of template based rotation as compared to dual regression. These results suggest that template based rotation can provide a useful alternative to existing fcMRI analytic methods, particularly in clinical trial settings where predefined outcome measures and conserved network descriptions across groups are at a premium.
Introduction
Examination of spontaneous fluctuations in the blood-oxygen level dependent (BOLD) signal during functional magnetic resonance imaging (fMRI) data acquisition reveals patterns of coordinated activity across distant anatomic sites within the brain. This imaging method, termed “resting-state fMRI” and often referred to as functional connectivity MRI (fcMRI), has revealed the presence of intrinsically connected cortical networks across subjects (Yeo et al., 2011), across time (Damoiseaux et al., 2006; Shehzad et al., 2009), within behavioral states (Smith et al., 2009), and even across species (Margulies et al., 2009; Lu et al., 2012).
Increasingly, fcMRI measures are being used to describe network dysfunction in human disease and provide a non-invasive assessment of the cortical network integrity that is critical for complex behaviors such as memory and attention. The default mode, salience, dorsal attention, and control networks in particular have been heavily studied in cognitive aging, Alzheimer’s disease, schizophrenia, and autism among other disorders (see Fox and Greicius, 2010; van den Heuvel and Pol, 2010; Rosazza and Minati, 2011; Lee et al., 2012 for reviews). Additionally, fcMRI will be used as a secondary outcome measure in at least three major Alzheimer’s disease prevention trials (Sperling et al., 2011; Reiman et al., 2011; Mills et al., 2013).
Despite the increasing use of fcMRI in clinical trial settings, substantial work remains to optimize analytic (and acquisition) techniques for the unique requirements of clinical trials. We outline a newly developed fcMRI analytic technique that we term template based rotation (TBR). TBR builds on the strengths of seed-based correlation analysis (SCA) (Fox and Raichle, 2007; Van Dijk et al., 2010), group independent component analysis (group ICA) (Calhoun et al., 2001, 2009; Beckmann et al., 2005, 2009; Erhardt et al., 2010), and dual regression (DR) (Beckman, 2009; Filippini et al., 2009) while also demonstrating the utility and feasibility of using a priori network templates derived out of sample. The methodological enhancements in TBR may help address many of the analytic concerns that are particularly important for the use of fcMRI in clinical trial settings.
The TBR approach is made possible by two intersecting conceptual and technical developments. First, a number of studies have demonstrated that high order, group level functional network parcellations (i.e spatial patterns) are highly stable and highly reproducible across time, across populations, across analysis methods, and across cognitive states (Damoiseaux et al., 2006; Shehzad et al., 2009; Smith et al., 2009; Guo et al., 2010; Meindl et al., 2010; Van Dijk et al., 2010; Zuo et al., 2010; Biswal et al., 2010; Yeo et al., 2011; Chou et al., 2012). This, in turn, suggests that the functional organization of the human brain into functional networks is largely static at this level of description. Second, the recent availability of large datasets consisting of hundreds or thousands of subjects has made it possible to create robust and accurate population level representations of the brain’s functional organization (e.g. the Genome Superstruct Project (Yeo et al., 2011), the 1000 Functional Connectomes Project (Biswal et al., 2010), and the Human Connectome Project (Van Essen et al., 2013)). Taking these developments together, we have the opportunity to utilize the spatial stability of the brain’s functional organization and the accuracy of population level descriptions from large datasets to drive the analysis of individual resting state acquisitions that would otherwise be too noisy and too unstable to recover the level of detailed functional organization we desire. Employing a priori network parcellations brings a number of advantages, including the ability to compare small samples to a known reference group; the ability to compare groups with unequal sample sizes (where one group may contribute disproportionally to the group level parcellation); the ability to retain a high number of components to study sub-network architecture and connectivity (especially when dealing with small sample sizes); ease in performing interim analyses (before the full dataset has been collected); and perhaps most importantly, a higher degree of reproducibility and comparability across studies that utilize the same a priori network descriptions (see Cole et al., 2010 for a review). These advantages are particularly important in the context of clinical trials, where regulatory approval requires the use of pre-defined network descriptions and outcome measures.
With these considerations in mind, we devised template based rotation (TBR) to use a priori, out-of-sample spatial templates to drive functional connectivity analysis of single subjects. In the present report we (1) introduce the TBR method (2) establish the viability of using a priori out-of-sample templates, and (3) validate the results of TBR analysis by comparison to both dual regression and seed-based connectivity analysis. Methodological comparisons are facilitated via examination of a real fcMRI dataset of young and elderly subjects, evaluating both group differences and within session/across run reliability of functional connectivity measures. We argue that TBR provides a useful way to estimate functional connectivity with reduced orthogonality assumptions; that it does so without sacrificing measurement efficacy; is well suited to using a priori templates; and offers promise for new lines of inquiry regarding inter-, intra-, and sub-network connectivities.
Methods
Overview of functional connectivity analysis methods
Nearly all functional connectivity metrics rely on temporal covariance to estimate synchrony, and the total information available from a functional connectivity analysis is best represented by the temporal covariance matrix across all voxels. All commonly used functional connectivity analysis procedures leverage and extract information from this covariance matrix in order to create functional connectivity maps and compute functional connectivity metrics. Currently, the two most commonly used methods for utilizing a priori network information are seed-based correlation analysis, which uses knowledge of prior peaks and seed locations and dual regression, which uses whole brain spatial patterns, typically from a group ICA.
Seed based correlation analysis
Seed-based connectivity (SCA) was first described by Biswal et al. (1995) and is still the most commonly used functional connectivity analysis technique. SCA has the advantage of simplicity of implementation, ease of interpretation, and flexibility of implementation. A set of seed regions is extracted and then used to make pair-wise connectivity measurements via Pearson’s correlation between the time courses from those seed regions. SCA is an inherently regional technique, and makes it very easy to examine region-to-region connectivity. However scaling seed based techniques to full networks, and higher order functional organization is more difficult. Additionally, for a network such as the default mode, there are numerous seed regions and subtly different incarnations of the default mode network that one could test, and there is no simple way to choose between them or to optimize one’s choice without moving to a large number of seeds coupled with analytic techniques such as cluster analysis, factor analysis, or graph theoretic analysis.
From the vantage point of the full functional covariance matrix, SCA utilizes a small fraction of the full information available. SCA typically operates with spherical seed regions that use a small fraction of the total information available and are likely to introduce noise related to subject-to-subject and scan-to-scan fit of the seed regions that are selected. Recently there have been moves to deal with this either by using a large number of seed regions (Yeo et al., 2011; Bullmore and Sporns, 2009; Rubinov and Sporns, 2010), structurally defined seed regions (Richiardi et al., 2011), or by utilizing large ROIs from group ICA analyses instead of spherical seeds (Shrier et al., 2012; Jones et al., 2012), with all of these approaches moving towards graph theoretic or clustering frameworks to more completely utilize the information available in the full connectivity matrix. While these advancements are welcome improvements and growing in popularity, they come with increased computational burden and interpretational complexity.
Dual regression
Dual regression (DR) was first introduced as a method of estimating voxel-wise connectivity maps for individual subjects/runs from group ICA components derived from the same dataset (Beckmann et al., 2009; Filippini et al., 2009). While alternative methods of back projection from group ICA components have been devised (e.g GICA3, Erhardt et al., 2010), dual regression remains the most commonly used group ICA method that could be used with out-of-sample, a priori templates, though to our knowledge the use of out-of-sample components has never been published. While dual regression is typically used to create individual subject maps from the group ICA components derived on the same data, there is nothing inherent to the method that prevents the use of out-of-sample component maps, and we use this ability to provide a direct comparison between dual regression and template based rotation.
Mathematically dual regression can be defined as two sequential linear regressions, which in matrix algebra can be expressed as:
where X is an m-voxel by n-template matrix of demeaned spatial templates, and D is an n-voxel by p-volume matrix of functional volumes from a single subject (also demeaned) and ((X’X)−1X’) is the pseudo inverse of X. Resulting in T: an n-template by p-volume matrix of time-series. Once the time courses are obtained (the first regression), they are passed back to the second regression:–
The second regression results in M, an n-template by m-voxel matrix of connectivity maps.
In words, spatial components are regressed onto individual functional volumes, whereby each functional volume is estimated as linearly weighted sum of component maps. The corresponding beta weights are then used as time courses, which are regressed onto the temporal fluctuations of each voxel producing connectivity maps.
This procedure can work very well as long as certain assumptions about the template set and the dataset are met. Given that the beta weights from the spatial regression are derived via multiple regression, the beta weights are representative of only the unique variance associated with each template. This is generally not a problem, particularly for group ICA components, where the group level parcellations are optimized for maximal independence. However, as the spatial maps in the template set become more collinear (i.e. components with greater overlap) the parameter estimates of the beta weights will become progressively more unstable. In certain contexts the orthogonal nature of dual regression can be a benefit by isolating network signal, and removing non-neuronal signal, but it can also result in the removal of relevant neuronal signal that is shared across components.
As compared to standard SCA methods, dual regression more fully utilizes the full covariance matrix via a relatively small number of spatial descriptions (networks/components) that describe the majority of the covariance structure in the BOLD fluctuations. However due to the use of multiple regression, dual regressions insist on both spatial orthogonality and temporal orthogonality and therefore excludes any shared variance in either domain. This can be an advantage when the shared variance is largely representative of noise or nuisance signal, but can also be a serious drawback when assumptions of spatial orthogonality and temporal orthogonality are not met. Existing evidence indicates that functional connectivity data are non-stationary (Chang et al., 2010; Jones et al., 2012), and that connectivity patterns are influenced by cognitive state (Richiardi et al., 2011; Shirer et al., 2011), both of which imply caution when assuming static orthogonality of spatial and temporal connectivity patterns. While the drawbacks of the strong orthogonality assumptions can be ameliorated by the use of carefully crafted template sets, dual regression nevertheless places a strong limitation on the set of all possible template sets, namely that they must exhibit both spatial orthogonality and temporal orthogonality. As such, dual regression is optimal when these assumptions are met and when the spatiotemporal covariance is representative of non-neuronal signal. It is non-optimal when any of the foregoing assumptions are not met, and it is highly likely that these assumptions are routinely violated.
Template based rotation (TBR)
Here we introduce a new method called template based rotation (TBR) that was specifically designed for the application of a priori, out-of-sample network templates. Paramount to our considerations was a method with reduced assumptions regarding the spatial orthogonality and temporal orthogonality of network descriptions. TBR is conceptually similar to dual regression in that it utilizes a set of spatial templates to constrain the parcellation of variance in individual fMRI sessions, and recovers time courses that correspond to the spatial patterns in the template set. The primary discriminant between dual regression and TBR is in the direction of the prediction. Dual regression predicts the BOLD pattern in each volume as a linear combination of templates, whereas TBR predicts templates as a linear combination of functional volumes. This inversion of the directionality results in the removal of spatial and temporal orthogonality assumptions of distributed functional networks since each network representation is estimated independently.
The TBR analysis method entails first performing a spatial principal component analysis (PCA) such that in matrix algebra forms:
and
where D is an m-voxel by p-volume matrix corresponding to a single fMRI session; R is the principal component rotation matrix, and C are the principal components. Note that by definition the principal components C are orthogonal to one another.
The principal components C are then mapped onto the templates X via multiple regressions (note this is equivalent to a Procrustes rotation):
where X is again an m-voxel by n-template matrix of demeaned spatial templates. At this point we have a set of beta weights that maps the principal components onto the templates such that C * B represents the best fit in a least squares sense to the templates.
In order to obtain time courses we use the principal component matrix to un-mix the parameter estimates associated with the principal components back to individual functional volumes via:
where R is the principal component rotation matrix. With time courses in hand, we then create correlation maps corresponding to each template via simple correlation. It should be noted that, if time-courses are not desired, the TBR procedure can operate by directly regressing individual functional volumes onto the templates. Fig. 1 shows a schematic of dual regression and TBR approaches.
Fig. 1.

Schematic representation of dual-regression and template based rotation (TBR). In dual regression linearly weighted combinations of templates are used to predict individual volumes, the corresponding beta series are then used as time courses. TBR inverts this approach and maps individual volumes onto templates. Note that beta values (β) are representative of only the unique variance from each source. In dual regression β values reflect the unique variance associated with each template. In TBR the beta values reflect the unique variance from each volume. When combined with a spatial PCA prior to TBR mapping, the source images are by default orthogonal and beta values are by definition independent. We argue that TBR offers reduced assumptions and is better suited to functional connectivity analysis, particularly the application of out-of-sample templates.
The above matrix algebra consists of a multiple regression analysis where the individual volumes are used to predict the spatial pattern of each template. The recovery of time-course information via un-mixing through the principal component matrix then allows for optional control of particular components (via covariates in a multiple regression) and investigating temporal collinearity between templates. Since each template is fit independently (see Fig. 1) there is no influence of having spatial collinearity between templates. In contrast to dual regression, this means that measurements are not affected by what is or is not part of the template set, but only by the particular spatial pattern of each template. This raises a question regarding whether nuisance variance is being adequately controlled for. The answer is in the structure of the templates themselves; if the template for the DMN is representative of the DMN independent of sources of nuisance variance (e.g. global, white matter, CSF signal, movement, signal artifact), then TBR will implicitly control for these sources of nuisance variance.
TBR assumes that the spatial pattern of a given template is a meaningful segmentation of the variance present in the functional run, with no other assumptions regarding the spatial or temporal distinctiveness of templates. The lack of orthogonality constraints allows the same variance in the functional run to be reused to fit multiple templates, thereby allowing for temporal collinearity and spatial collinearity and allowing the assessment of dependence between functional connectivity networks. As an example, TBR would be ideally suited for the application of temporal independent functional modes identified in Smith et al., 2012, which exhibit relatively high levels of spatial collinearity.
Data
Participants
Participants were healthy, native English-speaking adults with normal or corrected-to-normal vision. Subjects had no history of psychiatric or neurological disorders, head trauma, and were not using any psychoactive medications. Informed consent was obtained in accordance with the institutional review boards of the Massachusetts General Hospital (Boston, MA) and Harvard University (Cambridge, MA). Subjects fell into one of three groups. (1) The “template dataset” (n = 675, 382 female, 607 right-handed, age = 20.92 ± 2.43, age range = 18–35), a subset of the Genome Superstruct Project (GSP). (2) The “young test dataset” (n = 70, 34 female, 70 right-handed, age = 21.53 ± 3.66, age range = 18–34), collected as young controls for the Harvard Aging Brain (HAB) study. (3) The “elderly test dataset” (n = 70, 33 female, 70 right-handed, age = 75.51 ± 6.36, age range = 65–90), a subset of elderly cognitively normal participants from the HAB study. All subjects underwent two back-to-back resting-state functional magnetic resonance imaging (rsfMRI) scans (6 min. per run), and one high-resolution T1-weighted multi-echo magnetization prepared rapid gradient echo scan (MEMPRAGE; van der Kouwe et al., 2008). All subjects included in the present report passed automated quality assessment (QA) procedures for both resting state runs. All data met criteria of global signal to noise (SNR) greater than 115, average movement less than .15 mm/TR, and number of bad/scrubbed volumes less than 20. Bad volumes were identified as volumes where global signal was greater than or less than 2.5 standard deviations of the entire run, where movement was greater than .75 mm between TRs, or where rotation was more than 1.5° between TRs. Bad volumes were scrubbed from the analyses by removing the volumes after preprocessing but prior to computing connectivity maps or templates.
Image acquisition
All data were collected using matched 3T Trio Tim scanners (Siemens Medical Systems, Erlangen, Germany) using a 12-channel phased-array head coil. Scanner noise was attenuated using foam earplugs. rsfMRI data were acquired using a gradient-echo echo-planar imaging sequence sensitive to BOLD contrast. Whole-brain coverage, including the cerebellum, was acquired aligned parallel to the anterior-/posterior-commissure using the following parameters: repetition time (TR) = 3000 ms, echo time (TE) = 30 ms, flip angle = 85°, field-of-view (FOV) = 216 × 216mm, matrix = 72 × 72, and 3 × 3 × 3 mm voxels. 124 volumes were acquired in each run. Instructions were to lie still, remain awake, and keep eyes open.
Data for the template dataset came from three different sites in the Boston, MA area (two Trio Tim scanners at the Martinos Center for Biomedical Imaging, and one matched Trio Tim scanner at the Center for Brain Science at Harvard University), while the young test dataset and elderly test dataset were all collected on the same Trio Tim scanner at the Martinos Center for Biomedical Imaging.
Data processing
All resting state data were processed using SPM8 (http://www.fil.ion.ucl.ac.uk/spm/; version r4290). The first four volumes of each run were excluded to allow for T1 equilibration. Each run was slice-time corrected, realigned to the first volume of each run with INRIAlign (http://www-sop.inria.fr/epidaure/software/INRIAlign/; Freire and Mangin, 2001), normalized to the MNI 152 EPI template (Montreal Neurological Institute, Montreal, Canada), and smoothed with a 6 mm FWHM Gaussian kernel. Following these standard preprocessing steps, additional processing known to be beneficial for fc-MRI analysis was conducted. These included (sequentially, and in this order) (1) regression of realignment parameters (plus first derivatives) to reduce movement artifacts on connectivity and (2) temporal band-pass filtering (second order Butterworth filter) to focus the analysis on frequencies in the 0.01–0.08 Hz band. As an additional step, for seed based analyses only, we regressed out the average signal from white-matter, ventricles, and global signal (plus first derivatives; Fox et al., 2006; Van Dijk et al., 2010). Note that the order of operations was done in this manner to prevent the reintroduction of nuisance variance in the stop band frequencies (Hallquist et al., 2013). While white matter, ventricle, and global signal were regressed after band-pass filtering, the signals were taken from the band pass filtered data and so did not inadvertently reintroduce nuisance variance in the stop-band.
Template creation
The potential utility of TBR lies in the quality and applicability of the template set that is used. This means that the creation of the template set is an exceptionally important step, but also that this procedure can be done independently of the target dataset. This approach is predicated on the idea that functional network parcellations are sufficiently consistent and reproducible across subjects, populations, and time. Attempting to tackle the issue of what constitutes a “good” or “proper” parcellation is beyond the scope of this paper, and remains a major issue of discussion in fcMRI research. Even defining the basic set of regions or units for functional analysis is an extremely difficult and complex task (Wig et al., 2011, 2013). It is likely that there is no one true network parcellation, but rather that large scale, distributed functional networks represent statistical tendencies within a nested and likely fractal hierarchy (for an interesting example see Blumensath et al., 2013). However, consensus from multiple studies suggests that there is a relatively stable higher order set of connectivity patterns that are an appropriate description of at least one level of this functional connectivity hierarchy (e.g., the 10 task/rest matched networks from Smith et al., 2009 and the 7-network parcellation from Yeo et al., 2011). Based on current standard procedures for group ICA analyses (Calhoun et al., 2001, 2009; Beckmann et al., 2005) and assuming a need for at least twice as many components as cortical networks of interest (to allow for variance associated with noise, physiological, or subcortical sources to be segregated into components of non-interest), we set a target of 20 components for our parcellation, which is also the default number of components in the Group ICA fMRI Toolbox (GIFT; Calhoun et al., 2001) and the number used in prior large-scale studies (e.g., Biswal et al., 2010).
Input data for template creation were pre-processed as described above for non-seed based analysis. To create group level functional parcellations we performed a series of analytical steps analogous to the procedures implemented in the GIFT ICA toolbox and the Melodic toolbox from FSL (Jenkinson et al., 2012). This consisted of z-scoring the time-course in each voxel (variance normalization) followed by a spatial principal component analysis (PCA) for each functional run (note that the spatial PCA is defined as the eigenvectors obtained from a singular value decomposition on the spatial covariance matrix of each TR/volume to every other TR/volume). We retained the top 50 PCs per session, which were then stacked to create a data superset. A second, group-level, PCA was then performed on the stacked PCs, and the first 20 components from this group level PCA were then rotated with an orthomax rotation with row-based normalization to produce the template set (see Browne, 2001 for an overview of factor rotation algorithms). Row-based normalization is defined as:
where i corresponds to the rows, and j corresponds to the columns of the principal component matrix C. In words, each row of the principal components (i.e. each voxel) is scaled by the L2-norm for that row (the square-root of the summed squares). In practical terms, this means that each voxel is given equal weight in the subsequent rotation.
The factor scores for each component were written out to image files and served as the templates for the TBR procedure. Notably, the orthomax rotation was used to help maximize the spatial orthogonality of the templates in order to ensure that the template set met the basic assumptions of dual regression and to facilitate comparison between TBR and dual regression. Exploration of templates with lager numbers of components and more fine-grained sub-network parcellations were not undertaken, but remain an important area of future research.
Factor rotation vs. ICA
Both group ICA and the group level factor rotation that we employed are population level representations derived from pooled data across multiple subjects. The primary difference is in the use of ICA vs. factor rotation for un-mixing/uncovering the components/latent variables that best represent the variance of the pooled data.
Comparing the method employed in this paper to a standard group ICA analysis such as that performed in GIFT toolbox, the methods are nearly identical except for the final step of translating group level spatial principal components to group level independent components. In GIFT this is done with one of a number of ICA algorithms (most typically the infomax algorthim), whereas we performed this step via a factor rotation. The primary differences between these methods are in the source of the information used (i.e. 2nd vs. 4th statistical moments; variance vs. kurtosis), and in the assumptions of the component sources (ICA) vs. latent variables (factor rotation) that are being recovered. The largest of these assumptions is that ICA assumes non-Gaussian distributions as the sources whereas factor analysis assumes Gaussian distributions for the latent variables. The orthomax family of rotations in particular attempts to achieve “simple perfect structure” where each row of the factor matrix has at most 1 non-zero element, though in practice this is rarely achievable.
For directly comparing ICA to the orthomax rotation, we used the infomax ICA algorithm included in GIFT to unmix the group level principal components into 20 ICA components (these are the identical principal components used with the factor rotation). We then compared the spatial correlations between the spatial maps/templates obtained using the methods outlined in the paper (the orthomax rotation with row based normalization) to using the infomax ICA and found an average of 73% shared variance between the ICA derived templates and their best matching orthomax derived templates. This similarity can be improved further by z-scoring the spatial principal components prior to factor rotation and not employing row-based normalization, which resulted in an increase to 97% shared variance. The primary point is that choices related to how variance is scaled, and how variables are centered, guide the relative similarity or differences between the ICA and factor rotation approaches rather than the specifics of the algorithms themselves.
As with any data analysis procedure there are pros and cons to different analytic methodologies. We chose to use factor rotation due to greater familiarity with and access to factor rotation algorithms that provided us with greater understanding and control over the template creation procedure. Additionally we chose not to normalize the spatial components since the differing degrees of variance captured in the principal components is representative of the data in question (particularly given the use of variance normalization), and we chose to use row-based normalization in order to be agnostic as to the relative importance of any particular voxel. Other researchers may choose other approaches for a variety of reasons, and we make no claim as to the superiority of the methods we chose over others. Indeed, one of the benefits of the TBR procedure is that multiple template sets, created with different assumptions and optimizations, can be easily combined into a single coherent analysis. For example different incarnations of the DMN derived from different methods and/or normalization schemes can be pooled together in a single template set and can then be directly compared to one another.
Measurement
Seed-based connectivity analysis (SCA)
We extracted two sets of seed based measurements. First, to facilitate a direct methodological comparison seed locations were taken from the peaks of the template maps (see Table 1). Second, as an examination of using seeds gleaned from prior reports we utilized the seed set published in Brier et al. (2012), which was a compilation of seeds from a variety of previous publications for visual, motor, dorsal attention, control, salience, and default mode networks (also listed in Table 1). It should be noted that we did not include sub-cortical seeds such as the cerebellum, putamen, and thalamus, and we broke the somatosensory network into motor and visual networks. All seed regions were specified with 10-mm diameter spheres.
Table 1.
Seed locations used for seed-based correlation analysis. Template seeds were based on peaks from the 675 young subject templates (out-of-sample templates). Prior report seeds were sampled from previously published papers on fcMRI as assembled by Brier et al., 2012.
| Network | TBR template seeds
|
Seeds from prior report
|
||||
|---|---|---|---|---|---|---|
| MNI coordinates | MNI coordinates | |||||
| Motor | 2 | −19 | 59 | 1 | −18 | 49 |
| 56 | −13 | 44 | 41 | −22 | 48 | |
| −58 | −13 | 44 | −40 | −23 | 53 | |
| 62 | −7 | 23 | 62 | −24 | 13 | |
| −61 | −7 | 23 | −64 | −28 | 13 | |
| Default mode | 0 | −55 | 32 | 0 | −51 | 29 |
| 0 | 53 | −7 | 0 | 61 | 22 | |
| −49 | −64 | 35 | −48 | −66 | 34 | |
| 50 | −61 | 32 | 53 | −61 | 35 | |
| −64 | −16 | −19 | −65 | −22 | −9 | |
| 62 | −10 | −22 | 61 | −21 | −12 | |
| −25 | −19 | −22 | ||||
| 26 | −19 | −22 | ||||
| Salience | 5 | 11 | 47 | 10 | 34 | −6 |
| −37 | 41 | 32 | −13 | 34 | 16 | |
| 35 | 44 | 29 | 12 | 32 | 30 | |
| −34 | 17 | 8 | −42 | 6 | 4 | |
| 35 | 20 | 5 | 43 | 7 | 2 | |
| −64 | −31 | 32 | ||||
| 59 | −34 | 38 | ||||
| Language | −49 | 29 | −4 | |||
| 50 | 32 | −7 | ||||
| −55 | −34 | −4 | ||||
| 50 | −28 | −7 | ||||
| −61 | −52 | 11 | ||||
| 59 | −46 | 11 | ||||
| Dorsal attention | −58 | −25 | 41 | −29 | −5 | 55 |
| 56 | −25 | 44 | 31 | −5 | 54 | |
| 20 | −64 | 59 | −26 | −65 | 52 | |
| −19 | −64 | 56 | 28 | −65 | 51 | |
| −47 | −64 | −8 | −45 | −37 | 48 | |
| 50 | −61 | −10 | 43 | −36 | 46 | |
| −37 | −82 | 26 | −52 | −66 | −4 | |
| 32 | −73 | 32 | 55 | −62 | −7 | |
| Precuneus | −25 | 29 | 41 | |||
| 26 | 29 | 44 | ||||
| −37 | −79 | 38 | ||||
| 41 | −73 | 38 | ||||
| −16 | −61 | 23 | ||||
| 14 | −61 | 26 | ||||
| 5 | −67 | 44 | ||||
| Control | 2 | 29 | 47 | 1 | 30 | 44 |
| −43 | 47 | −1 | −45 | 50 | −5 | |
| −49 | 26 | 29 | −51 | −50 | 49 | |
| Left control | −58 | −52 | −13 | |||
| −34 | −61 | 47 | ||||
| 41 | 53 | −7 | 46 | 51 | −7 | |
| Right control | 50 | 35 | 26 | 53 | −49 | 47 |
| 59 | −46 | −10 | ||||
| 38 | −61 | 50 | ||||
| Extrastriate visual | 32 | −94 | 2 | 7 | −83 | 0 |
| −28 | −97 | 5 | −8 | −83 | 0 | |
For each network of interest we computed the Fisher-Z transformed correlation between each pair of seeds, and then averaged these pairwise measurements to create a single network coherence measure (see Hedden et al., 2009; Van Dijk et al., 2010 for a similar approach).
Global signal measurements were made by creating correlation maps with the global signal time-course obtained from the seed pre-processing step. The global connectivity measurements were made by averaging values within the same mask used for TBR and dual regression measurements (see Fig. 3 and the TBR and dual regression measurements section below). Similarly, white-matter connectivity measurements were made using correlation maps from the white matter time-course obtained from the seed pre-processing (after global signal had been regressed out), and the same white matter mask used for TBR and dual regression was used to extract white matter connectivity values. Finally seed-based measurements of primary visual areas were excluded due to the lack of spatial distinctiveness between peaks of connectivity.
Fig. 3.
Thresholded maps used to compute whole network measurements. These maps were created by taking the raw template maps and thresholding at factor loadings >100 (all with corresponding p-values much less than an alpha = 0.05 FWE correction). All values within these masked images were averaged to create the whole network metric for each template analyzed.
Dual regression (DR)
Following preprocessing, each run was z-scored in the time domain, followed by the dual regression procedure with three different template sets. These included (1) the 675 subject template set (out-of-sample); (2) the 140 young/old template set (in-sample); and (3) the out-of-sample template set with DMN nodal maps (see within network nodal decomposition section below for more details). Following the spatial regression the beta values were transposed, z-scored, and then entered into a multiple-regression analysis with the functional data. Beta values for each template time-course were then written out as connectivity maps. (See above for mathematical definitions of these procedures.)
Template based rotation (TBR)
TBR maps for the young and elderly test datasets were created by first performing the preprocessing steps for template creation outlined above Following this, each run for each subject was analyzed with the TBR procedure, using each of three different templates sets, (1) the 675 subject template set (out-of-sample); (2) the 140 young/old template set (in-sample); and (3) the out-of-sample template set with DMN nodal maps (see within network nodal decomposition section below for more details). The TBR procedure consisted of variance normalization in the time domain followed by demeaning in the spatial domain followed by a spatial PCA. A variable number of PCs was retained to ensure that a constant 90% of the original variance was retained. The truncated PCs were then mapped to the templates, and back-projected time-courses were recovered and then used independently to create correlation maps. (See above for mathematical definitions of these procedures.)
While it is possible to explicitly control for other templates by entering their corresponding time courses as covariates, the oblique nature of the Procrustes style mapping will typically result in a higher degree of collinearity than time-courses derived from dual regression. As such, entering all time-courses into a multiple regression analysis is not advised since the higher degree of collinearity can result in unstable beta estimates and consequently very noisy connectivity maps. While not reported investigations into entering all TBR time-courses into a single multiple regression analysis resulted in substantially altered connectivity measurements, and reduced measurement similarity with dual regression as compared to simple correlation maps for each TBR time course. As a consequence the default implementation of TBR is to regress each time-course independently to create a correlation map.
TBR and Dual-regression measurement
To simplify comparisons between methods across multiple networks, we computed a single metric for each template/network of interest. These metrics were computed by averaging all values within a mask defined by thresholding the corresponding out-of-sample template map at 100 (see Fig. 3). While the value of 100 is somewhat arbitrary, as are the factor loadings represented in the spatial templates, for each template map this value corresponds to a p-value well below the FWE corrected threshold for an alpha value of 0.05. While not reported, investigations with different thresholds ranging from 65 to 120 did not substantially alter the results. Averaging within the masks produced a single measurement for each subject, for each run, for each network of interest. Due to the anti-correlated pattern between DMN and salience networks, measurements for the DMN and salience network were made on the same template map, with the DMN mask defined as >100 and the salience network mask defined as <–100. The same procedure was used for making measurements on the in-sample template maps with a threshold of 43. The value of 43 was determined by calculating a scaling factor between the factor loading values of the in-sample and out-of-sample template sets and then performing a linear transform of the 100 threshold. Since all TBR maps were correlation maps, the values were Fisher-Z transformed before computing the average connectivity, whereas dual regression maps were left as raw beta weights.
Methodological assessments
Template reproducibility
To test if the 20 templates were reproducible, we ran the template creation procedure on three separate sub-groups of 100 young subjects from the template dataset (the GSP dataset).
Next, assuming that larger sample sizes would produce higher quality templates, we utilized all 675 subjects in the template dataset to create a set of master templates (later referred to as the out-of-sample templates or OST). This dataset totals 1350 six-minute scans for a total of 162,000 TRs, equaling 135 h of scan time across subjects.
Finally we repeated the same procedures for the 70 subjects from the young test dataset, the 70 subjects from the elderly test dataset, and the combined dataset of all 140 subjects from the young and elderly test datasets (later referred to as the in-sample templates or IST). These in-sample templates were then used to make comparisons between in-sample templates (IST) derived on the test datasets vs. out-of-sample templates (OST) derived from the template dataset as a way of validating the use of a priori templates.
To assess the reproducibility of the templates themselves (group level spatial patterns) we used spatial correlations (voxel-to-voxel correlations between spatial maps) to match templates and to measure the similarity of templates derived across three separate 100-subject subsets as compared to templates derived on the full set of 675 subjects. In order to establish the degree of specificity we also report the second strongest spatial correlation found for each template.
We also performed the spatial similarity analysis (computed as voxel-to-voxel Pearson’s r) comparing the in-sample templates (70 young only, 70 elderly only, and the combined set of 140) to the 675 subject out-of-sample template set.
Comparison of functional connectivity measurements
Given that there is no absolute standard to evaluate the performance of the different functional connectivity analysis methods, we took a pragmatic approach by making comparisons between young vs. old group differences and within session, across run reliability. Our assumption is that the method that provides more robust group differences and higher reliability is likely producing a better measurement. It should be noted that we used a template set that is very well suited to the orthogonality assumptions of dual regression (average spatial r2 across all templates = 0.015; peak r2 = 0.130 between primary visual (PriVis) and extrastriate visual (ExVis)), with the expectation that both techniques would produce similar results, and which serves as a validation of the TBR procedure relative to an established method.
Using the whole network measures we compared effect sizes of group differences (Cohen’s D) between young and old across multiple cortical networks including the default mode network (DMN), salience network (SAL), dorsal attention network (DAN), left control network (l-CRTL), right control network (r-CRTL), language network (Lang), precuneus network (Prec), motor (MOT), primary visual (PriVis), extrastriate visual (ExVis), white matter, and global. Cohen’s D is defined as the difference in means between groups divided by the pooled variance.
Alternatively Cohen’s D can be computed from a t-statistic as:
Conventionally a D of ≈0.2 is considered a small effect size, ≈0.5 is considered a medium effect size, and ≈0.8 is considered a large effect size (Cohen, 1988).
Then using the same whole network measures and the same set of cortical networks, we compared the within session reliability of the first and second runs for each subject. Due to the presence of group differences, intraclass correlation coefficients (ICC 2,1 from Shrout and Fleiss, 1979) were computed separately for young and old subjects.
Comparison of intra/inter network connectivity
Given the presence of left and right lateralized control networks in the template set, we evaluated the intra-network collinearity of the time courses obtained from TBR and dual regression for these two templates. As a secondary test, we also checked for the presence of group differences (young vs. old) in the degree of collinearity between left and right control networks.
Since the left and right lateralized control networks can be thought of as sub-networks of a bilateral frontoparietal control network, we also performed an inter-network connectivity analysis using two other prominent networks; the default mode network and the dorsal attention network. These networks were chosen since they represent stable large-scale networks and unlike the DMN/SAL were isolated in different components. The analysis again focuses on differences in collinearity between methods and between age groups. This test was performed under the assumption that the orthogonality of networks would be sensitive to age related changes in cortical connectivity.
To compute inter-template connectivity we measured the correlations between the time-courses recovered from TBR, dual regression, and the template based seed locations on a subject-by-subject basis. Measurements of time-course collinearity between left and right control networks (excluding the mid-line seed for the SCA metric), and between DMN and DAN networks were then evaluated for differential degrees of collinearity via a paired samples t-test, and young vs. old differences were evaluated with a between samples t-test.
Within network nodal decomposition
To highlight the potential flexibility and utility of TBR in terms of the removal of orthogonality assumptions, we took the DMN template, and split it into 8 separate maps by creating cluster images for the 8 primary nodes of the DMN (see Fig. 4). These 8 individual nodal cluster maps were then added as additional templates to the template set. This new template set was used with both TBR and dual regression to create a new set of connectivity maps.
Fig. 4.

Nodal decomposition of DMN. Each node, depicted with a different color, was written out as a separate template map and added to the 20-component template set in order to evaluate within network connectivity of the DMN. Red = posterior midline; blue = medial frontal; green/purple = left/right inferior parietal lobe (IPL), orange/peach = left/right lateral temporal; teal/yellow = left/right medial temporal lobe (MTL).
We first investigated how the inclusion of the nodal templates affected the measurement of the whole DMN component, and second, we examined the temporal collinearity between the whole DMN and the 8 nodal maps. Last, we looked for young vs. old group differences in the pattern of connectivity between the whole DMN and the individual nodal maps.
To address the question of how inclusion of the nodal templates affected the measurements we obtained the DMN connectivity measure for each method for the original template set and the template set with the nodal DMN components. We then compared the similarity of these metrics to gain a sense of how the connectivity measurements were altered by the inclusion of the nodal templates. To address the question of nodal connectivity we examined the correlations between each of the recovered time-courses from the 8 DMN nodes, and the whole DMN time-course.
Finally to address group differences we performed an ANOVA using age group as a between subject factor and DMN node as a repeated factor with the collinearity between individual nodes and the whole DMN as the dependent variable.
Results
The template set
Fig. 2 shows the full set of 20 templates computed on all 675 young subjects from the template dataset. We divided the templates into 5 categories: sensory networks, cortical association networks, physiological structures, sub-cortical networks, and artifact. The sensory networks consist of motor (Mot), primary visual (PriVis), and extrastriate visual (ExVis). The cortical association networks consist of the default mode network (DMN) with an anti-correlated salience network (SAL), a dorsal attention network (DAN), left and right lateralized frontal–parietal control networks (l-CRTL and r-CRTL), a language network (Lang), a precuneus/retrosplenial network (Prec; potentially analogous to a posterior DMN sub-network), and a frontal network (potentially analogous to an anterior DMN sub-network). Physiological structures included a whole brain component, as well as white matter, sagittal sinus, and the eyes. For subcortical structures there was a cerebellar grey, cerebellar white, and midbrain. We also observed three templates that appeared to be artifact, likely stemming from movement and/or signal dropout related to the nasal sinuses. Importantly, we show the templates in un-thresholded form to emphasize the importance of the whole brain patterns for both TBR and dual regression measurements, that is voxels near 0 and negatively correlated voxels have substantial influence on both TBR and dual regression methods. That is, in these methods, a network is defined as much by the spatial pattern of regions with weak associations as by regions with strong associations to the network.
Fig. 2.

Unthresholded template maps create from 675 young subjects (the out-of-sample templates — OST). The components are grouped into four categories: A. Primary sensory networks; B. Cortical association networks; C. Physiological components; D. Subcortical networks, and E. Artifact. This template set was used to compare measurements derived from TBR, DR, and SCA. Note, unthresholded maps reveal substantial spatial structure in the negatively weighted loadings (shown as dark areas), which are highly influential in both dual regression and TBR.
Reproducibility of whole brain parcellations across different datasets
To test reproducibility we created template sets from three independent subsets of the whole 675 subject sample, each consisting of independent random selections of 100 young subjects. We then used voxel-to-voxel spatial correlations to quantify the similarity between each of the three 100 subject template sets, as well as similarities to the template set derived from the entire 675 subject sample. As shown in Table 2, all template sets are highly similar for the major cortical networks of interest. Perhaps due to idiosyncratic noise contributions or the limitation in the number of templates, somewhat poorer fits were seen for the sub-cortical (r = 0.66) and the frontal networks (r = 0.68). Overall reproducibility was still very high, particularly for networks of interest such as motor (r = 0.99), visual (r = 0.99), default mode/salience (r = 0.99), dorsal attention (r = 0.96) and control networks (r = 0.98) as well as eyes (r = 0.98), white matter (r = 0.99), and whole brain (r > .99). All reported r values are much less than p = 0.001. The demonstrated reproducibility of the whole brain parcellations agrees well with previous studies (e.g., Biswal et al., 2010; Yeo et al., 2011), and supports the central argument that group level spatial network descriptions are highly stable and offer support for the use or a priori functional parcellations for the analysis of out of sample data.
Table 2.
Reproducibility of components as measured by spatial correlations between template sets. Three different template sets were created on independent sets of 100 subjects drawn at random from the full 675 subject set. The table shows the component with the best fit, as measured by spatial correlation, from each of the three 100 subject subsets with the component from the full 675 young subject set. We also show the fit for the component with the second best fit to aid interpretation of the uniqueness of the fits. Additionally, the correlations between the best-fit components from each of the 100 subject sets are also shown.
| Name | 675 set
|
Set #l
|
Set #2
|
Set #3
|
Comparison between 100 subject sets |
|||||||||
|---|---|---|---|---|---|---|---|---|---|---|---|---|---|---|
| Component | Average best fit |
Component | Best fit | Next best fit |
Component | Best fit | Next best fit |
Component | Best fit | Next best fit |
Set#l vs. set#2 |
Set#l vs set#2 |
Set#2 vs set#3 |
|
| Whole brain | C01 | 1.00 | C01 | 1 | 0.53 | C01 | 1 | 0.5 | C01 | 1 | 0.52 | 1 | 0.99 | 1 |
| Motor network | C03 | 0.99 | C03 | 0.99 | 0.31 | C03 | 0.99 | 0.36 | C03 | 0.99 | 0.32 | 0.98 | 0.98 | 0.98 |
| Default mode network | C02 | 0.99 | C02 | 0.99 | 0.25 | C02 | 0.99 | 0.23 | C02 | 0.99 | 0.27 | 0.98 | 0.98 | 0.97 |
| White matter | C05 | 0.99 | C05 | 0.99 | 0.26 | C05 | 0.99 | 0.2 | C05 | 0.99 | 0.23 | 0.98 | 0.98 | 0.97 |
| Primary visual | C04 | 0.99 | C04 | 0.99 | 0.39 | C04 | 0.98 | 0.27 | C15 | 0.99 | 0.44 | 0.97 | 0.98 | 0.96 |
| Edge/sinus artifact | C11 | 0.99 | C09 | 0.99 | 0.51 | C10 | 0.99 | 0.51 | C09 | 0.99 | 0.52 | 0.97 | 0.97 | 0.97 |
| Right control network | C12 | 0.98 | C12 | 0.98 | 0.33 | C12 | 0.98 | 0.35 | C12 | 0.98 | 0.33 | 0.96 | 0.97 | 0.96 |
| Left control network | C15 | 0.98 | C11 | 0.98 | 0.26 | C13 | 0.98 | 0.22 | C07 | 0.98 | 0.26 | 0.96 | 0.96 | 0.96 |
| Eyes | C08 | 0.98 | C08 | 0.97 | 0.14 | C09 | 0.99 | 0.13 | C08 | 0.98 | 0.16 | 0.95 | 0.95 | 0.96 |
| Edge/sinus artifact | C09 | 0.98 | C13 | 0.99 | 0.23 | C08 | 0.97 | 0.22 | C11 | 0.98 | 0.22 | 0.95 | 0.96 | 0.96 |
| Cerebellum | C10 | 0.97 | C10 | 0.97 | 0.16 | C14 | 0.97 | 0.21 | C10 | 0.96 | 0.23 | 0.94 | 0.93 | 0.93 |
| Dorsal attention | C06 | 0.96 | C06 | 0.97 | 0.34 | C06 | 0.96 | 0.38 | C06 | 0.96 | 0.31 | 0.95 | 0.97 | 0.94 |
| Extrastriate visual | C19 | 0.95 | C19 | 0.95 | 0.35 | C19 | 0.93 | 0.46 | C04 | 0.97 | 0.32 | 0.88 | 0.93 | 0.91 |
| Precuneus network | C07 | 0.92 | C07 | 0.95 | 0.28 | C07 | 0.86 | 0.3 | C19 | 0.95 | 0.26 | 0.84 | 0.93 | 0.86 |
| Cerebellar artifact | C14 | 0.91 | C17 | 0.84 | 0.36 | C16 | 0.95 | 0.23 | C17 | 0.93 | 0.23 | 0.76 | 0.86 | 0.88 |
| Language network | C13 | 0.89 | C15 | 0.93 | 0.22 | C17 | 0.79 | 0.46 | C14 | 0.95 | 0.24 | 0.64 | 0.92 | 0.65 |
| Nasal sinus artifact | C18 | 0.89 | C20 | 0.89 | 0.33 | C18 | 0.86 | 0.48 | C18 | 0.91 | 0.29 | 0.82 | 0.86 | 0.71 |
| Edge/sinus artifact | C16 | 0.83 | C18 | 0.61 | 0.45 | C15 | 0.94 | 0.2 | C16 | 0.95 | 0.17 | 0.56 | 0.5 | 0.9 |
| Frontal network | C20 | 0.68 | C14 | 0.6 | 0.49 | C11 | 0.85 | 0.28 | C13 | 0.58 | 0.43 | 0.84 | 0.92 | 0.84 |
| Sub-cortical | C17 | 0.66 | C16 | 0.62 | 0.59 | C20 | 0.67 | 0.41 | C13 | 0.68 | 0.55 | 0.42 | 0.16 | 0.16 |
In Table 3 we present the spatial correlations for the in-sample templates (IST) computed for the young subject test set (N = 70); the elderly subjects test set (N = 70); and the combined young and old template set, as compared to the out-of-sample templates (OST; computed on the full 675 young subject template dataset). Perhaps owing to differential data quality between young and old subjects and increased inter-network collinearity in elderly subjects (see inter- and intranetwork analyses below), the results show an expected but strong drop in the similarity between the old subject templates and the OSTs as compared to the 70 young subject OSTs. Overall, however, the ISTs computed across all 140 subjects in the test datasets were deemed of sufficient similarity (spatial r2 > 0.75) to the OSTs to allow for comparisons between all components with the exception of the dorsal attention and language networks (values in tables are listed as NA for DAN and Lang networks with ISTs). Notably, the inability to determine a usable dorsal attention and language network component from the group ICA-like process used to determine the ISTs demonstrates a common problem with comparison of different group ICA analyses; namely not all networks will be readily identifiable or of sufficient similarity in a given dataset to facilitate fair comparisons.
Table 3.
Spatial similarity as measured by spatial correlations of in-sample template sets (IST) vs. the out-of-sample template set (OST). The results show an expected better match between young subjects and the OST as compared to the old subject IST. Taken as a set, the 140 subjects from datasets 2 and 3 (both young and old) offer a good overall match to the 675 young subject templates (generally more than 75% shared variance) with the notable exceptions of the dorsal attention and the language networks.
| In-sample vs. out-of-sample template similarity
| |||
|---|---|---|---|
| Template | 70 young | 70 old | All l40 |
| DMN | 0.975 | 0.785 | 0.909 |
| VAN | 0.975 | 0.785 | 0.909 |
| DAN | 0.938 | 0.452 | 0.671 |
| Left control | 0.931 | 0.817 | 0.880 |
| Right control | 0.962 | 0.452 | 0.942 |
| Language | 0.421 | 0.425 | 0.548 |
| Precuneus | 0.912 | 0.748 | 0.795 |
| Motor | 0.974 | 0.854 | 0.941 |
| Primary visual | 0.981 | 0.871 | 0.972 |
| Extrastriate visual | 0.947 | 0.600 | 0.887 |
| White matter | 0.979 | 0.887 | 0.965 |
| Global signal | 0.994 | 0.973 | 0.990 |
Age group effect sizes
For analysis of effect size, we focus on a subset of the networks of particular interest. These include: motor (Component #3), primary visual (Component #4), extrastriate visual (Component #19), DMN (Component #2, positive), salience (Component #2, negative), DAN (Component #6), left control (Component #15), right control (Component #12), language (Component #13), precuneus (Component #7), white matter (Component #5), and global (Component #1). Table 4 reports effect sizes (Cohen’s D) as well as group means and SDs, for TBR and dual regression for both OSTs and ISTs. In addition, we report SCA results for both the template derived seeds and a set of previously published seeds assembled in Brier et al., 2012.
Table 4.
Young vs. old effect sizes across methods. Effect sizes (Cohen’s D) for multiple methods across both in-sample templates (IST) and out-of-sample templates (OST) sets. Conventionally D ≈ 0.2 is a small effect size, D ≈ .5 is a medium effect size and D ≈ .8 is a large effect size. Means (SDs) are also reported for each group and each metric. IST-DAN and IST-Language were excluded due to poor fits with the OST templates; NAs for prior report seeds reflect unspecified networks.
| Comparison of effect sizes
| |||||||
|---|---|---|---|---|---|---|---|
| Network | Measure | TBR-OST | TBR-IST | Dual-reg OST | Dual-reg IST | Template seeds | Prior report seeds |
| DMN | Effect size | d = 1.23 | d = 1.43 | d = 1.07 | d = 1.12 | d = 1.15 | d = 0.94 |
| Young — m(s) | 0.32 (0.06) | 0.36 (0.06) | 0.34 (0.06) | 0.36 (0.06) | 0.48 (0.13) | 0.51 (0.16) | |
| Old — m(s) | 0.24 (0.07) | 0.27 (0.07) | 0.27 (0.07) | 0.30 (0.06) | 0.34 (0.13) | 0.36 (0.16) | |
| VAN | Effect size | d = 1.20 | d = 0.80 | d = 1.33 | d = 1.15 | d = 1.08 | d = 0.21 |
| Young — m(s) | 0.27 (0.05) | 0.29 (0.06) | 0.31 (0.05) | 0.32 (0.06) | 0.48 (0.14) | 0.15 (0.08) | |
| Old — m(s) | 0.22 (0.05) | 0.25 (0.05) | 0.23 (0.06) | 0.26 (0.05) | 0.35 (0.11) | 0.14 (0.08) | |
| DAN | Effect size | d = 1.39 | NA | d = 1.60 | NA | d = 1.09 | d = 0.72 |
| Young — m(s) | 0.39 (0.07) | NA | 0.30 (0.05) | NA | 0.38 (0.11) | 0.39 (0.11) | |
| Old — m(s) | 0.30 (0.06) | NA | 0.22 (0.05) | NA | 0.27 (0.10) | 0.32 (0.10) | |
| Left control | Effect size | d = 1.14 | d = 0.98 | d = 1.02 | d = 0.80 | d = 0.76 | d = 0.72 |
| Young — m(s) | 0.36 (0.04) | 0.40 (0.04) | 0.33 (0.06) | 0.35 (0.06) | 0.42 (0.15) | 0.43 (0.17) | |
| Old — m(s) | 0.30 (0.05) | 0.37 (0.04) | 0.27 (0.06) | 0.30 (0.06) | 0.32 (0.14) | 0.32 (0.14) | |
| Right control | Effect size | d = 1.25 | d = 1.24 | d = 1.32 | d = 1.30 | d = 0.78 | d = 0.67 |
| Young — m(s) | 0.37 (0.05) | 0.42 (0.05) | 0.34 (0.06) | 0.38 (0.06) | 0.44 (0.15) | 0.43 (0.17) | |
| Old — m(s) | 0.31 (0.05) | 0.36 (0.06) | 0.26 (0.06) | 0.30 (0.06) | 0.32 (0.15) | 0.32 (0.17) | |
| Language | Effect Size | d = 1.10 | NA | d = 0.02 | NA | d = 1.16 | NA |
| Young — m(s) | 0.32 (0.04) | NA | 0.29 (0.04) | NA | 0.35 (0.11) | NA | |
| Old — m(s) | 0.27 (0.05) | NA | 0.29 (0.08) | NA | 0.23 (0.10) | NA | |
| Precuneus | Effect size | d = 0.59 | d = 0.45 | d = 0.45 | d = 0.05 | d = 0.28 | NA |
| Young — m(s) | 0.34 (0.05) | 0.32 (0.04) | 0.32 (0.04) | 0.35 (0.05) | 0.39 (0.12) | NA | |
| Old — m(s) | 0.31 (0.06) | 0.30 (0.05) | 0.30 (0.05) | 0.35 (0.08) | 0.36 (0.12) | NA | |
| Motor | Effect size | d = 0.52 | d = 0.22 | d = 0.48 | d = 0.17 | d = 0.30 | d = 0.16 |
| Young — m(s) | 0.39 (0.06) | 0.42 (0.06) | 0.37 (0.07) | 0.39 (0.07) | 0.61 (0.19) | 0.37 (0.15) | |
| Old — m(s) | 0.35 (0.07) | 0.41 (0.07) | 0.33 (0.09) | 0.38 (0.09) | 0.55 (0.24) | 0.35 (0.14) | |
| Primary visual | Effect size | d = 1.60 | d = 1.53 | d = 1.58 | d = 1.45 | NA | NA |
| Young — m(s) | 0.47 (0.05) | 0.49 (0.05) | 0.43 (0.06) | 0.45 (0.07) | NA | NA | |
| Old — m(s) | 0.40 (0.04) | 0.42 (0.04) | 0.33 (0.06) | 0.36 (0.05) | NA | NA | |
| Extrastriate visual | Effect size | d = 1.52 | d = 1.56 | d = 1.26 | d = 1.05 | d = 1.02 | d = 0.78 |
| Young — m(s) | 0.39 (0.05) | 0.36 (0.06) | 0.39 (0.06) | 0.40 (0.07) | 1.00 (0.27) | 0.98 (0.29) | |
| Old — m(s) | 0.31 (0.05) | 0.27 (0.06) | 0.31 (0.06) | 0.33 (0.07) | 0.72 (0.28) | 0.77 (0.23) | |
| White matter | Effect size | d = 0.77 | d = 0.48 | d = 0.40 | d = 0.54 | d = 0.61 | NA |
| Young — m(s) | 0.33 (0.06) | 0.34 (0.06) | 0.40 (0.06) | 0.41 (0.07) | 0.38 (0.09) | NA | |
| Old — m(s) | 0.29 (0.05) | 0.32 (0.05) | 0.37 (0.07) | 0.37 (0.07) | 0.33 (0.08) | NA | |
| Global signal | Effect size | d = 0.04 | d = 0.22 | d = 0.07 | d = 0.10 | d = 0.10 | NA |
| Young — m(s) | 0.49 (0.09) | 0.48 (0.08) | 0.53 (0.09) | 0.52 (0.10) | 0.65 (0.15) | NA | |
| Old — m(s) | 0.50 (0.11) | 0.50 (0.11) | 0.54 (0.12) | 0.53 (0.12) | 0.66 (0.18) | NA | |
First, out-of-sample templates tended towards modestly larger effect sizes than the in-sample-templates for both TBR and DR. The notable exception to this trend was the DMN, which showed an increase in Cohen’s D when using ISTs of 0.2 for TBR and 0.05 for dual regression as compared to OSTs.
When comparing TBR to dual regression we see approximate equivalence between the methods, with TBR showing slightly larger effects for DMN, left control, language, precuneus, motor, both visual networks, and white matter, while dual regression returned slightly larger effects for SAL, DAN, and right control. With the exception of the language network, the differences in Cohen’s D were generally less than 0.2, and we interpret this pattern as rough equivalence in the ability to detect age differences across these two methods (a one-tailed t-test for this sample size with a Cohen’s D of 0.2 would correspond to a non-significant p-value of 0.12).
While SCA showed a similar pattern of significant differences in age across multiple networks, both TBR and dual regression consistently outperformed SCA in terms of effect size. Additionally, we observed that the seed locations derived from the 675 young subject templates performed better than seeds based on prior reports, though again the overall pattern of group differences was similar. Lastly, while some decreased connectivity in older individuals is observed across nearly all of the resting state networks examined, the differential effect sizes observed across networks suggest there may be differential susceptibility to age-related connectivity decreases in certain networks (e.g., control vs. visual networks).
Reliability
Turning to within-session, across-run measurement reliability, Table 5 shows that the out-of-sample templates (OSTs) performed slightly better than the in-sample templates (ISTs), as evidenced by a small-but-consistent improvement in reliabilities. Observed intraclass correlation coefficients (ICCs) were approximately equivalent between TBR (average ICC across templates/networks of 0.584), dual regression (average ICC across templates of 0.576), and template seeds (average ICC across templates of 0.581) and all of these performed better than prior report seeds (average ICC across templates of 0.473).
Table 5.
Comparison of within session reliability across methods and template sets using ICC2,1 (Shrout and Fleiss, 1979). Due to the presence of group differences ICCs were computed separately for young and old subject groups. The pattern of results reveals approximate equivalence across methods with a slight advantage for out-of-sample templates (OST) relative to in-sample templates (IST). IST-DAN and IST-Language were excluded due to poor fits with the OST templates; NAs for prior report seeds reflect unspecified networks.
| Comparison of within session reliability
| |||||||
|---|---|---|---|---|---|---|---|
| Network | Measure | TBR-OST | TBR-IST | Dual-reg-OST | Dual-reg-IST | Template seeds | Prior report seeds |
| DMN | Young ICC | 0.65 | 0.6 | 0.56 | 0.47 | 0.46 | 0.59 |
| Old ICC | 0.83 | 0.77 | 0.76 | 0.59 | 0.7 | 0.75 | |
| VAN | Young ICC | 0.62 | 0.62 | 0.53 | 0.48 | 0.62 | 0.14 |
| Old ICC | 0.56 | 0.56 | 0.74 | 0.47 | 0.36 | 0.32 | |
| DAN | Young ICC | 0.50 | NA | 0.47 | NA | 0.41 | 0.47 |
| Old ICC | 0.55 | NA | 0.31 | NA | 0.48 | 0.46 | |
| Left control | Young ICC | 0.63 | 0.49 | 0.62 | 0.53 | 0.65 | 0.43 |
| Old ICC | 0.67 | 0.51 | 0.61 | 0.66 | 0.68 | 0.43 | |
| Right control | Young ICC | 0.54 | 0.54 | 0.64 | 0.6 | 0.63 | 0.46 |
| Old ICC | 0.66 | 0.67 | 0.68 | 0.66 | 0.68 | 0.55 | |
| Language | Young ICC | 0.33 | NA | 0.23 | NA | 0.52 | NA |
| Old ICC | 0.64 | NA | 0.66 | NA | 0.46 | NA | |
| Precuneus | Young ICC | 0.47 | 0.47 | 0.35 | 0.3 | 0.56 | NA |
| Old ICC | 0.55 | 0.68 | 0.41 | 0.7 | 0.43 | NA | |
| Motor | Young ICC | 0.45 | 0.47 | 0.45 | 0.52 | 0.6 | 0.47 |
| Old ICC | 0.73 | 0.69 | 0.76 | 0.75 | 0.73 | 0.58 | |
| Primary visual | Young ICC | 0.53 | 0.51 | 0.5 | 0.51 | 0.54 | NA |
| Old ICC | 0.46 | 0.42 | 0.51 | 0.44 | 0.46 | NA | |
| Extrastriate visual | Young ICC | 0.53 | 0.52 | 0.52 | 0.58 | 0.58 | 0.56 |
| Old ICC | 0.49 | 0.47 | 0.51 | 0.4 | 0.52 | 0.41 | |
| White matter | Young ICC | 0.69 | 0.69 | 0.72 | 0.69 | 0.63 | NA |
| Old ICC | 0.65 | 0.69 | 0.72 | 0.75 | 0.63 | NA | |
| Global signal | Young ICC | 0.72 | 0.72 | 0.74 | 0.73 | 0.71 | NA |
| Old ICC | 0.8 | 0.79 | 0.76 | 0.76 | 0.74 | NA | |
All three methods performed about equally when looking at physiological templates such as global and white matter. TBR and dual regression performed better for the main cortical association networks (DMN, VAN, DAN, and CRTL networks) whereas template seeds tended to perform better for sensory networks such as extrastriate visual and motor as well as second order cortical networks such as precuneus and language, though on the whole these differences were relatively small.
Notably, across all three methods, reliabilities of functional connectivity measurements had a rather large spread across networks. For TBR the ICC values ranged from a high of 0.82 for the DMN in old subjects, to a low of 0.33 in the language network for young subjects. For dual regression the peak ICC value was 0.76 for both the DMN and the global component in old subjects to a low of 0.23 in young subjects in the language network. For template seeds the range was from a high of 0.74 for the global template in old subjects to a low of 0.36 for the VAN in old subjects.
Between TBR and DR, networks that showed higher or lower reliability using one analytic technique showed a similar pattern using the other technique (e.g., the language network showed similarly poor ICCs using TBR and DR, whereas the DMN showed relatively high ICCs using TBR, DR, and SCA).
Measurement similarity
To help address the issue of which method (TBR vs. DR) was better suited for use with OSTs, we examined the shared variance between the measurements obtained from different methods and different template sets (Table 6). When comparing the shared variance between template sets but within methods (first two columns of Table 6) we see that TBR has consistently higher measurement similarity (88% shared variance on average) across template sets than dual regression (77% shared variance on average). When comparing across TBR and dual regression using out-of-sample templates, the two methods shared 67% variance with the dorsal attention network included and 72% excluding the dorsal attention network, which is a clear indication that both these techniques are honing on the same variance. Comparisons between TBR-IST vs. DR-IST also show a strong degree of collinearity with an average of 65% shared variance (excluding the DAN and Lang) and we observe the sharpest drop in measurement similarity for DMN (85.4% shared variance for OST; 64.2% shared variance for IST) and VAN (82.2% shared variance for OST; 68.2% shared variance for IST).
Table 6.
Comparison of whole network measurement similarity across methods (TBR and DR) using in-sample templates (IST) and out-of-sample templates (OST). The comparison reveals a high degree of similarity in the measurements obtained across methods and templates sets. Greater similarity across template sets was observed with TBR than with DR. With the exception of the dorsal attention network, measurements from both TBR and dual regression are highly collinear for the OST and we observe a general decrease in collinearity with the IST particularly in association cortex. Comparisons between OST and IST for DAN, and language networks were excluded due to poor fits between the OST and IST template sets for these networks.
| Measurement correlations with 95% confidence interval
| ||||
|---|---|---|---|---|
| TBR-OST vs. TBR-IST | DR-OST vs. DR-IST | TBR-OST vs. DR-OST | TBR-IST vs. DR-IST | |
| DMN | 0.974 ± 0.038 | 0.827 ± 0.095 | 0.947 ± 0.054 | 0.825 ± 0.095 |
| VAN | 0.890 ± 0.077 | 0.781 ± 0.105 | 0.931 ± 0.062 | 0.846 ± 0.090 |
| DAN | NA | NA | 0.111 ± 0.167 | NA |
| Left control | 0.910 ± 0.070 | 0.899 ± 0.074 | 0.869 ± 0.083 | 0.700 ± 0.120 |
| Right control | 0.977 ± 0.036 | 0.949 ± 0.053 | 0.849 ± 0.089 | 0.813 ± 0.098 |
| Language | NA | NA | 0.849 ± 0.089 | NA |
| Precuneus | 0.840 ± 0.091 | 0.678 ± 0.124 | 0.797 ± 0.102 | 0.708 ± 0.119 |
| Motor | 0.956 ± 0.049 | 0.913 ± 0.069 | 0.900 ± 0.073 | 0.860 ± 0.086 |
| Primary visual | 0.993 ± 0.020 | 0.955 ± 0.050 | 0.847 ± 0.089 | 0.861 ± 0.086 |
| Extrastriate visual | 0.936 ± 0.059 | 0.890 ± 0.077 | 0.822 ± 0.096 | 0.792 ± 0.103 |
| White matter | 0.969 ± 0.042 | 0.976 ± 0.037 | 0.802 ± 0.101 | 0.892 ± 0.076 |
| Global signal | 0.993 ± 0.019 | 0.997 ± 0.014 | 0.973 ± 0.039 | 0.966 ± 0.044 |
Lateralized control networks
The left and right portions of the control network appeared as two separate lateralized components in our template set, and thus offered an in-built opportunity for comparing how TBR, DR, and SCA can be used to assess inter-network correlations. Given the preceding orthogonality discussion, we expected that TBR would retain some collinearity between left and right control networks, whereas dual regression would hone on largely orthogonal time-courses between the left and right control network templates. As a result, we expected that TBR would better be able to recognize the inter-network correlations between these highly related networks.
To compare TBR to dual regression we first investigated the degree of collinearity between the estimated left and right control network time-courses computed for each session. For dual regression the average correlation between left and right control network time-courses was 0.045 (one sample t-test: t(139) = 2.81; p = 0.006) whereas for TBR the average correlation between time-courses was r = 0.41 (one sample t-test: t(139) = 45.38; p < 0.001), a paired samples t-test showed this difference to be significant (t(278) = 19.71 p < 0.001), and the difference between methods showed the expected result of greater collinearity with the TBR method.
Next we asked if we could detect differences in the collinearity of left and right control networks between age groups. We found significant effects for both dual regression (Young = 0.01; Old = 0.08; t(138) = 2.06, p = 0.04) and TBR (Young = 0.35; Old = 0.46; t(138) = 7.13, p < 0.001) with the direction of the effect indicating greater collinearity in the elderly subject group as compared to the young, with greatly increased statistical power for the TBR method. Seed-based methods showed a marginal effect of age (Young = 0.32; Old = 0.29; t(138) = 1.95, p = 0.054), with the pattern of means showing greater collinearity in the young as compared to the old.
Inter-network connectivity
Following a similar line of reasoning as above we asked if we could also detect differences in the collinearity between non-hemispheric homologues. For this analysis we examined collinearity between the DMN and the DAN, and again looked for differences between the age groups. For dual regression we found no significant difference (Young = 0.05; Old = 0.09 t(138) = 1.45, p = 0.15) and for TBR we again found a significant difference (Young = 0.30; Old = 0.37; t(138) = 5.11; p < 0.001) with the effect showing increased collinearity in the elderly group. Seed based methods again showed a marginal effect (Young = 0.17; Old = 0.12; t(138) = 3.61, p < 0.001) with the pattern of means going in the opposite direction showing greater collinearity in young subjects than in old.
Default mode network decomposition
Finally, we demonstrated that relaxing the orthogonality constraints of dual regression allows for greater flexibility in using network descriptions that contain a high degree of spatial overlap via a within network analysis of the DMN. We generated both TBR and dual regression maps using a modified OST set that included the same 20 templates as used previously plus 8 additional templates that were created by writing out separate cluster maps for each of the 8 primary nodes of the DMN template (see Fig. 4). These consisted of medial frontal, posterior midline, left IPL and right IPL, left and right lateral temporal nodes, and left and right medial temporal nodes. As the inclusion of these 8 new DMN-node templates in an analysis along with the original DMN template from which they were derived constitutes a direct violation the orthogonality assumption of dual regression, this analysis allows us to demonstrate the flexibility of TBR to investigate within network connectivity and its ability to handle templates with high spatial overlap.
First we addressed how the inclusion of these additional templates affected the whole network DMN connectivity values. Starting with dual regression we found that the whole network DMN measures with and without the extra DMN components shared 86% variance, demonstrating that the inclusion of the non-orthogonal node components led to a minor but still altered estimation of total DMN connectivity. In contrast, TBR DMN measurements with and without the separate DMN components were identical, reflecting the tolerance of TBR for the inclusion of non-orthogonal network descriptions.
Next, we investigated whether the decreased DMN connectivity in young vs. old subjects was driven by alterations in the contribution of individual nodes within the DMN as compared to overall DMN connectivity. To enable the investigation of regionally specific differences between young and old subjects, we correlated each of the time-courses from the 8 DMN node templates with the time-course from the whole DMN template. We then performed a node by age-group mixed design ANOVA to test for differential patterns/contributions across the nodes of the DMN.
The results shown in Fig. 5 demonstrate that the TBR time-courses retained the expected collinearity between nodal regions and the network as a whole. Using TBR, we found a significant group by node interaction (F(7,966) = 2.76, p = 0.008) suggesting that the contribution of individual nodes to the DMN is altered in older subjects. An exploration of the TBR results reveals that the interaction is driven by group differences in the mPFC t(138) = 2.83; p = 0.02, and the left MTL t(138) = 1.92, p = 0.057. For both of these comparisons, young subjects showed higher connectivity than elderly subjects. When compared to the overall DMN connectivity effect (t(138) = 7.06, p < 0.001) it is clear that differences in nodal contribution between young and old subjects, while significant, are fairly small compared to the overall decrease in DMN connectivity in older subjects. Taken together, this suggests that decreased DMN connectivity is primarily a network wide (rather than regional) effect, though there is some selective evidence to suggest that certain nodes (e.g., mPFC and left MTL) may show increased vulnerability to age-related change.
Fig. 5.
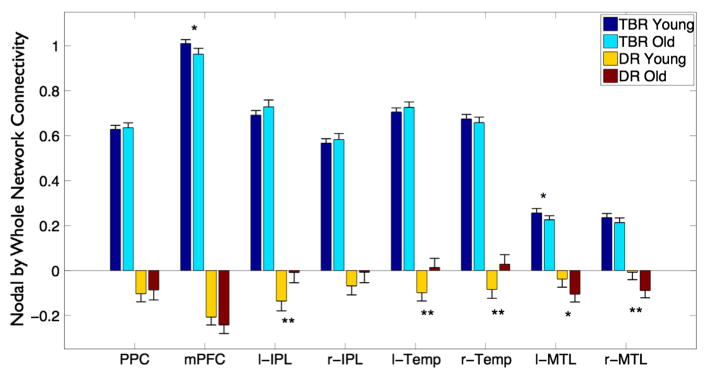
Comparison of correlation strength between individual nodes of the DMN and the DMN network as a whole as determined by TBR and dual regression. The figure shows that time-courses recovered by TBR retain the expected collinearity with DMN network signal; that is the nodes of the DMN correlate with the DMN as a whole. Meanwhile, dual regression estimates tend to be weak, negative, and are reflective of the nodal connectivity with the DMN after controlling for the DMN, which is difficult to interpret because of the violation of dual regression’s orthogonality assumptions. TBR shows a highly similar nodal connectivity profile between young and old subjects with small but significant effects in the left medial temporal and medial pre-frontal regions.
In contrast, correlations between dual regression time-courses tend to be both very weak and negative, and represent the residual signal assigned to an individual DMN node after controlling for the whole DMN and the other individual DMN nodes. This last aspect represents a direct violation of the orthogonality assumptions inherent in dual regression. Though statistically significant, the weakly negative connectivity values generated in this situation by dual regression are very difficult to interpret, and are potentially artifactual in the same manner that global signal regression can induce significant negative correlations (Strother et al., 1995; Andersson, 1997; Murphy et al., 2009; Fox et al., 2009). This should be considered a feature of dual regression, as it requires that nodes or networks being probed be orthogonal to one another, thereby modeling only the unique relationships of orthogonal nodes. In contrast, TBR allows the simultaneous investigation of spatially overlapping nodes and networks, which is advantageous for examining the relationships among nodes within a network, which are likely to be correlated with one another.
Discussion
For comparison of functional connectivity analyses across clinical groups and over time, it is preferable to use network descriptions that are derived out-of-sample, and thus not influenced by the characteristics of the experimental population. This is especially the case in clinical trials settings where outcome measures must be explicitly and exactly defined in advance. This constraint largely precludes the use of group ICA since the group level templates are unknown and/or incomplete until data collection is complete, whereas out-of-sample a priori templates offer both an explicit outcome and a way to perform interim analyses. There are also large potential benefits for observational designs where the number of subjects within groups of interest (e.g. preclinical AD and healthy controls) is often unbalanced, and where both the connectivity strength and the spatial pattern of connectivity may vary between groups. Even in controlled experimental designs, where experimental manipulation and careful matching of subject characteristics are chosen over large sample sizes, there remain substantial benefits in using stable network descriptions derived from very large datasets as opposed to templates derived from small study-specific samples in which subjects vary over experimental conditions. Utilization of a priori information regarding functional networks is already regarded as important by the field as evidenced by critiques of circularity when seed locations are defined on the test data rather than defined out-of-sample, since any definition derived on the data in question is likely to lead to bias, and reduced reproducibility.
The central thesis of this report is that out-of-sample, a priori templates are useful and informative for many applications in the analysis of functional connectivity data. We demonstrate that TBR is a powerful and flexible tool to perform this type of analysis and has several potential advantages compared to SCA and dual regression. We show that out-of-sample templates can be effectively utilized to analyze and make inferences about new datasets and new populations, and we show that using out-of-sample template sets can actually improve the statistical power of the results, suggesting that template quality is as important a consideration as how accurately the templates describe a particular subject or population.
Additionally, we demonstrate that when using templates well suited to dual regression, TBR and dual regression perform approximately equally (with a tendency for a slight but non-significant advantage for TBR), and that both perform better than standard SCA methods. Lastly, we demonstrate that TBR provides a flexible method to explore connectivity data, allowing for a range of inter- and intra-network analyses that benefit from retaining shared temporal and spatial variance between components. Taken together, we argue that TBR, combined with out-of-sample templates, represents a promising approach for the standardization of functional connectivity analyses by harmonizing the functional network descriptions across diverse subject populations and disease states.
The move to using a priori template sets can be compared to the use of MR templates for spatial normalization. For spatial normalization we have a need for a common Euclidian space to standardize the spatial locations of activity patterns associated with different subjects or groups. Here we propose to extend such standardization to what are essentially covariance templates to facilitate evaluation across subjects or groups by placing them into a common covariance space. It remains important to recognize that there are still questions regarding the appropriateness and applicability of templates to certain target populations (as it is with picking a reference space for spatial normalization). We expect that just like certain populations show very strong benefits for using customized spatial templates for spatial normalization, there will be populations that benefit from the creation and use of customized functional connectivity templates. To extend the analogy further, there is also a promise that, given sufficient data, it may be possible to create stable single subject covariance parcellations that could be used in a manner akin to detailed single subject structural parcellations (a la Freesurfer) where comparisons are made between matched covariance structures at the individual level as opposed to predefined spatial areas in Euclidean space.
Another important point is that the overall pattern of network connectivity differences which we observed when comparing young and elderly subjects were quite similar whether SCA, DR, or TBR method was used. This similarity confirms that all three methods are picking up on the same sources of variance and lends confidence to the measures obtained from all of these methods. Similarly, the overall pattern of network connectivity differences we observed was similar whether in- or out-of-sample derived templates or seeds were used, again suggesting that analytic choices can be tailored to the idiosyncrasies of the question and dataset without fundamentally altering the overall result. As an example, one could imagine that small datasets or those with very unequal numbers across groups or disease states may benefit from the use of out-of-sample templates as it is less likely that the parcellation of such a dataset (using factor analysis or ICA) would lead to a stable and complete set of cortical network components. Additionally, a conserved set of out-of-sample network templates is advantageous when analyzing datasets still under active collection, as the introduction of new data would alter the in-sample network parcellations. These latter concerns are particularly important where there is a need for interim analyses, where unbalanced numbers of subjects across groups of interest may lead to biased in-sample network descriptions, and where potential cohort effects may cause early in-sample parcellations to differ from later in-sample parcellations.
Going forward, implementation of out-of-sample derived templates (whether by dual regression or TBR) would benefit from a more certain understanding of what constitutes a proper functional parcellation, and to what degree functional network descriptions are transferable across populations. Multiple research papers (see introduction) have demonstrated that resting state connectivity networks are largely stable across populations and across time. We reiterate that our goal in the present report is to introduce the TBR method and demonstrate the viability of using out-of-sample templates, rather than to advocate for a particular template set. We believe that the 20 component 675-subject template set is a reasonable description of large scale distributed functional networks and accords well with previous reports (including anti-correlations between DMN and SAL), however we make no particular claim regarding the superiority of this template set relative to what has been, or may be, produced in the future. This is not to say that the 20 component 675-young subject templates are ideally suited to all situations, rather we mean to imply that this set appears to correspond to a large-scale organization of the brain that is roughly in-line with other large-scale connectivity parcellations and is likely to provide meaningful functional connectivity measures given our current state of knowledge. The flexibility of TBR to utilize multiple template sets may provide opportunities for dissociating different groups and different pathological states; for example differential fits between young, old, and impaired templates may provide crucial information related to concepts such as biological age, brain reserve, and even fine grain temporal staging of the location of individuals on a pathological cascade. Understanding the functional organization of the human brain is an ongoing endeavor, and a benefit of the TBR procedure is the ability to easily utilize new information and new parcellations as they become available. It is also unknown if different subject populations present a fundamentally different functional organization or if these potential differences are simply an issue of data quality, and possibly inter-network connectivity, confounding the group level functional parcellations. Given the evidence presented above regarding the differential degrees of network collinearity between young and old subjects, we believe the difference has more to do with data quality and the manner in which networks share information rather than a fundamentally different functional architecture. This is especially true since robust and coherent networks are still recoverable in elderly subjects using young subject parcellations. However, a great deal of work remains to fully explicate this in terms of both true functional organization and the pragmatics of utilizing out-of-sample templates across varied populations.
We should also note that TBR measures for a particular network could be controlled for the behavior of other networks or templates, similar to what is commonly done in dual regression analysis. In the present report the method employed was simply to create a correlation map for each recovered time-course that is agnostic to the behavior of other recovered time-courses. Though we do not explore this in the present report, it may be the case that selectively controlling for sources of noise and/or for other network signal may lead to improved measurement. Additionally, taking advantage of the ability to engineer custom templates without worry of violating dual regression orthogonality constraints, one could imagine customizing network templates that split templates into separate positive and negative components to better separate (or control for) changes in correlation and anti-correlation strength. This leads to another important consideration that is frequently not addressed with dual regression, namely that dual regression measurements are sensitive to the full template makeup and not just the components of interest. When attempting to reproduce a previously published report using DR, using an identical single network description is not sufficient to reproduce the result. Exact replication requires the full set of networks used in the initial analysis, as the fcMRI measure for the network of interest is at least partially dependent on the other components in the template set. This is especially problematic when the change in connectivity is subtle or dependent on altered collinearity between networks. In contrast, TBR measurements for a given template depend only on the specific template in question, meaning the results for a particular network of interest will be identical regardless of what other components are included in the template set. As stated earlier, other templates can optionally be controlled for, but this option must be explicitly performed and subsequently reported.
Another future direction for exploration is the degree to which more or less preprocessing would affect results. For example if there are known sources of nuisance variance such as CSF signal, these could be removed prior to the TBR mapping procedure. Since the TBR method can implicitly control for nuisance variance insofar as the template in question is a good representation independent of nuisance variance, it may also be the case that preprocessing such as motion regression and filtering may not be strictly necessary and would further reduce the assumptions and data processing required to utilize the TBR method.
The major drawback to TBR is that the results are only as good as the templates and the appropriateness of the templates to specific populations and specific research question. To what extent this is an issue which remains an open question. Other recent methodological enhancements to group ICA approaches such as iterative approaches to dual regression (Kim et al., 2012) and group information guided ICA (GIG-ICA; Du and Fan, 2013) have sought to address the issue of utilizing group information to constrain the analysis of individual subjects in order to simultaneously achieve parsimony with group level components and maximal fidelity to the true patterns in individual subjects. Such methods may provide potential avenues of methodological enhancement that could either be incorporated with or used in conjunction with TBR to help address potential concerns of template bias, and the appropriateness of a specific template sets to specific populations. However we suspect that there will never be a one-size fits all template set; rather the nature of the templates and how they are defined will be heavily influenced by the nature of the research question.
In terms of what has actually been tested, the current report focuses on a dataset of identical functional acquisitions. Even granting that a particular template set is a good representation for a particular use case, it remains to be seen how well templates translate across different scanners, acquisition parameters and field strengths. For instance it may be the case that switching from data acquired in the axial plane to data acquired in the coronal plane would necessitate a new template set. It is also likely that switching field strengths would necessitate separate templates. This will be crucial for the use of a priori templates in large-scale clinical trials and research studies where potentially hundreds of sites, multiple MR manufacturers and multiple MR models will be employed. Ideally template sets will be created that offer mixtures of acquisitions, scanners, and populations to make the template sets more broadly applicable. On the whole we expect templates to perform better than seeds across acquisitions and populations due to the ability of TBR and dual regression to leverage large scale patterns that are likely more robust to slight anatomic mismatches than small spherical seed regions, but this remains to be demonstrated.
Better neuroimaging tools are imperative for accelerating the development of pharmacological interventions for neurodegenerative diseases, as well as the tracking and evaluation of neurodegenerative processes. Especially as we begin to integrate functional connectivity MRI as a secondary endpoint in clinical trials (Sperling et al., 2011; Reiman et al., 2011; Mills et al., 2013), it is highly attractive to move toward a comprehensive set of network descriptions that can be easily carried forward, compared across samples, and that can be used on datasets where scans are still being acquired. Additionally, building on the intriguing observation that neurodegenerative changes in functional connectivity may be most obvious in the connectivity between networks (Brier et al., 2012), it may be advantageous to have an analytic method that flexibly allows for inter- and intra-network analyses while maintaining a high degree of statistical power and reproducibility.
TBR provides similar results and functionality as DR, but does so with greatly reduced assumptions regarding the spatiotemporal structure of the brain’s functional architecture and simultaneously makes possible template customizations and new classes of inter-, intra-, and subnetwork analysis that were previously only possible with SCA style analysis. That is, TBR combines the flexibility and interpretability of SCA with the robustness of group ICA and dual regression. We hope that the TBR method will facilitate the use of out of sample templates and prove to be a valuable addition to our quiver of analytic tools for clinical trials.
Supplementary Material
Acknowledgments
Funding
Data collection and investigator support for this project were provided by NIA S10 RR022976, S10 RR019933, P01 AG036694, P50 AG005134, R01 AG027435, R01 AG034556, K24 AG035007, and K01 AG040197. Data collection and imaging resources at the Martinos Center for Biomedical Imaging greatly benefit from the support of NCRR grant P41 RR14075. Additional investigator support was provided by the BrightFocus Foundation, the American Brain Foundation, and the American Academy of Neurology (JPC). We extend special thanks to Dr. Randy Buckner for sharing the Harvard GSP dataset of young subjects with us and for his insightful input on this project. We also tha0000nk all the collaborators and contributors to the Harvard Aging Brain Study (http://www.martinos.org/harvardagingbrain/Acknowledgements.html). Lastly, we are grateful to our research participants for their altruism and willingness to take part in our studies.
Appendix A. Supplementary data
Supplementary data to this article can be found online at http://dx.doi.org/10.1016/j.neuroimage.2014.08.022.
Footnotes
Research reported in this publication was supported by the National Institute On Aging of the National Institutes of Health. The content is solely the responsibility of the authors and does not necessarily represent the official views of the National Institutes of Health.
TBR MATLAB source code and template maps are available at: http://mrtools.mgh.harvard.edu/index.php/TBR.
References
- Andersson JL. How to estimate global activity independent of changes in local activity. NeuroImage. 1997;6 (4):237–244. doi: 10.1006/nimg.1997.0302. [DOI] [PubMed] [Google Scholar]
- Beckmann CF, Smith SM, DeLuca M, Devlin JT. Investigations into resting-state connectivity using independent component analysis. Phil Trans R Soc B Biol Sci. 2005;360 (1457):1001–1013. doi: 10.1098/rstb.2005.1634. [DOI] [PMC free article] [PubMed] [Google Scholar]
- Beckmann CF, Mackay CE, Filippini N, Smith SM. Group Comparison of Resting-State FMRI Data Using Multi-Subject ICA and Dual Regression. OHBM 2009 [Google Scholar]
- Biswal BB, Yetkin FZ, Haughton VM, Hyde JS. Functional connectivity in the motor cortex of resting human brain using echo-planar MRI. Magn Reson Med. 1995;34 (4):537–541. doi: 10.1002/mrm.1910340409. [DOI] [PubMed] [Google Scholar]
- Biswal BB, Mennes M, Zuo XN, Gohel S, Kelly C, Smith SM, Milham MP. Toward discovery science of human brain function. PNAS. 2010;107 (10):4734–4739. doi: 10.1073/pnas.0911855107. [DOI] [PMC free article] [PubMed] [Google Scholar]
- Blumensath T, Jbabdi S, Glasser MF, Van Essen DC, Ugurbil K, Behrens TEJ, Smith SM. Spatially constrained hierarchical parcellation of the brain with resting-state fMRI. NeuroImage. 2013;76:313–324. doi: 10.1016/j.neuroimage.2013.03.024. [DOI] [PMC free article] [PubMed] [Google Scholar]
- Brier MR, Thomas JB, Snyder AZ, Benzinger TL, Zhang D, Raichle ME, Ances BM. Loss of intranetwork and internetwork resting state functional connections with Alzheimer’s disease progression. J Neurosci. 2012;32 (26):8890–8899. doi: 10.1523/JNEUROSCI.5698-11.2012. [DOI] [PMC free article] [PubMed] [Google Scholar]
- Browne MW. An overview of analytic rotation in exploratory factor analysis. Multivar Behav Res. 2001;36 (1):111–150. [Google Scholar]
- Bullmore E, Sporns O. Complex brain networks: graph theoretical analysis of structural and functional systems. Nat Rev Neurosci. 2009;10:186–198. doi: 10.1038/nrn2575. [DOI] [PubMed] [Google Scholar]
- Calhoun VD, Adali T, Pearlson GD, Pekar JJ. A method for making group inferences from functional MRI data using independent component analysis. Hum Brain Mapp. 2001;14 (3):140–151. doi: 10.1002/hbm.1048. [DOI] [PMC free article] [PubMed] [Google Scholar]
- Calhoun VD, Liu J, Adalı T. A review of group ICA for fMRI data and ICA for joint inference of imaging, genetic, and ERP data. NeuroImage. 2009;45:S163–S172. doi: 10.1016/j.neuroimage.2008.10.057. [DOI] [PMC free article] [PubMed] [Google Scholar]
- Chang C, Glover GH, Glover GH. Time–frequency dynamics of resting-state brain connectivity measured with fMRI. NeuroImage. 2010;50 (1):81–98. doi: 10.1016/j.neuroimage.2009.12.011. [DOI] [PMC free article] [PubMed] [Google Scholar]
- Chou Y, Panych LP, Dickey CC, Petrella JR, Chen NK. Investigation of long-term reproducibility of intrinsic connectivity network mapping: a resting-state fMRI study. Am J Neuroradiol. 2012;33 (5):833–838. doi: 10.3174/ajnr.A2894. [DOI] [PMC free article] [PubMed] [Google Scholar]
- Cohen J. Statistical Power Analysis for the Behavioral Sciences. 2. Lawrence Erlbaum; Hillsdale, New Jersey: 1988. [Google Scholar]
- Cole DM, Smith SM, Beckmann CF. Advances and pitfalls in the analysis and interpretation of resting-state FMRI data. Front Syst Neurosci. 2010;4:8. doi: 10.3389/fnsys.2010.00008. [DOI] [PMC free article] [PubMed] [Google Scholar]
- Damoiseaux JS, Rombouts SARB, Barkhof F, Scheltens P, Stam CJ, Smith SM, Beckmann CF. Consistent resting-state networks across healthy subjects. PNAS. 2006;103 (37):13848–13853. doi: 10.1073/pnas.0601417103. [DOI] [PMC free article] [PubMed] [Google Scholar]
- Du Y, Fan Y. Group information guided ICA for fMRI data analysis. NeuroImage. 2013;69 (C):157–197. doi: 10.1016/j.neuroimage.2012.11.008. [DOI] [PubMed] [Google Scholar]
- Erhardt EB, Rachakonda S, Bedrick EJ, Allen EA, Adali T, Calhoun VD. Comparison of multi-subject ICA methods for analysis of fMRI data. Hum Brain Mapp. 2010;32 (12):2075–2095. doi: 10.1002/hbm.21170. [DOI] [PMC free article] [PubMed] [Google Scholar]
- Filippini N, MacIntosh BJ, Hough MG, Goodwin GM, Frisoni GB, Smith SM, Mackay CE. Distinct patterns of brain activity in young carriers of the APOE-epsilon4 allele. PNAS. 2009;106 (17):7209–7214. doi: 10.1073/pnas.0811879106. [DOI] [PMC free article] [PubMed] [Google Scholar]
- Fox MD, Greicius MD. Clinical applications of resting state functional connectivity. Front Syst Neurosci. 2010;4 (19):1–13. doi: 10.3389/fnsys.2010.00019. [DOI] [PMC free article] [PubMed] [Google Scholar]
- Fox MD, Raichle ME. Spontaneous fluctuations in brain activity observed with functional magnetic resonance imaging. Nat Rev Neurosci. 2007;8:700–711. doi: 10.1038/nrn2201. [DOI] [PubMed] [Google Scholar]
- Fox MD, Zhang D, Snyder AZ, Raichle ME. The global signal and observed anticorrelated resting state brain networks. J Neurophysiol. 2009;101 (6):3270–3283. doi: 10.1152/jn.90777.2008. [DOI] [PMC free article] [PubMed] [Google Scholar]
- Freire L, Mangin JF. Motion correction algorithms may create spurious brain activations in the absence of subject motion. NeuroImage. 2001;14 (3):709–722. doi: 10.1006/nimg.2001.0869. [DOI] [PubMed] [Google Scholar]
- Guo CC, Kurth F, Zhou J, Mayer EA, Eickhoff SB, Kramer JH, Seeley WW. One-year test–retest reliability of intrinsic connectivity network fMRI in older adults. NeuroImage. 2010;61 (4):1–13. doi: 10.1016/j.neuroimage.2012.03.027. [DOI] [PMC free article] [PubMed] [Google Scholar]
- Hallquist MN, Hwang K, Luna B. The nuisance of nuisance regression: spectral misspecification in a common approach to resting-state fMRI preprocessing reintroduces noise and obscures functional connectivity. NeuroImage. 2013;82:208–225. doi: 10.1016/j.neuroimage.2013.05.116. [DOI] [PMC free article] [PubMed] [Google Scholar]
- Hedden T, Van Dijk KRA, Becker JAJ, Mehta AA, Sperling RAR, Johnson KAK, Buckner RLR. Disruption of functional connectivity in clinically normal older adults harboring amyloid burden. J Neurosci. 2009;29 (40):12686–12694. doi: 10.1523/JNEUROSCI.3189-09.2009. [DOI] [PMC free article] [PubMed] [Google Scholar]
- Jenkinson M, Beckmann CF, Behrens TE, Woolrich MW, Smith SM. FSL. NeuroImage. 2012;62:782–790. doi: 10.1016/j.neuroimage.2011.09.015. [DOI] [PubMed] [Google Scholar]
- Jones DT, Vemuri P, Murphy MC, Gunter JL, Senjem ML, Machulda MM, Jack CR. Non-stationarity in the “resting brain’s” modular architecture. PLoS ONE. 2012;7 (6):e39731. doi: 10.1371/journal.pone.0039731. [DOI] [PMC free article] [PubMed] [Google Scholar]
- Kim YH, Kim J, Lee JH. Iterative approach of dual regression with a sparse prior enhances the performance of independent component analysis for group functional magnetic resonance imaging (fMRI) data. NeuroImage. 2012;63 (4):1864–1889. doi: 10.1016/j.neuroimage.2012.08.055. [DOI] [PubMed] [Google Scholar]
- Lee MH, Smyser CD, Shimony JS. Resting-state fMRI: a review of methods and clinical applications. Am J Neuroradiol. 2012;34 (10):1866–1872. doi: 10.3174/ajnr.A3263. [DOI] [PMC free article] [PubMed] [Google Scholar]
- Lu H, Zou Q, Gu H, Raichle ME, Stein EA, Yang Y. Rat brains also have a default mode network. PNAS. 2012;109 (10):3979–3984. doi: 10.1073/pnas.1200506109. [DOI] [PMC free article] [PubMed] [Google Scholar]
- Margulies DS, Vincent JL, Kelly C, Lohmann G, Uddin LQ, Biswal BB, Petrides M. Precuneus shares intrinsic functional architecture in humans and monkeys. PNAS. 2009;106 (47):20069–20074. doi: 10.1073/pnas.0905314106. [DOI] [PMC free article] [PubMed] [Google Scholar]
- Meindl T, Teipel S, Elmouden R, Mueller S, Koch W, Dietrich O, Glaser C. Test–retest reproducibility of the default-mode network in healthy individuals. Hum Brain Mapp. 2010;31 (2):237–246. doi: 10.1002/hbm.20860. [DOI] [PMC free article] [PubMed] [Google Scholar]
- Mills SM, Mallmann J, Santacruz AM, Fuqua A, Carril M, Aisen PS, Bateman RJ. Preclinical trials in autosomal dominant AD: implementation of the DIAN-TU trial. Rev Neurol. 2013;169 (10):737–743. doi: 10.1016/j.neurol.2013.07.017. [DOI] [PMC free article] [PubMed] [Google Scholar]
- Murphy K, Birn RM, Handwerker DA, Jones TB, Bandettini PA. The impact of global signal regression on resting state correlations: are anti-correlated networks introduced? NeuroImage. 2009;44 (3):893–905. doi: 10.1016/j.neuroimage.2008.09.036. [DOI] [PMC free article] [PubMed] [Google Scholar]
- Reiman EM, Langbaum JB, Fleisher AS, Caselli RJ, Chen K, Ayutyanont N, Quiroz YT, Kosik KS, Lopera F, Tariot PN. Alzheimer’s prevention initiative: a plan to accelerate the evaluation of presymptomatic treatments. J Alzheimers Dis. 2011;26 (Suppl 3):321–329. doi: 10.3233/JAD-2011-0059. [DOI] [PMC free article] [PubMed] [Google Scholar]
- Richiardi J, Eryilmaz H, Schwartz S, Vuilleumier P, Van De Ville D. Decoding brain states from fMRI connectivity graphs. NeuroImage. 2011;56:616–626. doi: 10.1016/j.neuroimage.2010.05.081. [DOI] [PubMed] [Google Scholar]
- Rosazza C, Minati L. Resting-state brain networks: literature review and clinical applications. Neurol Sci. 2011;32 (5):773–785. doi: 10.1007/s10072-011-0636-y. [DOI] [PubMed] [Google Scholar]
- Rubinov M, Sporns O. Complex network measures of brain connectivity: uses and interpretations. NeuroImage. 2010;52 (3):1059–1069. doi: 10.1016/j.neuroimage.2009.10.003. [DOI] [PubMed] [Google Scholar]
- Shehzad ZE, Kelly AMC, Reiss PT, Gee DG, Gotimer K, Uddin LQ, Milham MP. The resting brain: unconstrained yet reliable. Cereb Cortex. 2009;19:2209–2229. doi: 10.1093/cercor/bhn256. [DOI] [PMC free article] [PubMed] [Google Scholar]
- Shirer WR, Greicius MD, Ryali S, Rykhlevskaia E, Menon V. Decoding subject-driven cognitive states with whole-brain connectivity patterns. Cereb Cortex. 2011;22 (1):158–165. doi: 10.1093/cercor/bhr099. [DOI] [PMC free article] [PubMed] [Google Scholar]
- Shrout PE, Fleiss JL. Intraclass correlations: uses in assessing rater reliability. Psychol Bull. 1979;86 (2):420–428. doi: 10.1037//0033-2909.86.2.420. [DOI] [PubMed] [Google Scholar]
- Smith SM, Fox PT, Miller KL, Glahn DC, Fox PM, Mackay CE, Laird AR. Correspondence of the brain’s functional architecture during activation and rest. PNAS. 2009;106 (31):13040–13045. doi: 10.1073/pnas.0905267106. [DOI] [PMC free article] [PubMed] [Google Scholar]
- Smith SM, Miller KL, Moeller S, Xu J, Auerbach EJ, Woolrich MW, et al. Temporally-independent functional modes of spontaneous brain activity. Presented at the Proceedings of the National Academy of Sciences. 2012;109:3131–3136. doi: 10.1073/pnas.1121329109. [DOI] [PMC free article] [PubMed] [Google Scholar]
- Sperling RA, Jack CR, Aisen PS. Testing the right target and right drug at the right stage. Sci Transl Med. 2011;3 (111):11cm33–111cm33. doi: 10.1126/scitranslmed.3002609. [DOI] [PMC free article] [PubMed] [Google Scholar]
- Strother SC, Anderson JR, Schaper KA, Sidtis JJ, Liow JS, Woods RP, Rottenberg DA. Principal component analysis and the scaled subprofile model compared to intersubject averaging and statistical parametric mapping: I. “functional connectivity” of the human motor system studied with [15O]water PET. J Cereb Blood Flow Metab. 1995;15 (5):738–753. doi: 10.1038/jcbfm.1995.94. [DOI] [PubMed] [Google Scholar]
- van den Heuvel MP, Pol HEH. Exploring the brain network: a review on resting-state fMRI functional connectivity. Eur Neuropsychopharmacol. 2010;20:519–534. doi: 10.1016/j.euroneuro.2010.03.008. [DOI] [PubMed] [Google Scholar]
- van der Kouwe AJW, Benner T, Salat DH, Fischl B. Brain morphometry with multiecho MPRAGE. NeuroImage. 2008;40 (2):559–569. doi: 10.1016/j.neuroimage.2007.12.025. [DOI] [PMC free article] [PubMed] [Google Scholar]
- Van Dijk KRA, Hedden T, Venkataraman A, Evans KC, Lazar SW, Buckner RL. Intrinsic functional connectivity as a tool for human connectomics: theory, properties, and optimization. J Neurophysiol. 2010;103 (1):297–321. doi: 10.1152/jn.00783.2009. [DOI] [PMC free article] [PubMed] [Google Scholar]
- Van Essen DC, Smith SM, Barch DM, Behrens TEJ, Yacoub E, Ugurbil K WU-Minn HCP Consortium. The WU-Minn human connectome project: an overview. NeuroImage. 2013;80:62–79. doi: 10.1016/j.neuroimage.2013.05.041. [DOI] [PMC free article] [PubMed] [Google Scholar]
- Wig GS, Schlaggar BL, Petersen SE. Concepts and principles in the analysis of brain networks. Ann N Y Acad Sci. 2011;1224 (1):126–146. doi: 10.1111/j.1749-6632.2010.05947.x. [DOI] [PubMed] [Google Scholar]
- Wig GS, Laumann TO, Cohen AL, Power JD, Nelson SM, Glasser MF, et al. Parcellating an individual subject’s cortical and subcortical brain structures using snowball sampling of resting-state correlations. Cereb Cortex. 2013 doi: 10.1093/cercor/bht056. [DOI] [PMC free article] [PubMed] [Google Scholar]
- Yeo TB, Krienen FM, Sepulcre J, Sabuncu MR, Lashkari D, Hollinshead M, Buckner RL. The organization of the human cerebral cortex estimated by intrinsic functional connectivity. J Neurophysiol. 2011;106 (3):1125–1165. doi: 10.1152/jn.00338.2011. [DOI] [PMC free article] [PubMed] [Google Scholar]
- Zuo XN, Di Martino A, Kelly C, Shehzad ZE, Gee DG, Klein DF, Milham MP. The oscillating brain: complex and reliable. NeuroImage. 2010;49 (2):1432–1445. doi: 10.1016/j.neuroimage.2009.09.037. [DOI] [PMC free article] [PubMed] [Google Scholar]
Associated Data
This section collects any data citations, data availability statements, or supplementary materials included in this article.