Abstract
Sepsis is a major cause of death worldwide. It triggers systemic inflammation, the role of which remains unclear. In the current study, we investigated the induction of microRNA (miRNA) during sepsis and their role in the regulation of inflammation. Patients, on days 1 and 5 following sepsis diagnosis, had reduced T cells but elevated monocytes. Plasma levels of IL-6, IL-8, IL-10 and MCP-1 dramatically increased in sepsis patients on day 1. T cells from sepsis patients differentiated primarily into Th2 cells, whereas regulatory T cells decreased. Analysis of 1163 miRNAs from PBMCs revealed that miR-182, miR-143, miR-145, miR-146a, miR-150, and miR-155 were dysregulated in sepsis patients. miR-146a downregulation correlated with increased IL-6 expression and monocyte proliferation. Bioinformatics analysis uncovered the immunological associations of dysregulated miRNAs with clinical disease. The current study demonstrates that miRNA dysregulation correlates with clinical manifestations and inflammation, and therefore remains a potential therapeutic target against sepsis.
Keywords: Cytokine, IL-6, miRNA, monocyte, sepsis, miR-146a
1. Introduction
Sepsis is a serious disease, characterized as a heightened systemic inflammatory response to a severe infection often with high spiking fevers and shock accompanied by respiratory and organ failure [1]. Based on such observations, it was believed that sepsis may result from uncontrolled inflammatory response. However, clinical trials using anti-inflammatory agents showed either no benefit or even decreased survival, thereby suggesting that the pathogenesis was more complex [2]. Recent studies suggested that the host response during sepsis includes both pro-inflammatory and contrasting anti-inflammatory components of the immune response [2]. For example, a hallmark of sepsis is an exacerbated production of pro-inflammatory cytokines, often resulting in detrimental effects such as capillary leakage and tissue edema. It has been documented that plasma levels of pro-inflammatory cytokines such as IL-6, IL-8 and TNF-α increase significantly in sepsis patients [3]. Interestingly, sepsis patients also produce large amounts of anti-inflammatory cytokines such as IL-10 [4]. Thus, despite extensive basic and clinical research, the pathophysiology of sepsis remains unclear and additional studies are necessary to understand this immunological imbalance.
MicroRNAs (miRNAs) are small noncoding RNAs that regulate gene expression by binding to complementary target mRNAs thereby inhibiting translation. Changes in miRNA expression occurs in response to environmental stimuli and play an important role in the regulation of the immune response [5]. miRNAs modulate T helper cell and regulatory T cell (Treg) development, critical in controlling the host response to disease progression, and play a crucial role in the regulation of cytokine genes [6, 7]. In sepsis patients, abnormal levels of miRNAs, including miR-146a, miR-155, miR150, miR-132 miR-182, miR-342-5p and miR-486 have been detected [8] [9]. miR-146a is recognized as particularly important with serum levels of miR-146a significantly decreased in sepsis patients [10]. Additionally, ectopic expression of miR-146a/b inhibited IL-6 secretion from primary human fibroblasts [11]. Such studies indicate that changes in miRNA expression may cause the dysregulation in cytokine production, which may account for the varying immune response seen in sepsis patients and consequent pathogenesis.
In the current study, we analyzed the cytokines and chemokines found in sepsis patients and correlated these results with alterations in miRNA expression in peripheral blood mononuclear cells (PBMC). Our findings supported the down-regulation of miR-146a in sepsis patients and the association with increased levels of IL-6, a cytokine that is an important mediator of the inflammatory response in sepsis. Importantly, bioinformatics pathway analysis revealed that alterations in miRNA expression in PBMC may initiate modulation of specific pro-inflammatory and anti-inflammatory processes at work during the earliest stages of sepsis.
2. Materials and Methods
2.1 Ethics Statement
The Palmetto Health Institutional Review Board (IRB) approved this study. All normal controls and sepsis patients were adults and gave written consent participate in this study by signing the Palmetto Health IRB-approved consent form (#2010-59).
2.2 Normal control and patient samples
Sepsis patients, aged 18 years or older, admitted to Palmetto Health Richland Hospital (Columbia, South Carolina) Intensive Care Unit (ICU), who met the American College of Chest Physicians (ACCP) and Society of Critical Care Medicine criteria of sepsis, were recruited. For normal controls, healthy volunteers aged 18 years or older, working at the Palmetto Health Richland Hospital, who did not have any symptoms of active infection or any history of immune compromise such as HIV, cancer, pregnancy, or on current chronic steroid therapy, were recruited. A total of 32 sepsis patients and 38 controls were recruited in this study (Table 1). By day 5 post-admission, 5 patients succumbed to their illnesses and one patient had been discharged, leaving 26 sepsis patients. The cause of sepsis was not determined in all cases, however the following positive cultures were documented among the patients: Escherichia coli, Providencia rettgeri and Staphylococcus aureus, Stenotrophomonas, Enterobacteriaceae, Citrobacter, Candida albicans, Proteus mirabilis, gram variable coccobacilli, gram-positive cocci, and gram negative rods. Patients were given a Sequential Organ Failure Assessment (SOFA) score on days 1 and 5. The SOFA score describes the extent of a patient’s organ function or rate of failure and is based on criteria in six different categories: respiratory, cardiovascular, coagulation, hepatic, renal and neurologic systems [12]. An increased SOFA score is positively correlated with mortality rate.
Table 1.
Demographic and clinical profile of sepsis patients
| Criterion | 1st day of diagnosis | 5th day of diagnosis | p valuea | Normal range (reference) |
|---|---|---|---|---|
| Number of patients | 32 | 26b | ||
| Sex (male/female) | 10/22 | 10/16 | ||
| Race (Caucasian/African American) | 17/15 | 16/10 | ||
| Age (years) | 64 ± 14c | 62 ± 14 | 0.59 | |
| SOFA scored | 10 ± 4 | 5 ± 2 | < 0.0001 | |
| P/F ratioe | 265 ± 24 | 306 ± 23 | 0.39 | 450[48] |
| White blood cell (WBC) counts (103/μL) | 17.2 ± 1.5 | 14.4 ± 1.0 | 0.13 | 4–11[49, 50] |
| Bands (immature neutrophils) (%) | 25.9 ± 2.8 | 11.8 ± 1.8 | < 0.05 | 0–10[51] |
| Mature neutrophils (%) | 69.4 ± 3.4 | 61.8 ± 5.2 | 0.19 | 40–60[52] |
| Total neutrophils (%) | 84.6 ± 2.2 | 68.6 ± 5.7 | < 0.05 | 35–80[51] |
| Absolute neutrophil counts (NBC) (103/μL) | 14.5 ± 1·3 | 9.1 ± 1.2 | < 0.05 | 1.8–7.5[49, 51] |
| Lymphocytes (%) | 9.0 ± 1·3 | 7.0 ± 1·0 | 0.25 | 20–50[53] |
| Absolute Lymphocyte counts (103/μL) | 1.4 ± 0·2 | 0.9 ± 0.1 | 0.16 | 1.94 ± 0.79[54] |
| Monocytes (%) | 5.8 ± 0.8 | 5.8 ± 0.6 | 0.50 | 5.8 ± 2.8[55] |
| Absolute Monocyte counts (103/μL) | 1.0 ± 0.2 | 0.8 ± 0.1 | 0.32 | 0.32 ± 0.20[54] |
Note:
Statistical comparison between the first day and fifth day after patients were enrolled and diagnosed in Palmetto Health Richland Medical intensive care unit (ICU);
5 patients deceased, 1 patient discharged;
Mean ± standard deviation;
SOFA score, the Sequential Organ Failure Assessment score, a scoring system to determine the extent of a person’s organ function or rate of failure [12];
P/F ratio, ratio of PaO2/FiO2, an index of arterial oxygenation efficiency that corresponds to ratio of partial pressure of arterial O2 to the fraction of inspired O2.
2.3 Preparation of peripheral blood and peripheral blood mononuclear cells (PBMC)
20mL of peripheral blood samples were drawn from sepsis donors by hospital nurses using venipuncture within first 24 hours and on the 5th day after admission, and transferred into tubes coated with ethylenediamine tetraacetic acid (EDTA). Blood from control donors was similarly drawn. White blood cell counts were performed in an automated blood count instrument. Blood films or peripheral blood smear slides were made, stained with Giemsa and analyzed under a microscope to count neutrophils (bands and mature neutrophils), lymphocytes and monocytes.
Blood samples were also processed immediately by Ficoll-Paque (GE Healthcare, Uppsala, Sweden) centrifugation to isolate PBMC samples. Viable PBMC were counted by trypan-blue exclusion.
2.4 Analysis of cell population in PBMC
PBMC samples were stained with APC-conjugated anti-human CD3, FITC-conjugated anti-human CD4, PE-conjugated anti-human CD8, FITC-conjugated anti-human CD19, PE-conjugated anti-human CD56 and APC-conjugated anti-human CD14 monoclonal antibodies. Then, flow cytometry was carried out using a Cytomics FC500 flow cytometer (Beckman Coulter, Fullerton, CA) to enumerate CD4+ T cells (CD3+, CD4+, CD8−), CD8+ T cells (CD3+, CD4−, CD8+), B cells (CD3+, CD19+), NK cells (CD3−, CD56+), NKT cells (CD3+, CD56+) and monocytes (CD14+) in PBMC samples. All antibodies were purchased from Biolegend (San Diego, CA).
2.5 PBMC stimulation in vitro and intracellular staining of T helper cells
PBMC were stimulated with 50μg/mL phytohemagglutinin (PHA, Fisher Scientific, Pittsburgh, PA) in 5mL of X-VIVO 15 media (Lonza, Walkersville, MD) in 6-well plates in a humidified 5% CO2 incubator at 37°C for 3 days. Then, PBMC were fixed, permeabilized using Cytofix/Cytoperm (BD, Franklin Lakes, NJ) and stained with APC-conjugated anti-human CD4, FITC-conjugated anti-human IFN-γ, PE-conjugated anti-human IL-4 or FITC-conjugated anti-human IL-17 and PE-conjugated anti-human FoxP3 monoclonal antibodies. IFN-γ, IL-4, IL-17 and FoxP3 producing CD4+ T cells were determined by flow cytometry using Cytomics FC500 flow cytometer (Beckman Coulter, Fullerton, CA) to analyze Th1, Th2, Th17 and regulatory T cells (Treg) in PBMC samples, respectively. All antibodies were purchased from Biolegend (San Diego, CA).
2.6 Cytokine assay in human plasma
Plasma samples from patients and controls were stored at −80°C for cytokine analysis. Twenty seven cytokines (IL-1β, IL-1RA, IL-2, IL-4, IL-5, IL-6, IL-7, IL-8, IL-9, IL-10, IL-12(p70), IL-13, IL-15, IL-17, FGF-β, eotaxin, G-CSF, GM-CSF, IFN-γ, IP-10, MCP-1, MIP-1α, MIP-1β, PDGF-BB, RANTES, TNF-α and VEGF) were analyzed using the Bio-Plex human cytokine 27-plex assay (Bio-Rad, Hercules, CA).
2.7 miRNA array analysis
Total RNA was isolated from PBMC from sepsis patients on day 1 post-admission to the ICU and controls using the miRNeasy Mini kit (Qiagen, Valencia, CA). Next, total RNA was analyzed by miRNA array hybridization with an Affymetrix miRNA 1.0 Genechip® as per the manufacturer’s instructions. The array contained 609 mouse miRNA oligonucleotide probe sets from Sanger miRBASE (v11). Total RNA samples containing small RNAs were biotin labeled with the FlashTag Biotin HSR RNA labeling kit (Genisphere, Hatfield, PA). Pre-labeled spike control oligonucleotides were added as controls for labeling, hybridization and data normalization. Samples were processed and assayed on the GeneChip Scanner (Affymetrix) as previously described [13]. Microarray image data were analyzed with the miRNA QC software (Affymetrix) for data summarization, normalization and quality control. Probe sets with a p value for detection call higher than 0.05 were labeled “false” and were excluded from subsequent analysis. Signals that were <3 standard deviations of over the mean background value were also excluded. Mean-centered log-transformed fluorescence intensity values were determined and log2 fold-change expression calculating the average differences between sepsis patients (n=2) and controls (n=4) of 1163 miRNAs were determined. miRNAs for which log2 fold-change was greater than 2 and with p<0.01 following t-test between sepsis and control groups were further analyzed by Ingenuity Pathway Analysis and Cytoscape.
2.7 Real-time PCR of miRNA expression
cDNA was synthesized from total RNA isolated from PBMC from sepsis patients day 1 post-admission to the ICU and controls using the miScript Reverse Transcription kit (Qiagen, Valencia, CA). Then, using a miScript SYBR® Green PCR kit (Qiagen, Valencia, CA), the expression of miR-146a, miR-182 and miR-486 was analyzed with the StepOnePlus™ Real-Time PCR System (Applied Biosystems, Carlsbad, CA) using specific TaqMan® Small RNA Assays (Applied Biosystems, Carlsbad, CA). RNU1A (TaqMan® Small RNA Controls from Applied Biosystems) was used as a small RNA endogenous control. The 2−ΔΔCT method was used to determine the fold change of miRNA between sepsis and control samples.
2.8 Analysis of miRNA-involved Ingenuity pathways
Potential target gene network interactions controlled by dysregulated miRNA molecules in sepsis patients were analyzed using Ingenuity Pathway Analysis® (IPA; Ingenuity Systems, www.ingenuity.com).
2.9 Luciferase reporter constructs and Dual-luciferase assay
The complementary sequence between miR-146a and 3′-untranslated region (3′-UTR) of IL-6 mRNA was determined using the miRNA.org target prediction program (http://www.microrna.org/microrna/getGeneForm.do). The 3′-UTR of IL-6 was cloned from PBMC samples by PCR using the SacI restriction site-tagged forward primer (5′-GCTAGCGAGCTCCATGGGCACCTCAGATTGTTGTTG-3′) and XbaI restriction site-tagged reverse primer (5′-CTCGAGTCTAGAGCTGAATTTTTTAAAATGCCATTT-3′). IL-6 3′-UTR fragments were subcloned into pmirGLO dual-luciferase miRNA target expression vector (Promega, Madison, WI) to make IL-6 3′-UTR reporter1 derived from controls and IL-6 3′-UTR reporter2 from sepsis patients. Then, 2μg + of control vector or IL-6 3′-UTR reporter vectors with 250nM of miR-146a precursor (Applied Biosystems, Carlsbad, CA) were introduced into 2·106 THP-1 cells (ATCC, Manassas, VA) in 100μl OPTI-MEMI (Invitrogen, Carlsbad, CA) by electroporation using BTX ECM830 Elecrto Square Porator (Harvard Apparatus, Holliston, MA) under LV mode at 300v for 10ms. After culture for two days in 3mL of X-VIVO 15 medium (Lonza, Walkersville, MD) per well in 12-well plates, the cells were analyzed for luciferase activity using the Dual-Glo® Luciferase Assay System (Promega, Madison, WI) and the Wallac 1420 VICTOR2™ Multilabel Counter (PerkinElmer, Shelton, CT). Normalized firefly luciferase activity (firefly luciferase activity/Renilla luciferase activity) for each construct was compared to the vector without inserts. For each transfection, luciferase activity was averaged from six replicates.
2.10 IL-6 down-regulation by miR-146a
Concentrations of 0, 50, 250 or 500nM miR-146a precursor (Applied Biosystems, Carlsbad, CA) were introduced into 1·106 THP-1 cells (ATCC, Manassas, VA) as described above. After culture for one day in 2mL of X-VIVO 15 (Lonza, Walkersville, MD) per well in 24-well plates, THP-1 cells were stimulated with 1ng/mL of lipopolysaccharide (LPS, Sigma-Aldrich, St. Louis, MO). After two days, IL-6 release in THP-1 culture supernatants was determined by enzyme-linked immunosorbent assay (ELISA) using ELISA MAX™ Set Standard human IL-6 kit (Biolegend, San Diego, CA).
2.11 Assay of cell proliferation stimulated by IL-6
THP-1 cells (1×10⁵) were seeded in 200μL of RPMI-1640 medium and 10% fetal calf serum per well in 96-well plate with 0, 10fg/mL, 100fg/mL, 1000fg/mL of recombinant human IL-6 (R&D Systems, Minneapolis, MN). After culture for one day, 1μCi of 3H-thymidine (MP Biomedicals, Solon, OH) diluted in 10μL of culture medium was added to each well. After 15h, 3H-thymidine incorporation was determined with a 1450 MicroBeta TriLux Microplate Scintillation and Luminescence Counter (PerkinElmer, Shelton, CT).
2.12 Statistical analysis
Each experiment was repeated at least three times. Data were presented as mean ± SEM. The Wilcoxon rank-sum test was used in statistical analysis as described previously [14], and. Pearson’s correlation test was used to determine the association between cytokine expression and sepsis severity. For both tests, a p value < 0.05 is considered as statistically significant. The heat map, principal component analysis (PCA) plots and volcano plots compare differences in miRNA expression between controls and sepsis patients. All statistical analysis was done in R (2.13.2) [15].
3. Results
3.1 Altered immune cell populations in sepsis patients
In the current study, we investigated the immune status of sepsis patients on days 1 and 5 after admission to the ICU. Compared to normal values, sepsis patients showed significant leukocytosis, granulocytosis and lymphopenia on day 1 after diagnosis (Table 1). Although monocyte percentage did not change considerably, the absolute number of monocytes dramatically increased in whole blood from sepsis patients. On day 5, the sepsis patients had noticeable health improvement as shown with significantly decreased SOFA scores (Table 1). Also, this was accompanied by a significant shift in the number of neutrophils towards normal range, while lymphocyte and monocyte counts on day 5 did not exhibit significant change when compared to day 1.
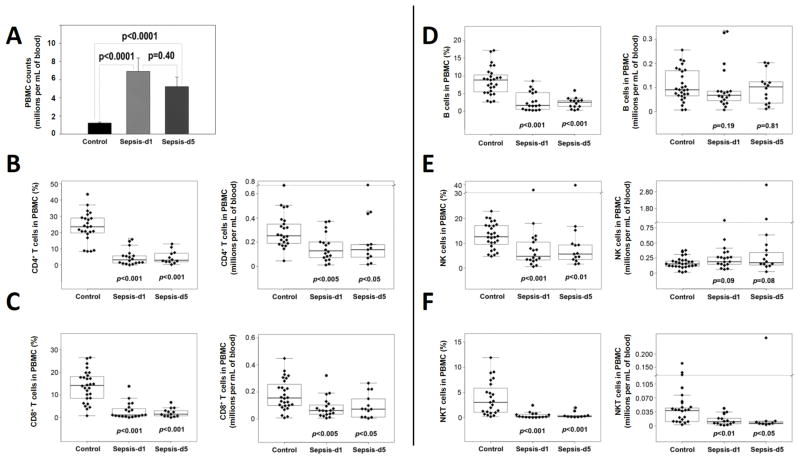
Next, we analyzed PBMC lymphocyte subsets. The PBMC counts increased significantly (Figure 1A), whereas the percentage of CD4+ T cells, CD8+ T cells, B cells, NK and NKT cells significantly decreased in sepsis patients (Figures 1B–F). When the absolute numbers of various cell populations were calculated, T cell (including CD4+ (Figure 1B), CD8+ T cells (Figure 1C) and NKT cells (Figure 1F)) numbers decreased significantly, whereas the numbers of B cells (Figure 1D) and NK cells (Figure 1E) did not change. The pattern remained unchanged on day 5 when compared to day 1, in sepsis patients.
Figure 1. Comparison of PBMC between normal controls and sepsis patients.
PBMC were isolated by Ficoll gradient centrifugation from the peripheral blood samples of normal controls and sepsis patients at days 1 and 5 after admission in the ICU and diagnosis of sepsis. Then, a trypan-blue exclusion assay was used to determine PBMC counts to compare them between 38 controls and 32 sepsis patients (A). CD4+ and CD8+ T cells were analyzed by flow cytometry following staining with FITC-anti-CD3, PE-anti-CD8 and APC-anti-CD4 antibodies. Also, B cells were analyzed after staining with FITC-anti-CD19 and APC-anti-CD3 antibodies. After staining with PE-anti-CD56 and APC-anti-CD3 antibodies, NK and NKT cells were analyzed by FACS. Then, the Wilcoxon rank-sum test was used to compare differences in the percentages or numbers of CD4+ T cells (CD3+, CD4+, CD8−) (B), CD8+ T cells (CD3+, CD4−, CD8+) (C), B cells (CD3+, CD19+) (D), NK cells (CD3−, CD56+) (E) and NKT cells (CD3+, CD56+) (F) between controls and sepsis patients. In panel A, p values between controls and sepsis patients at days 1 and 5 are presented. In panels B–F, the boxed data includes 50% of measurements at medium level, the line in the box was the average value and the data beyond the upper line are outliers. p values between controls and sepsis patients at days 1 and 5 are shown.
3.2 Characterization of Th cell subsets based on cytokine production in sepsis patients
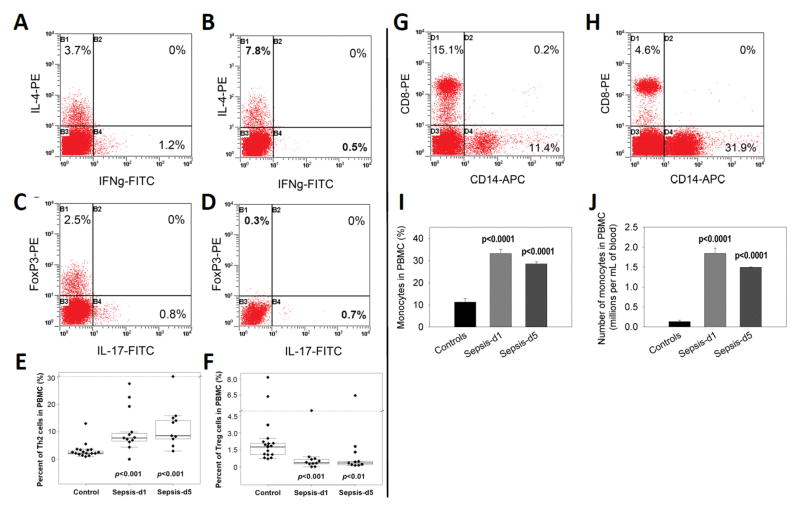
To identify how the T cells from sepsis patients would differentiate upon activation, PBMC were stimulated with PHA for 3 days and stained with antibodies against various cytokines or FoxP3 to characterize Th1, Th2, Th17 and Treg cell populations (Figure 2A–F). These data indicated that IL-4-producing CD4+ T cells (Th2) significantly increased in PBMC from sepsis patients compared to controls (Figures 2A, B & E). In contrast, the Th1 cell numbers in culture of sepsis patients did not change significantly (Figures 2A–B). The Treg cells decreased significantly on both day 1 and day 5(Figures 2C, D & F), while the Th17 cells remained unaltered (Figure 2C and 2D). Together, our data suggested that the T cells from sepsis patients differentiated primarily into Th2 rather than Th1 or Th17 cells, whereas Treg cells decreased on both days 1 and 5 after admission.
Figure 2. Th1, Th2, Th17 and Treg and monocyte populations in PBMC between controls and sepsis patients.
PBMC were isolated from human peripheral blood samples by Ficoll gradient centrifugation. They were stimulated with 50μg/mL PHA for 3 days. After staining with FITC-anti-IFN-γ, PE-anti-IL-4 or FITC-anti-IL-17, PE-anti-FoxP3 and APC-anti-CD4 antibodies, the cells were analyzed by flow cytometry. Next, the percentage and absolute numbers of Th1, Th2, Th17 and Treg cell populations, respectively, were determined. A representative profile of IFN-γ producing Th1 cells and IL-4 producing Th2 cells in PBMC from a normal control (A) and a sepsis patient at day 5 was shown (B). Also, representative profiles of IL-17 producing Th17 cells and FoxP3 positive Treg cells in PBMC from a normal control (C) and a sepsis patient at day 5 were shown (D). Percentages of Th2 (E) and Treg (F) cell populations in PBMC were compared between controls (n=38) and sepsis patients (n=32) at days 1 and 5. In panels E and F, the boxed data included 50% of measurements at medium level, the line in the box was the average value and the data beyond the upper line were the outliers. For comparison of monocytes, PBMC were stained by APC-anti-CD14 antibody, monocyte populations (CD14+) were determined by flow cytometry. A representative profile of CD14-positive monocytes in PBMC from a normal control (G) and sepsis patient at day 1 was shown (H). Percentages of CD14-positive monocytes (I) and their absolute numbers (J) in PBMC were compared between controls and sepsis patients at days 1 and 5. P values between controls and sepsis patients at days 1 and 5 are shown.
3.3 Monocyte increase in sepsis patients
Staining PBMCs for monocytes using CD14 as a marker, revealed that monocytes significantly increased in the PBMC from sepsis patients at both the first day and fifth day after admission compared with controls (Figure 2G–J). These data corroborated the analysis of whole blood monocyte counts (Table 1). Sepsis patients had slightly decreased levels of monocytes on day 5 when compared to day 1, but this difference was not significant (p = 0.39) (Figures 2I–J). Overall, these data demonstrated that a prolonged monocytosis occurred in sepsis patients, suggesting that monocytes may play a role in sepsis pathogenesis.
3.4 Cytokine dysregulation in sepsis patients
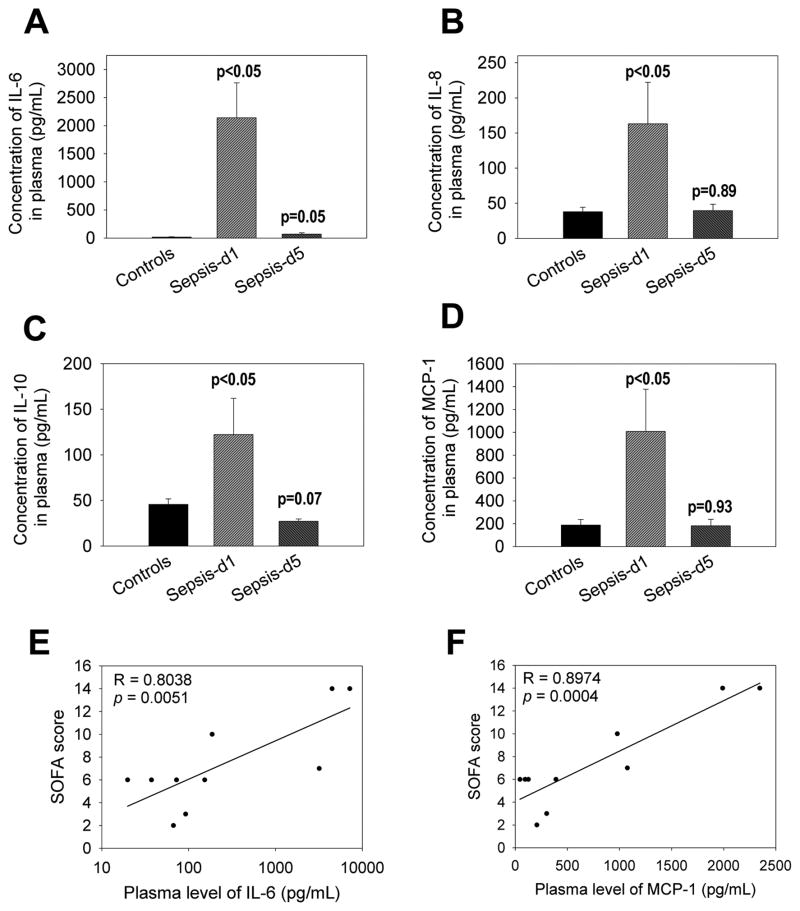
Sepsis patients exhibit an excessive production of both pro- and anti-inflammatory cytokines [16]. Cytokine assays demonstrated that plasma concentration of IL-6, IL-8, IL-10 and monocyte chemotactic protein-1 (MCP-1) significantly increased in sepsis patients on day 1 (Figure 3A–D). Interestingly, by day 5 following treatment of patients, each of these cytokines returned to normal levels. Of the cytokines induced, the concentration of IL-6 was the highest (Figure 3A). Furthermore, plasma concentration of both IL-6 and MCP-1 correlated with the disease severities of sepsis patients (Figure 3E)
Figure 3. Comparison of IL-6, IL-8, IL-10 and MCP-1 levels in plasma between controls and sepsis patients.
Plasma samples were obtained from human peripheral blood samples and analyzed for multiple cytokines using a Bio-Rad Bio-Plex Pro Human Cytokine 27-plex Assay kit. We found significant alterations in 4 cytokines: IL-6 (A), IL-8 (B), IL-10 (C) and MCP-1 (D), which were plotted. P values between controls and sepsis patients at days 1 and 5 are shown. In addition, plasma levels of both IL-6 (E) and MCP-1 (F) were compared with the SOFA scores of sepsis patients. Both correlation coefficient (R) and p values are shown.
3.5 miRNA expression in sepsis patients
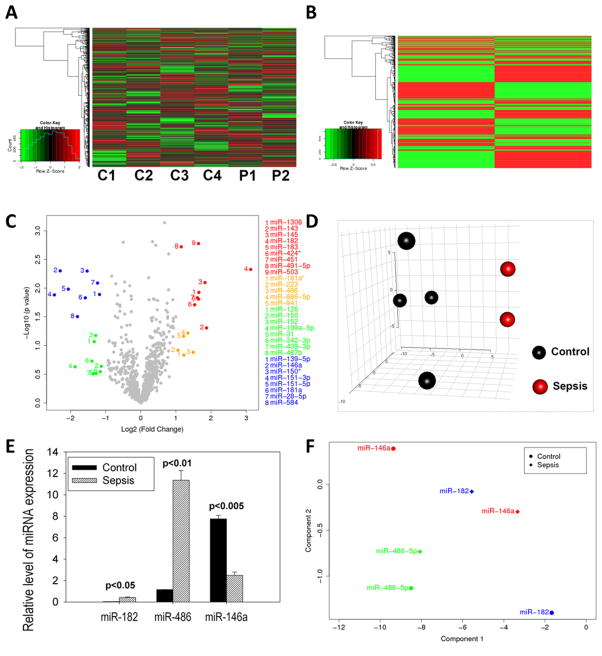
The role of miRNA dysregulation in sepsis patients was analyzed, inasmuch as it plays an important role in infectious diseases and immunological disorders [17]. Using high-throughput miRNA microarray hybridization analysis, we investigated the expression of 1163 miRNAs in PBMC from sepsis patients on day 1 post-admission to the ICU. The data shown in the heat maps (Figure 4A-individual samples and 4B-means) and volcano plot (Figure 4C) demonstrated dramatic alterations of miRNA expression in PBMC from sepsis patients (n=2) when compared to controls (n=4). Furthermore, the data in the principal component analysis (PCA) plot (Figure 4D) demonstrated that miRNA expression in sepsis patients had similar patterns in that they were clustered in close proximity, whereas those in controls were diversified but separated from sepsis patients.
Figure 4. Alterations in miRNA expression in PBMC from sepsis patients.
After PBMC were isolated from peripheral blood samples by Ficoll gradient centrifugation, total RNA samples including miRNAs were isolated from PBMC. Then, total RNA samples were used for Affymetrix miRNA array analysis. Relative expression levels of miRNAs in PBMC from sepsis patients were calculated as compared with controls by heat map (A). miRNA expression using microarray hybridization analysis in sepsis patients displayed dramatic alterations as shown in the heat map of the mean values for sepsis patients (n=2) (B) and volcano plot (C) when compared to normal controls (n=4). In panel C, >2 fold significantly up-regulated miRNAs in sepsis patients (red), >2 fold up-regulated but not significant (gold), >2 fold significantly down-regulated (blue), and >2 fold down-regulated but not significant (green). In (D), relative expression levels of miRNAs in PBMC from sepsis patients were compared to controls with a 3-dimensional PCA score plot (A). The dysregulation in three representative miRNAs detected by miRNA array hybridization assay (E) was confirmed by quantitative real-time PCR analysis in PBMC samples from twelve sepsis patients and twelve controls (F). Wilcoxon rank-sum test was used to compare the difference in miRNA expression in PBMC between controls and sepsis patients and p values for significance were indicated
Based on these studies, we focused on some relevant miRNAs that were altered in their expression such as miR-182, miR-143, miR-486, miR-145 and miR-1308, which were found to be up-regulated, whereas miR-181a, miR-146a and miR-584 were down-regulated in sepsis patients (Figure 4C). We confirmed these data by selectively screening some representative miRNA such as miR-182, miR-486 and miR-146a, using real-time PCR and these data (Figure 4E) corroborated our microarray analysis (Figure 4F). These results suggest that miRNA dysregulation may have implications in sepsis pathogenesis.
3.6 Effect of miR-146a regulated IL-6 expression on monocytes
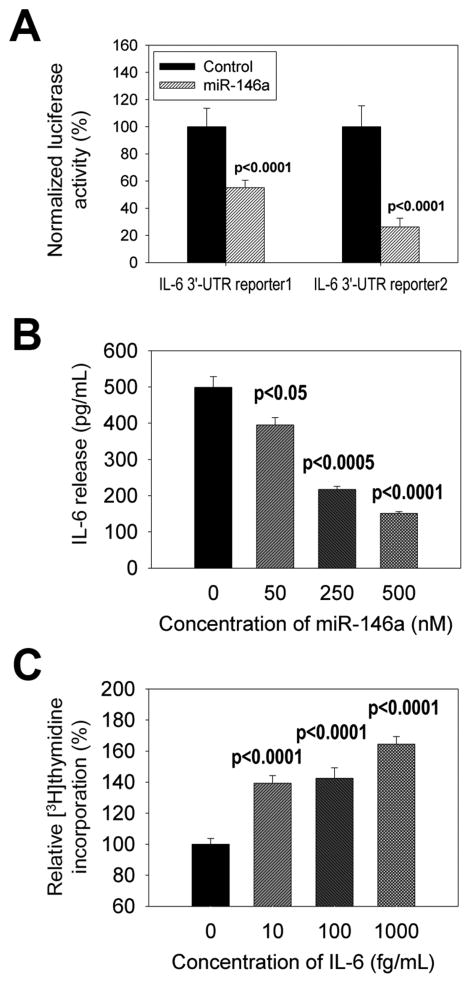
miR-146a plays a crucial role in the regulation of cytokines and in silico studies indicate that miR-146a may bind to the 3′-UTR of IL-6 mRNA [18]. To determine the relationship between miR-146a and IL-6, we performed a luciferase reporter assay and demonstrated that miR-146a co-transfection reduced IL-6 reporter expression (Figure 5A). The 3′ UTR of IL-6 for reporters were derived from both normal control (“reporter 1”) and sepsis patients (“reporter 2”) to offer some assurance that results were not altered by genetic differences between groups as have been observed with other sepsis pathogenesis genes [19]. Moreover, transfection experiments confirmed that miR-146a concentration was inversely correlated with IL-6 gene expression (Figure 5B). It has been shown that human monocytes and monocyte cell lines such as THP-1 and U937 cells proliferated in vitro [20–22]. Our analysis showed that IL-6 promoted monocyte proliferation (Figure 5C). Together, these data demonstrated that in sepsis patients, down-regulated miR-146a likely contributes to IL-6 up-regulation either through intermediates such as TRAF-6 and IRAK-1, or by a direct mechanism, which in turn can impact both inflammatory and anti-inflammatory processes.
Figure 5. Effect of miR-146a modulation on IL-6 expression.
The 3′-UTR of IL-6 was cloned from PBMC samples of normal controls and sepsis patients, and subcloned into a dual-luciferase miRNA target expression vector to construct IL-6 3′-UTR reporter1 (from normal control) and reporter2 (from sepsis patient). Then, IL-6 3′-UTR reporter constructs were introduced into THP-1 cells with miR-146a. After culture, luciferase activities were analyzed to determine the association between miR-146a and the 3′UTR of IL-6 (A). miR-146a was introduced into THP-1 cells. After LPS stimulation, IL-6 release from THP-1 cells was determined by ELISA (B). THP-1 cells were incubated with different concentrations of IL-6 and 3H-thymidine incorporation was analyzed (C). P values between control and treated groups were presented.
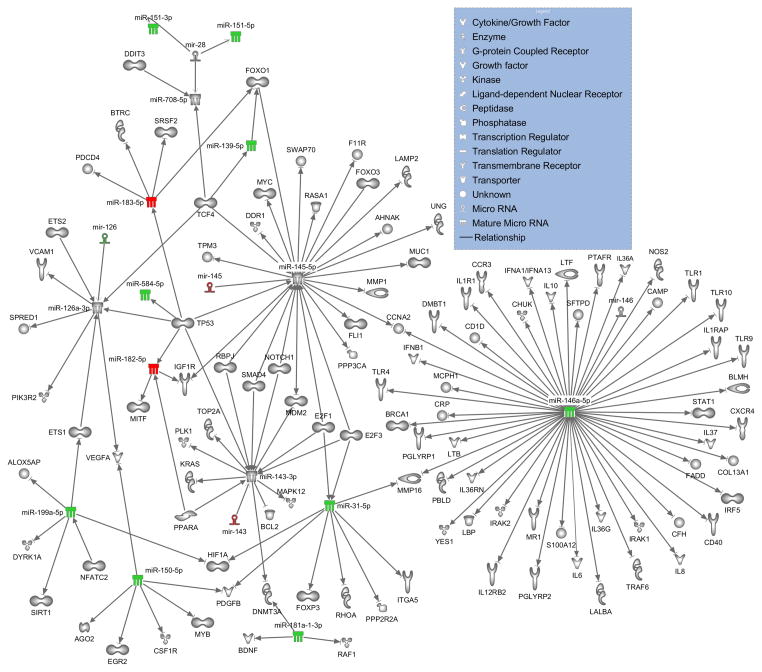
Ingenuity Pathway Analysis revealed that a number of the miRNAs that were more than two-fold up- or down-regulated have targets that can mediate the altered immune response of sepsis patients observed on day 1 (Figure 6). Specifically miR-31, miR-139, miR-143, miR-145, miR-146a, miR-150, miR-181a, miR-182, and miR-199 have direct, experimentally demonstrated associations with mRNA targets that have roles in immunological processes. Several of the notable molecules within this network include: cytokines (IL6, IL-8 and IL-10), toll-like receptors (TLR-1, TLR-4, TLR-9 and TLR-10), and transcription factors (STAT-1, FOXP3 and FOXO3, among many).
Figure 6. Ingenuity pathway analysis of dysregulated miRNAs in sepsis patients and their mRNA targets.
A network wiring diagram of dysregulated miRNAs in PBMC from sepsis patients with more than 2-fold increased or decreased expression and target genes is presented. The miRNAs are color coded as follows: >2 fold up-regulated miRNAs in sepsis patients (red) and >2 fold down-regulated (green). In the case of miR-143, miR145 and miR-126, stem-loop precursors, rather than the mature forms, were found to be alternatively regulated (mature forms are thus left uncolored). All relationships shown represent direct interactions for which experimental evidence is available. Specifically, numerous relationships known to exist for target mRNAs with immunomodulatory activity are represented.
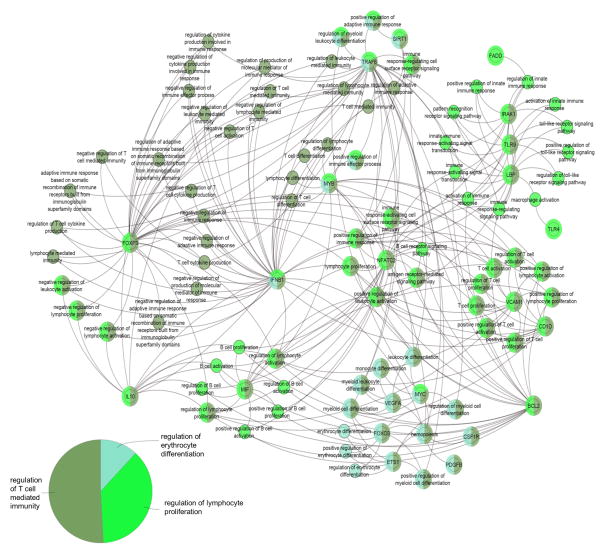
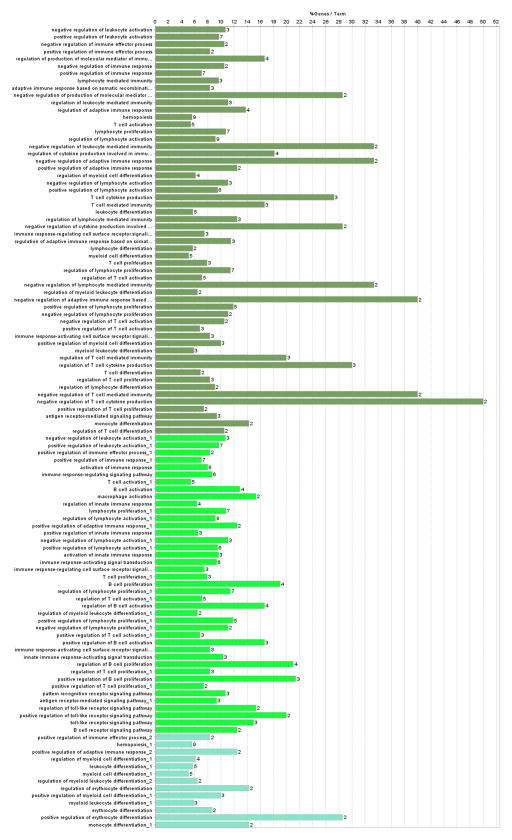
To enable a better understanding of the assembly of targets of altered miRNAs in sepsis patients, bioinformatics pathway analysis was performed using the ClueGo plugin with Cytoscape (Figure 7 and Figure 8) [23]. The biological pathways with the relevant miRNAs from sepsis patients most heavily represented fell under the following broad Gene Ontology terms: regulation of T cell mediated immunity, regulation of lymphocyte proliferation and regulation of erythrocyte differentiation. The most important genes involved among these pathways are noted in the diagram and include: IFNB1, FOXP3, IL-10, NFATC2, VCAM1, BCL2, TLR9, TRAF-6 and IRAK-1, among others.
Figure 7. Biological pathways associated with mRNA targets of differentially regulated miRNAs in sepsis patients.
Direct, experimentally demonstrated relationships for miRNAs with more than 2-fold increased or decreased expression in sepsis patients were plotted using the ClueGo plugin in Cytoscape. The nodes represent either a gene with particular importance in these pathways or Gene Ontology terms, linked based on the overlap of their associated genes as assessed by the kappa score. The size of the nodes correlates with the proportion of associated targets. The pie chart demonstrates the relative importance of the three major categories of biological activity affected by the targets of the dysregulated miRNA. The node color corresponds to each of these biological activities and numerous nodes have overlapping functions.
Figure 8. Biological pathways associated with sepsis patients based on bioinformatics analysis.
The Cytoscape plugin, Cluego, was used to determine the percent of targets associated with each specific gene ontology term (out of all genes known to be associated with the term), which are depicted in the bar graph.
4. Discussion
Sepsis has historically been described as an unbridled inflammatory response, however the inability of anti-inflammatory agents to improve outcome in clinical trials has revealed the need for reinterpretation of the clinical picture [16]. It is now becoming clear that an initial pro-inflammatory phase is followed by a hypoinflammatory phase, leaving patients with diminished ability to clear existing or newly introduced pathogens [24]. Our clinical data from 32 sepsis patients and 38 controls supports this model. Sepsis patients exhibited monocytosis, granulocytosis and leukocytosis, with concurrent lymphopenia. In fact, while PBMCs were increased, CD4+ T cells, CD8+ T cells, B cells, NK cells and NKT cells were reduced. Increases in IL-6 (proinflammatory) and IL-10 (anti-inflammatory) in plasma, as well as increases in the anti-inflammatory Th2 population in stimulated PBMC, further illustrates the dichotomy within the immune system in these sepsis patients. Interestingly, while other studies of sepsis patients have shown increases in Tregs [25], the patients reported herein had very consistent decreases in Tregs on both days tested, a difference that could be attributed to the timing at which samples were drawn after infection.
miRNAs have emerged as significant translational regulators of the immune response to host insults, including sepsis [5]. MicroRNA signatures have recently been found to enable diagnosis of sepsis and prediction of prognosis [26, 27] and may also be valuable targets for treatment of sepsis. As such, we performed miRNA microarray analysis to determine alterations in expression in PBMC from sepsis patients compared to controls and used pathway analysis to determine possible correlations with the clinical data. This investigation revealed that a large proportion of the significantly up- or down-regulated miRNAs in sepsis patients are known to modulate translation of critical immunomodulatory targets.
Key among the dysregulated miRNAs identified in this study is miR-146a, supporting the downregulation observed in a pair of past reports of human sepsis [26, 28]. miR-146a is rich with targets capable of immune modulation. Specifically, miRNA-146a has been shown to regulate IL-6 production in several different in vitro systems including human monocyte and macrophage cells [29, 30]. Several studies have shown that miR-146a modulates inflammatory responses including IL-6 by targeting IRAK-1 and TRAF-6 [31–34]. Here, using the 3′UTR of IL-6 from human sepsis and control patients, we demonstrate that IL-6 levels are inversely correlated with levels of miR-146a in a human monocytic cell line. Thus, the reduced levels of miR-146a in sepsis patients may result in the increased levels of IL-6. Although previous studies have defined the suppression of induction of proinflammatory cytokines in the context of miR-146a targeting of IRAK-1 and TRAF-6, two key elements in the NF-kB proinflammatory signaling pathway [35], reduction of IL-6 could also occur by a direct effect, since the IL-6 3′UTR contains a putative binding site for miR-146a. In the current study, we also noted that the IL-6 levels directly correlated with SOFA scores in sepsis patients. MCP-1 and IL-8 have also been shown to be negatively regulated by miR-146a [36]. Other cytokines are potentially regulated in sepsis by miR-146a as depicted in the Ingenuity Pathway Analysis network diagram, most notably IL-10, which is elevated in sepsis patients in this study.
miR-146a has several other targets that could be critical for the complex immune profile that emerges in sepsis. Of these, the toll-like receptors are thought to be major players in the host response in sepsis [37]. miR-146a can translationally down-regulate IRAK-1 and TRAF-6 thereby inhibiting the downstream effects of TLR4 signaling [29]. CD40 and Stat1 are also targets of miR-146a, with implications in inflammatory cytokine secretion and effector T cell regulation [38, 39].
miR-150 was also identified previously and in this study as having altered regulation in sepsis patients [9, 27, 40]. Previous studies have shown that miR-150 expression is negatively correlated with cytokine levels in sepsis [9]. Colony Stimulating Factor 1 Receptor (CSF1R), the receptor for Macrophage Colony Stimulating Factor (M-CSF), a cytokine involved in the survival, differentiation and proliferation of monocytes and macrophages, is a possible significant target of miR-150 as related to sepsis [41]. miR-155 also has association with sepsis [5] and was reduced by nearly two-fold in the sepsis patients reported here. This miRNA, as well as miR-31 which is also downregulated in this study, could modulate Treg expression by targeting FOXP3 [42].
We used the results from Ingenuity Pathway Analysis of the dysregulated miRNAs in sepsis patients to further explore the biological significance using ClueGo in Cytoscape. The results of this analysis indicated that numerous miRNAs dysregulated in sepsis patients could impact regulation of T cell mediated immunity and lymphocyte proliferation. For example, NFATC2, a member of the nuclear factor of activated T cells, is a key transcription factor in T cell differentiation and activation that can act on miR-199 [43]. miR-199 in turn targets protein C-ets1 (ETS1), which is involved in T effector cell differentiation [44]. Through miR-126, ETS1 can act on vascular endothelial growth factor A (VEGFA), the expression of which is correlated to a downregulation of Tregs [45]. Finally Forkhead Box mRNAs, FOXO1 and FOXO3, transcription factors important for CD4 T cell proliferation and function, are associated with miR-145 and miR-139, which we found to be dysregulated in sepsis patients [46] [47].
5. Conclusion
In conclusion, we have demonstrated that dysregulated miRNAs form critical networks acting in concert on pro- and anti-inflammatory responses in sepsis. These results provide a framework for understanding the mechanism behind the observed clinical features of the disorder. Future studies should address how the miRNAs are alternatively regulated over time in sepsis patients, and correlate the results with the clinical manifestations in hyper- and hypo-inflammatory disease phases.
Highlights.
Sepsis patients had elevated monocytes and plasma IL-6, IL-8, IL-10 and MCP-1.
Th2 cells from sepsis patients increased and Tregs decreased.
miRs-182, -143, -145, 146a, -150 and -155 were dysregulated in sepsis patients.
miR-146a decrease correlated with elevated IL-6 and monocyte proliferation.
Dysregulated miRs have immunological associations with clinical disease in sepsis.
Acknowledgments
This work was supported by National Institute of Health [grant numbers R01 MH094755, P01 AT003961, P20 GM103641, R01 AT006888 and R01 ES019313]; and Veterans Administration Merit Award [grant number BX001357].
Footnotes
Publisher's Disclaimer: This is a PDF file of an unedited manuscript that has been accepted for publication. As a service to our customers we are providing this early version of the manuscript. The manuscript will undergo copyediting, typesetting, and review of the resulting proof before it is published in its final citable form. Please note that during the production process errors may be discovered which could affect the content, and all legal disclaimers that apply to the journal pertain.
References
- 1.Skrupky LP, Kerby PW, Hotchkiss RS. Advances in the management of sepsis and the understanding of key immunologic defects. Anesthesiology. 2011;115:1349–62. doi: 10.1097/ALN.0b013e31823422e8. [DOI] [PMC free article] [PubMed] [Google Scholar]
- 2.Stearns-Kurosawa DJ, Osuchowski MF, Valentine C, Kurosawa S, Remick DG. The pathogenesis of sepsis. Annu Rev Pathol. 2011;6:19–48. doi: 10.1146/annurev-pathol-011110-130327. [DOI] [PMC free article] [PubMed] [Google Scholar]
- 3.Mera S, Tatulescu D, Cismaru C, Bondor C, Slavcovici A, Zanc V, et al. Multiplex cytokine profiling in patients with sepsis. Apmis. 2011;119:155–63. doi: 10.1111/j.1600-0463.2010.02705.x. [DOI] [PubMed] [Google Scholar]
- 4.van Dissel JT, van Langevelde P, Westendorp RG, Kwappenberg K, Frolich M. Anti-inflammatory cytokine profile and mortality in febrile patients. Lancet. 1998;351:950–3. doi: 10.1016/S0140-6736(05)60606-X. [DOI] [PubMed] [Google Scholar]
- 5.Tsitsiou E, Lindsay MA. microRNAs and the immune response. Current opinion in pharmacology. 2009;9:514–20. doi: 10.1016/j.coph.2009.05.003. [DOI] [PMC free article] [PubMed] [Google Scholar]
- 6.O’Connell RM, Kahn D, Gibson WS, Round JL, Scholz RL, Chaudhuri AA, et al. MicroRNA-155 promotes autoimmune inflammation by enhancing inflammatory T cell development. Immunity. 33:607–19. doi: 10.1016/j.immuni.2010.09.009. [DOI] [PMC free article] [PubMed] [Google Scholar]
- 7.Xiao C, Rajewsky K. MicroRNA control in the immune system: basic principles. Cell. 2009;136:26–36. doi: 10.1016/j.cell.2008.12.027. [DOI] [PubMed] [Google Scholar]
- 8.Giza DE, Vasilescu C. MicroRNA’s role in sepsis and endotoxin tolerance. More players on the stage. Chirurgia (Bucur) 2010;105:625–30. [PubMed] [Google Scholar]
- 9.Vasilescu C, Rossi S, Shimizu M, Tudor S, Veronese A, Ferracin M, et al. MicroRNA fingerprints identify miR-150 as a plasma prognostic marker in patients with sepsis. PLoS One. 2009;4:e7405. doi: 10.1371/journal.pone.0007405. [DOI] [PMC free article] [PubMed] [Google Scholar]
- 10.Wang JF, Yu ML, Yu G, Bian JJ, Deng XM, Wan XJ, et al. Serum miR-146a and miR-223 as potential new biomarkers for sepsis. Biochem Biophys Res Commun. 2010;394:184–8. doi: 10.1016/j.bbrc.2010.02.145. [DOI] [PubMed] [Google Scholar]
- 11.Bhaumik D, Scott GK, Schokrpur S, Patil CK, Orjalo AV, Rodier F, et al. MicroRNAs miR-146a/b negatively modulate the senescence-associated inflammatory mediators IL-6 and IL-8. Aging (Albany NY) 2009;1:402–11. doi: 10.18632/aging.100042. [DOI] [PMC free article] [PubMed] [Google Scholar]
- 12.Vincent JL, Moreno R, Takala J, Willatts S, De Mendonca A, Bruining H, et al. The SOFA (Sepsis-related Organ Failure Assessment) score to describe organ dysfunction/failure. On behalf of the Working Group on Sepsis-Related Problems of the European Society of Intensive Care Medicine. Intensive care medicine. 1996;22:707–10. doi: 10.1007/BF01709751. [DOI] [PubMed] [Google Scholar]
- 13.Hegde VL, Tomar S, Jackson A, Rao R, Yang X, Singh UP, et al. Distinct microRNA expression profile and targeted biological pathways in functional myeloid-derived suppressor cells induced by Delta9-tetrahydrocannabinol in vivo: regulation of CCAAT/enhancer-binding protein alpha by microRNA-690. The Journal of biological chemistry. 2013;288:36810–26. doi: 10.1074/jbc.M113.503037. [DOI] [PMC free article] [PubMed] [Google Scholar]
- 14.Zhou J, Nagarkatti P, Zhong Y, Nagarkatti M. Immune modulation by chondroitin sulfate and its degraded disaccharide product in the development of an experimental model of multiple sclerosis. J Neuroimmunol. 2010;223:55–64. doi: 10.1016/j.jneuroim.2010.04.002. [DOI] [PMC free article] [PubMed] [Google Scholar]
- 15.R Core Team. R: A language and environment for statistical computing. R Foundation for Statistical Computing; Vienna, Austria: 2013. http://www.R-project.org. [Google Scholar]
- 16.Hotchkiss RS, Karl IE. The pathophysiology and treatment of sepsis. The New England journal of medicine. 2003;348:138–50. doi: 10.1056/NEJMra021333. [DOI] [PubMed] [Google Scholar]
- 17.Dai R, Ahmed SA. MicroRNA, a new paradigm for understanding immunoregulation, inflammation, and autoimmune diseases. Transl Res. 2011;157:163–79. doi: 10.1016/j.trsl.2011.01.007. [DOI] [PMC free article] [PubMed] [Google Scholar]
- 18.Wang HJ, Lo WY, Lin LJ. Angiotensin-(1–7) decreases glycated albumin-induced endothelial interleukin-6 expression via modulation of miR-146a. Biochem Biophys Res Commun. 2013;430:1157–63. doi: 10.1016/j.bbrc.2012.12.018. [DOI] [PubMed] [Google Scholar]
- 19.Song Z, Yao C, Yin J, Tong C, Zhu D, Sun Z, et al. Genetic variation in the TNF receptor-associated factor 6 gene is associated with susceptibility to sepsis-induced acute lung injury. Journal of translational medicine. 2012;10:166. doi: 10.1186/1479-5876-10-166. [DOI] [PMC free article] [PubMed] [Google Scholar]
- 20.Bennett S, Por SB, Stanley ER, Breit SN. Monocyte proliferation in a cytokine-free, serum-free system. Journal of immunological methods. 1992;153:201–12. doi: 10.1016/0022-1759(92)90323-l. [DOI] [PubMed] [Google Scholar]
- 21.Yu H, Maurer F, Medcalf RL. Plasminogen activator inhibitor type 2: a regulator of monocyte proliferation and differentiation. Blood. 2002;99:2810–8. doi: 10.1182/blood.v99.8.2810. [DOI] [PubMed] [Google Scholar]
- 22.McDevitt TM, Tchao R, Harrison EH, Morel DW. Carotenoids normally present in serum inhibit proliferation and induce differentiation of a human monocyte/macrophage cell line (U937) The Journal of nutrition. 2005;135:160–4. doi: 10.1093/jn/135.2.160. [DOI] [PubMed] [Google Scholar]
- 23.Saito R, Smoot ME, Ono K, Ruscheinski J, Wang PL, Lotia S, et al. A travel guide to Cytoscape plugins. Nature methods. 2012;9:1069–76. doi: 10.1038/nmeth.2212. [DOI] [PMC free article] [PubMed] [Google Scholar]
- 24.Hotchkiss RS, Monneret G, Payen D. Immunosuppression in sepsis: a novel understanding of the disorder and a new therapeutic approach. The Lancet infectious diseases. 2013;13:260–8. doi: 10.1016/S1473-3099(13)70001-X. [DOI] [PMC free article] [PubMed] [Google Scholar]
- 25.Jiang LN, Yao YM, Sheng ZY. The role of regulatory T cells in the pathogenesis of sepsis and its clinical implication. Journal of interferon & cytokine research : the official journal of the International Society for Interferon and Cytokine Research. 2012;32:341–9. doi: 10.1089/jir.2011.0080. [DOI] [PMC free article] [PubMed] [Google Scholar]
- 26.Wang H, Zhang P, Chen W, Feng D, Jia Y, Xie L. Serum microRNA signatures identified by Solexa sequencing predict sepsis patients’ mortality: a prospective observational study. PLoS One. 2012;7:e38885. doi: 10.1371/journal.pone.0038885. [DOI] [PMC free article] [PubMed] [Google Scholar]
- 27.Ma Y, Vilanova D, Atalar K, Delfour O, Edgeworth J, Ostermann M, et al. Genome-Wide Sequencing of Cellular microRNAs Identifies a Combinatorial Expression Signature Diagnostic of Sepsis. PLoS One. 2013;8:e75918. doi: 10.1371/journal.pone.0075918. [DOI] [PMC free article] [PubMed] [Google Scholar]
- 28.Wang L, Wang HC, Chen C, Zeng J, Wang Q, Zheng L, et al. Differential expression of plasma miR-146a in sepsis patients compared with non-sepsis-SIRS patients. Experimental and therapeutic medicine. 2013;5:1101–4. doi: 10.3892/etm.2013.937. [DOI] [PMC free article] [PubMed] [Google Scholar]
- 29.Boldin MP, Taganov KD, Rao DS, Yang L, Zhao JL, Kalwani M, et al. miR-146a is a significant brake on autoimmunity, myeloproliferation, and cancer in mice. J Exp Med. 2011;208:1189–201. doi: 10.1084/jem.20101823. [DOI] [PMC free article] [PubMed] [Google Scholar]
- 30.He Y, Sun X, Huang C, Long XR, Lin X, Zhang L, et al. MiR-146a Regulates IL-6 Production in Lipopolysaccharide-Induced RAW264.7 Macrophage Cells by Inhibiting Notch1. Inflammation. 2013 doi: 10.1007/s10753-013-9713-0. [DOI] [PubMed] [Google Scholar]
- 31.Li S, Yue Y, Xu W, Xiong S. MicroRNA-146a represses mycobacteria-induced inflammatory response and facilitates bacterial replication via targeting IRAK-1 and TRAF-6. PLoS One. 2013;8:e81438. doi: 10.1371/journal.pone.0081438. [DOI] [PMC free article] [PubMed] [Google Scholar]
- 32.Zeng Z, Gong H, Li Y, Jie K, Ding C, Shao Q, et al. Upregulation of miR-146a contributes to the suppression of inflammatory responses in LPS-induced acute lung injury. Experimental lung research. 2013;39:275–82. doi: 10.3109/01902148.2013.808285. [DOI] [PubMed] [Google Scholar]
- 33.Nahid MA, Pauley KM, Satoh M, Chan EK. miR-146a is critical for endotoxin-induced tolerance: IMPLICATION IN INNATE IMMUNITY. The Journal of biological chemistry. 2009;284:34590–9. doi: 10.1074/jbc.M109.056317. [DOI] [PMC free article] [PubMed] [Google Scholar]
- 34.Taganov KD, Boldin MP, Chang KJ, Baltimore D. NF-kappaB-dependent induction of microRNA miR-146, an inhibitor targeted to signaling proteins of innate immune responses. Proceedings of the National Academy of Sciences of the United States of America. 2006;103:12481–6. doi: 10.1073/pnas.0605298103. [DOI] [PMC free article] [PubMed] [Google Scholar]
- 35.Ikeda T, Kumagai E, Iwata S, Yamakawa A. Soluble CD26/Dipeptidyl Peptidase IV Enhances the Transcription of IL-6 and TNF-alpha in THP-1 Cells and Monocytes. PLoS One. 2013;8:e66520. doi: 10.1371/journal.pone.0066520. [DOI] [PMC free article] [PubMed] [Google Scholar]
- 36.Yang K, He YS, Wang XQ, Lu L, Chen QJ, Liu J, et al. MiR-146a inhibits oxidized low-density lipoprotein-induced lipid accumulation and inflammatory response via targeting toll-like receptor 4. FEBS letters. 2011;585:854–60. doi: 10.1016/j.febslet.2011.02.009. [DOI] [PubMed] [Google Scholar]
- 37.Quinn SR, O’Neill LA. A trio of microRNAs that control Toll-like receptor signalling. International immunology. 2011;23:421–5. doi: 10.1093/intimm/dxr034. [DOI] [PubMed] [Google Scholar]
- 38.Lu LF, Boldin MP, Chaudhry A, Lin LL, Taganov KD, Hanada T, et al. Function of miR-146a in controlling Treg cell-mediated regulation of Th1 responses. Cell. 2010;142:914–29. doi: 10.1016/j.cell.2010.08.012. [DOI] [PMC free article] [PubMed] [Google Scholar]
- 39.Chen T, Li Z, Jing T, Zhu W, Ge J, Zheng X, et al. MicroRNA-146a regulates the maturation process and pro-inflammatory cytokine secretion by targeting CD40L in oxLDL-stimulated dendritic cells. FEBS letters. 2011;585:567–73. doi: 10.1016/j.febslet.2011.01.010. [DOI] [PubMed] [Google Scholar]
- 40.Roderburg C, Luedde M, Vargas Cardenas D, Vucur M, Scholten D, Frey N, et al. Circulating microRNA-150 serum levels predict survival in patients with critical illness and sepsis. PLoS One. 2013;8:e54612. doi: 10.1371/journal.pone.0054612. [DOI] [PMC free article] [PubMed] [Google Scholar]
- 41.Stanley ER, Berg KL, Einstein DB, Lee PS, Pixley FJ, Wang Y, et al. Biology and action of colony--stimulating factor-1. Molecular reproduction and development. 1997;46:4–10. doi: 10.1002/(SICI)1098-2795(199701)46:1<4::AID-MRD2>3.0.CO;2-V. [DOI] [PubMed] [Google Scholar]
- 42.Rouas R, Fayyad-Kazan H, El Zein N, Lewalle P, Rothe F, Simion A, et al. Human natural Treg microRNA signature: role of microRNA-31 and microRNA-21 in FOXP3 expression. Eur J Immunol. 2009;39:1608–18. doi: 10.1002/eji.200838509. [DOI] [PubMed] [Google Scholar]
- 43.Liu J, Zhang Z, Bando M, Itoh T, Deardorff MA, Clark D, et al. Transcriptional dysregulation in NIPBL and cohesin mutant human cells. PLoS biology. 2009;7:e1000119. doi: 10.1371/journal.pbio.1000119. [DOI] [PMC free article] [PubMed] [Google Scholar]
- 44.Garrett-Sinha LA. Review of Ets1 structure, function, and roles in immunity. Cellular and molecular life sciences : CMLS. 2013;70:3375–90. doi: 10.1007/s00018-012-1243-7. [DOI] [PMC free article] [PubMed] [Google Scholar]
- 45.Terme M, Pernot S, Marcheteau E, Sandoval F, Benhamouda N, Colussi O, et al. VEGFA-VEGFR pathway blockade inhibits tumor-induced regulatory T-cell proliferation in colorectal cancer. Cancer research. 2013;73:539–49. doi: 10.1158/0008-5472.CAN-12-2325. [DOI] [PubMed] [Google Scholar]
- 46.Luo CT, Li MO. Transcriptional control of regulatory T cell development and function. Trends in immunology. 2013 doi: 10.1016/j.it.2013.08.003. [DOI] [PMC free article] [PubMed] [Google Scholar]
- 47.Ji F, Chen R, Liu B, Zhang X, Han J, Wang H, et al. BAFF induces spleen CD4+ T cell proliferation by down-regulating phosphorylation of FOXO3A and activates cyclin D2 and D3 expression. Biochem Biophys Res Commun. 2012;425:854–8. doi: 10.1016/j.bbrc.2012.08.003. [DOI] [PubMed] [Google Scholar]
- 48.Salomone T, Tosi P, Di Battista N, Binetti N, Raiti C, Tomassetti P, et al. Impaired alveolar gas exchange in acute pancreatitis. Dig Dis Sci. 2002;47:2025–8. doi: 10.1023/a:1019668728058. [DOI] [PubMed] [Google Scholar]
- 49.Lim EM, Cembrowski G, Cembrowski M, Clarke G. Race-specific WBC and neutrophil count reference intervals. Int J Lab Hematol. 2010;32:590–7. doi: 10.1111/j.1751-553X.2010.01223.x. [DOI] [PubMed] [Google Scholar]
- 50.Horn PL, Pyne DB, Hopkins WG, Barnes CJ. Lower white blood cell counts in elite athletes training for highly aerobic sports. European journal of applied physiology. 2010;110:925–32. doi: 10.1007/s00421-010-1573-9. [DOI] [PubMed] [Google Scholar]
- 51.Ardron MJ, Westengard JC, Dutcher TF. Band neutrophil counts are unnecessary for the diagnosis of infection in patients with normal total leukocyte counts. American journal of clinical pathology. 1994;102:646–9. doi: 10.1093/ajcp/102.5.646. [DOI] [PubMed] [Google Scholar]
- 52.Dragomirescu T, Siara C, Ghitescu M, Antonescu M, Baglagian M, Flavian L, et al. Normal values of the neutrophil granulocyte adhesion test in the peripheral blood of adults. Rev Ig Bacteriol Virusol Parazitol Epidemiol Pneumoftiziol Bacteriol Virusol Parazitol Epidemiol. 1978;23:221–30. [PubMed] [Google Scholar]
- 53.Ferrarini M, Ferrero E, Fortis C, Poggi A, Zocchi MR. LAK1 antigen defines two distinct subsets among human tumour infiltrating lymphocytes. British journal of cancer. 1990;62:754–7. doi: 10.1038/bjc.1990.372. [DOI] [PMC free article] [PubMed] [Google Scholar]
- 54.Sato H, Shiobara S, Yasue S, Chuhjo T, Nakao S. Lymphocyte collection for donor leucocyte infusion from normal donors: estimation of the minimum processed blood volume and safety of the procedure. Vox Sang. 2001;81:124–7. doi: 10.1046/j.1423-0410.2001.00091.x. [DOI] [PubMed] [Google Scholar]
- 55.Okamoto H, Mizuno K, Horio T. Circulating CD14+ CD16+ monocytes are expanded in sarcoidosis patients. The Journal of dermatology. 2003;30:503–9. doi: 10.1111/j.1346-8138.2003.tb00424.x. [DOI] [PubMed] [Google Scholar]


