

Abstract
Mild Cognitive Impairment (MCI) is a transitional stage between normal aging and dementia and people with MCI are at high risk of progression to dementia. MCI is attracting increasing attention, as it offers an opportunity to target the disease process during an early symptomatic stage. Structural magnetic resonance imaging (MRI) measures have been the mainstay of Alzheimer’s disease (AD) imaging research, however, ventricular morphometry analysis remains challenging because of its complicated topological structure. Here we describe a novel ventricular morphometry system based on the hyperbolic Ricci flow method and tensor-based morphometry (TBM) statistics. Unlike prior ventricular surface parameterization methods, hyperbolic conformal parameterization is angle-preserving and does not have any singularities. Our system generates a one-to-one diffeomorphic mapping between ventricular surfaces with consistent boundary matching conditions. The TBM statistics encode a great deal of surface deformation information that could be inaccessible or overlooked by other methods. We applied our system to the baseline MRI scans of a set of MCI subjects from the Alzheimer’s Disease Neuroimaging Initiative (ADNI: 71 MCI converters vs. 62 MCI stable). Although the combined ventricular area and volume features did not differ between the two groups, our fine-grained surface analysis revealed significant differences in the ventricular regions close to the temporal lobe and posterior cingulate, structures that are affected early in AD. Significant correlations were also detected between ventricular morphometry, neuropsychological measures, and a previously described imaging index based on fluorodeoxyglucose positron emission tomography (FDG-PET) scans. This novel ventricular morphometry method may offer a new and more sensitive approach to study preclinical and early symptomatic stage AD.
Keywords: Alzheimer’s disease, mild cognitive impairment, hyperbolic Ricci flow, tensor-based morphometry
1. INTRODUCTION
Mild Cognitive Impairment (MCI) describes individuals who cognitively lie between normal aging and dementia, and MCI often progresses to Alzheimer’s disease (AD). The prevalence of MCI is as high as 19% in persons over age 65, and 29% in those over age 85 (Small et al., 2009). Also, a significant portion of the population diagnosed with life limiting illnesses (LLI) has therapeutic exposures that place them at risk for MCI. As MCI has the greatest risk of progression to dementia, it is a primary focus of interest in aging studies (Roberts et al., 2010). The International Classification of Diseases now has a billing code for MCI (331.83) (ICD, 2010). Over half of those with MCI progress to dementia within 5 years (Gauthier et al., 2006), and early detection of those MCI individuals who will convert to dementia can facilitate earlier intervention, and guide recruitment for clinical trials. Current therapeutic failures in patients with symptomatic memory loss might reflect intervention that is too late, or targets that are secondary effects and less relevant to disease initiation and early progression (Hyman, 2011).
As the paradigm in AD research shifts to a new stage, targeting earlier intervention and prevention (Caselli and Reiman, 2013; Langbaum et al., 2013), there is a requirement for biologically grounded, highly objective biomarkers that can help to identify those high AD risk MCI individuals for whom early intervention may be most appropriate. Various neuroimaging techniques can track disease progression and therapeutic efficacy in MCI (Caroli et al., 2012; Chen et al., 2011; Matsuda, 2007b; Petersen, 2011; Petersen and Jack, 2009; Pihlajamaki et al., 2009; Small et al., 2006; Wolf et al., 2003) and others are beginning to identify abnormal anatomical or functional patterns and their rates of decline. Structural magnetic resonance imaging (MRI) has been the mainstay of AD imaging research and has included evaluations of whole-brain (Chen et al., 2007; Fox et al., 1999; Stonnington et al., 2010), entorhinal cortex (Cardenas et al., 2011), hippocampus (Apostolova et al., 2010b; den Heijer et al., 2010; Jack et al., 2003; Jack et al., 2010; Reiman et al., 1998; Thompson et al., 2004a; Wolz et al., 2010), and temporal lobe volumes (Hua et al., 2010), as well as ventricular enlargement (Jack et al., 2003; Jack et al., 2008; Thompson et al., 2004a; Wang et al., 2011). These correlate closely with differences and changes in cognitive performance, supporting their validity as markers of disease progression. Among these biomarkers, ventricular enlargement is a very important measure of AD progression (Frisoni et al., 2010). Owing to the high contrast between the CSF and surrounding brain tissue on T1-weighted images, lateral ventricles can be measured more reliably than hippocampus or other structures, whose boundaries are difficult for experts to agree on (Chou et al., 2010). Furthermore, lateral ventricles span a large area within the cerebral hemispheres and abut several structures relevant to AD including the hippocampus, amygdala and posterior cingulate. Changes in ventricular morphology, such as enlargement, often reflect atrophy of the surrounding cerebral hemisphere which itself may be regionally differentiated (for example, frontotemporal in contrast to posterior cortical atrophy). Regional differences in cerebral atrophy may be reflected in specific patterns of change in ventricular morphology, so accurate analysis of ventricular morphology has the potential to both sensitively and specifically characterize a neurodegenerative process.
Many brain imaging based AD studies examine cortical and subcortical volumes (den Heijer et al., 2010; Dewey et al., 2010; Holland et al., 2009; Jack et al., 2004; Jack et al., 2003; Ridha et al., 2008; Vemuri et al., 2008a; Vemuri et al., 2008b; Wolz et al., 2010), but recent research (Apostolova et al., 2010a; Apostolova et al., 2010b; Chou et al., 2009a; Costafreda et al., 2011; Ferrarini et al., 2008b; Madsen et al., 2010; McEvoy et al., 2009; Morra et al., 2009; Qiu et al., 2010; Styner et al., 2005; Tang et al., 2014; Thompson et al., 2004a) has demonstrated that surface-based analyses can offer advantages over volume measures, due to their sub-voxel accuracy and the capability of detecting subtle subregional changes. Higher-order correspondences between brain surfaces are often required to be established in order to statistically compare or combine surface data obtained from different people, or at different time-points. Usually, brain surface registration is done by first mapping the surfaces to be matched onto one common canonical parameter domain, such as a sphere (Fischl et al., 1999b; Thompson et al., 2004b), or a planar rectangle (Shi et al., 2013a), and then registering the surfaces in the simpler parameter domain. The one-to-one correspondences obtained in the parameter domain induce the registration of the 3D brain surfaces. However, it is challenging to apply this framework to ventricular surfaces, due to their concave shape, complex branching topology and extreme narrowness of the inferior and occipital horns. Thus, surface-based subregional analysis of ventricular enlargement is notoriously difficult to assess, exemplified by the conflicting findings regarding genetic influences on ventricular volumes (Chou et al., 2009b; Kremen et al., 2012). Pioneering ventricular morphometry work (Paniagua et al., 2013; Styner et al., 2005) used spherical harmonics to analyze ventricular surfaces where each ventricular surface was mapped to a sphere and registered to a common template. However, as demonstrated previously (Wang et al., 2010), this spherical parameterization method may result in significant shape distortion that affects the analysis. Our prior work (Wang et al., 2007; Wang et al., 2011; Wang et al., 2010) computed the first global conformal parameterization of lateral ventricular surfaces based on holomorphic 1-forms. However, this conformal parameterization method always introduces a singularity point (zero point, Fig. 9 (a)) in the resulting parameter domain. As a result, each ventricular surface had to be partitioned into three pieces with respect to the zero point, the superior horn, the inferior horn, and the occipital horn. These three pieces were mapped to three planar rectangles and registered across subjects separately. To model a topologically complicated ventricular surface, hyperbolic conformal geometry emerges naturally as a candidate method. Hyperbolic conformal geometry has an important property that it can induce conformal parameterizations on high-genus surfaces or surfaces with negative Euler numbers and the resulting parameterizations have no singularities (Luo et al., 2008). Motivated by recent advances in hyperbolic conformal geometry based brain imaging research (Shi et al., 2013d; Tsui et al., 2013), including our own work (Shi et al., 2012; Wang et al., 2009b; Wang et al., 2009c), here we propose to use the hyperbolic Ricci flow method to build the canonical parameter domain for ventricular surface registration. The resulting parameterizations are angle-preserving and have no singularity points. After surface registration across subjects, surface deformations are measured by the tensor-based morphometry (TBM) (Chung et al., 2008; Chung et al., 2003b; Davatzikos, 1996; Thompson et al., 2000), which quantifies local surface area expansions or shrinkages. The Ricci flow method is theoretically sound and computationally efficient (Jin et al., 2008; Wang et al., 2006; Wang et al., 2012). In addition, TBM has been used extensively to detect regional differences in surface and volume brain morphology between groups of subjects (Chung et al., 2003b; Hua et al., 2011; Leow et al., 2009; Shi et al., 2014; Shi et al., 2013a; Shi et al., 2013b; Wang et al., 2012; Wang et al., 2011; Wang et al., 2013b). We hypothesize that the hyperbolic Ricci flow together with TBM may offer a set of accurate surface statistics for ventricular morphometry and that it may boost statistical power to detect the subtle difference between MCI patients who progress to dementia from those who fail to progress.
Figure 9.

Lateral ventricular surface parameterization with a method based on holomorphic 1-forms (Wang et al., 2009d). Due to the property of holomorphic 1-forms, the ventricular surface parameterization has a zero point (a). In (Wang et al., 2009d), the ventricular surface was segmented with curves traced from the zero point and each horn was mapped to the parameter domain and registered separately (b). After registering each part separately and merging them back together, the ventricular surface has a hole at the zero point position (c). Surface registration is also affected by the locations of the cuts that divide a ventricular surface into three parts (d).
In this paper, we develop a ventricular morphometry system based on hyperbolic Ricci flow and TBM statistic and use it to study ventricular structural differences associated with baseline T1-weighted brain images from the ADNI dataset, including 71 patients who developed incident AD during the subsequent 36 months (MCI converter group) and 62 patients who did not during the same period (MCI stable group). These subjects were also selected based on the availability of fluorodeoxyglucose positron emission tomography (FDG-PET) data and cognitive assessment information. Here we set out to test whether our new system can detect subtle MCI conversion related changes and whether the new statistics are correlated with FDG-PET biomarkers and other cognitive measures.
2. SUBJECTS AND METHODS
2.1. Subjects
Data used in the preparation of this article were obtained from the Alzheimer’s Disease Neuroimaging Initiative (ADNI) database (adni.loni.usc.edu). The ADNI was launched in 2003 by the National Institute on Aging (NIA), the National Institute of Biomedical Imaging and Bioengineering (NIBIB), the Food and Drug Administration (FDA), private pharmaceutical companies and non-profit organizations, as a $60 million, 5-year public private partnership. The primary goal of ADNI has been to test whether serial magnetic resonance imaging (MRI), positron emission tomography (PET), other biological markers, and clinical and neuropsychological assessment can be combined to measure the progression of mild cognitive impairment (MCI) and early Alzheimer’s disease (AD). Determination of sensitive and specific markers of very early AD progression is intended to aid researchers and clinicians to develop new treatments and monitor their effectiveness, as well as lessen the time and cost of clinical trials.
The Principal Investigator of this initiative is Michael W. Weiner, MD, VA Medical Center and University of California – San Francisco. ADNI is the result of efforts of many coinvestigators from a broad range of academic institutions and private corporations, and subjects have been recruited from over 50 sites across the U.S. and Canada. The initial goal of ADNI was to recruit 800 subjects but ADNI has been followed by ADNI-GO and ADNI-2. To date, these three protocols have recruited over 1500 adults, ages 55 to 90, to participate in the research, consisting of cognitively normal older individuals, people with early or late MCI, and people with early AD. The follow up duration of each group is specified in the protocols for ADNI-1, ADNI-2 and ADNI-GO. Subjects originally recruited for ADNI-1 and ADNI-GO had the option to be followed in ADNI-2. For up-to-date information, see www.adni-info.org.
Based on the availability of both volumetric MRI and FDG-PET data, we selected 133 subjects from the MCI group in the ADNI baseline dataset, including 71 subjects (age: 74.77 ± 6.81) who developed incident AD during the subsequent 36 months, which we call the MCI converter group, and 62 subjects (age: 75.42 ± 7.83 years) who did not during the same period, which we call the MCI stable group. These subjects were chosen on the basis of having at least 36 months of longitudinal data. If a subject developed incident AD more than 36 months after baseline, it was assigned to the MCI stable group. All subjects underwent thorough clinical and cognitive assessment at the time of acquisition, including the Mini-Mental State Examination (MMSE) score (Folstein et al., 1975), Alzheimer’s disease assessment scale – Cognitive (ADAS-COG) (Rosen et al., 1984) and Auditory Verbal Learning Test (AVLT) (Rey, 1964). The demographic information of the subjects is in Table 1.
Table 1.
Demographic information of studied MCI subjects in ADNI baseline dataset.
| Gender (M/F) | Education | Age | MMSE at Baseline | |
|---|---|---|---|---|
| MCI Converter (n = 71) | 45/26 | 15.99 ± 2.73 | 74.77 ± 6.81 | 26.83 ± 1.60 |
| MCI Stable (n = 62) | 44/18 | 15.87 ± 2.76 | 75.42 ± 7.83 | 27.66 ± 1.57 |
2.2. System Pipeline Overview
Here we briefly overview the processing procedures in our ventricular morphometry system. Following sections are detailed explanations of each step.
Figure 1 summarizes the overall sequence of steps in the system. First, from each MRI scan (a), we automatically segment lateral ventricular volumes with the multi-atlas fluid image alignment (MAFIA) method (Chou et al., 2010). The MR image overlaid with the segmented ventricle is shown in (b). A ventricular surface built with marching cube algorithm (Lorensen and Cline, 1987) is shown in (c). Lateral ventricle segmentation and surface reconstruction will be introduced in Sec. 2.3. After the topology optimization, we apply hyperbolic Ricci flow method on the ventricular surface and conformally map it to the Poincaré disk. The concepts of topology optimization and Poincaré disk model will be introduced in Sec. 2.4. Details about conformal parameterization with hyperbolic Ricci flow and embedding in Poincaré disk are in Sec. 2.5 and 2.6, respectively. On the Poincaré disk, we compute consistent geodesics and project them back to the original ventricular surface, a method called geodesic curve lifting. The results are shown in (d). Further, we convert the Poincaré model to the Klein model where the ventricular surfaces are registered by the constrained harmonic map (Zeng et al., 2010). The registration diagram is shown in (e). Geodesic curve lifting and surface registration will be detailed in Sec. 2.7. Next, we compute the TBM features and smooth them with the heat kernel method (Chung et al., 2005b) (f). TBM computation and its smoothing are in Sec. 2.8. Finally, the smoothed TBM features are applied to analyze both group difference between the two MCI groups and correlation of ventricular shape morphometry with cognitive test scores and FDG-PET index. Significance p-maps are used to visualize local shape differences or correlations (g). Correction for multiple comparisons is used to estimate the overall significance (corrected p-values).
Figure 1.

A chart showing the key steps in the ventricular surface registration method. After the lateral ventricles were segmented from MRI scans and surfaces were reconstructed, we computed consistent geodesic curves on each ventricular surface to constrain the registration. Then the constrained harmonic map was used to obtain a correspondence field in the parameter domain represented by the Klein model, which also induced a surface registration in 3D. The statistic of TBM was computed on each point of the resulting matched surfaces. Finally the smoothed TBM features are applied to analyze both group difference between the two MCI groups and correlation of ventricular shape morphometry with cognitive test scores and FDG-PET index.
2.3. Image Acquisition and Preprocessing
High-resolution brain structural MRI scans were acquired at multiple ADNI sites using 1.5 Tesla MRI scanners manufactured by General Electric Healthcare, Siemens Medical Solutions, and Philips Medical Systems. For each subject, the T1-weighted MRI scan was collected with a sagittal 3D MP-RAGE sequence. Typical 1.5T acquisition parameters are repetition time (TR) of 2,400 ms, minimum full excitation time (TE), inversion time (TI) of 1,000 ms, flip angle of 8°, 24 cm field of view. The acquisition matrix was 192 × 192 × 166 in the x, y, and z dimensions and the voxel size was 1.25 × 1.25 × 1.2 mm3. In-plane, zero-filled reconstruction (i.e., sinc interpolation) generated a 256 × 256 matrix for a reconstructed voxel size of 0.9375 × 0.9375 × 1.2 mm3.
The T1-weighted images from ADNI baseline dataset were automatically skull-stripped with the BrainSuite Extraction Software (Shattuck and Leahy, 2002). Then the imperfections in this automatic segmentation procedure were corrected manually. In order to adjust for global differences in brain positioning and scaling, the segmented images were normalized to the ICBM space with a 9-parameter (3 translations, 3 rotations, and 3 scales) linear transformation obtained by the Minctracc algorithm (Collins et al., 1994). After resampling into an isotropic space of 2203 voxels with the resolution 1mm × 1 mm × 1 mm, the registered images were then histogram-matched to equalize image intensities across subjects. Finally, the lateral ventricular volumes were extracted using the multi-atlas fluid image alignment (MAFIA) method that combines multiple fluid registrations to boost accuracy (Chou et al., 2010). Briefly, in the MAFIA method, 6 MRI scans (2 AD, 2 MCI, and 2 normal) after preprocessing were randomly chosen from the ADNI baseline dataset. The lateral ventricles were manually traced in these 6 images following the delineation protocol described in http://resource.loni.usc.edu/resources/downloads/research-protocols/segmentation/lateral-ventricle-delineation. These labeled images are called atlases and segmentation of lateral ventricles in other unlabeled images was done by fluidly registering the atlases to all other images. For details of this method, please refer to (Chou et al., 2010).
After obtaining the binary segmentations of the lateral ventricles, we used a topology-preserving level set method (Han et al., 2003) to build surface models. Based on that, the marching cube algorithm (Lorensen and Cline, 1987) was applied to construct triangular surface meshes. Then, in order to reduce the noise from MR image scanning and to overcome the partial volume effects, surface smoothing was applied consistently to all surfaces. Our surface smoothing process consists of mesh simplification using “progressive meshes” (Hoppe, 1996) and mesh refinement by Loop subdivision surface (Loop, 1987). The similar procedures were frequently adopted in a number of our prior works (Colom et al., 2013; Luders et al., 2013; Monje et al., 2013; Shi et al., 2014; Shi et al., 2013a; Shi et al., 2013b; Wang et al., 2011; Wang et al., 2010) and our experience showed that the smoothed meshes are accurate approximations to the original surfaces with higher signal-to-noise ratio (SNR) (Shi et al., 2013a).
2.4. Theoretical Background
This section briefly introduces the theoretical background necessary for the current work.
Conformal deformation
Let S be a surface in ℝ3 with a Riemannian metric g induced from the Euclidean metric. Let u: S → ℝ be a scalar function defined on S. It can be verified that g̃ = e2ug is also a Riemannian metric on S and angles measured by g̃ are equal to those measured by g, i.e. the induced mapping is angle-preserving. Thus, g̃ is called a conformal deformation of g and u is called the conformal factor. Furthermore, when surface metrics change, the Gaussian curvature K of the surface will change accordingly and become K̃ = e−2u(−Δgu + K), where Δg is the Laplace-Beltrami operator under the original metric g. The geodesic curvature kg will become , where r is the tangent vector orthogonal to the boundary. The total curvature of the surface is determined by its topology with the Gauss-Bonnet theorem (Do Carmo, 1976): ∫SK dA + ∫∂Skgds = 2πχ(S), where dA is the surface area element, ∂S is the boundary of S, ds is the line element, and χ(S) is the Euler characteristic number of S.
Uniformization theorem
Given a surface S with Riemannian metric g, there exist an infinite number of metrics that are conformal to g. The uniformization theorem states that, among all conformal metrics, there exists a unique representative which induces constant Gaussian curvature everywhere. Moreover, the constant will be one of {+1, 0, −1}. Therefore, we can embed the universal covering space of any closed surface using its uniformization metric onto one of the three canonical spaces: the unit sphere
 for genus-0 surfaces with positive Euler characteristic numbers; the plane
 for genus-1 surfaces with zero Euler characteristic numbers; the hyperbolic space
 for high-genus surfaces with negative Euler characteristic numbers. Accordingly, we can say that surfaces with positive Euler numbers admit spherical geometry; surfaces with zero Euler numbers admit Euclidean geometry; and surfaces with negative Euler numbers admit hyperbolic geometry.
Topology optimization
Due to the concave and branching shape of the ventricular surfaces, it is difficult to find a conformal grid for the entire structure without introducing significant area distortions. Here, as in prior studies (Wang et al., 2011; Wang et al., 2010), we automatically located and introduced three cuts on each ventricular surface, with one cut on the superior horn, one cut on the inferior horn, and one cut on the occipital horn. The locations of the cuts are motivated by examining the topology of the lateral ventricles, in which several horns are joined together at the ventricular “atrium” or “trigone”. Meanwhile, we kept the locations of the cuts consistent across subjects. This operation is called as topology optimization (Wang et al., 2011; Wang et al., 2010). After being modeled in this way, each ventricular surface becomes a genus-0 surface with 3 boundaries and is homotopic to a pair of topological pants, as shown in Fig. 2 (a). Figure 4 (a) shows two different views of a ventricular surface with the three boundaries, which are denoted as γ1, γ2, γ3. As a result, each ventricular surface has the Euler characteristic number −1, which means that it admits the hyperbolic geometry. In our work, we try to compute conformal mappings from ventricular surfaces to the hyperbolic space
and use it as the canonical parameter space to register ventricular surfaces.
Figure 2.

Illustration of hyperbolic geometry. (a) is a pair of topological pants with three boundaries γ1, γ2, γ3. τ1, τ2 are automatically traced paths connecting γ1 to γ2, γ1 to γ3, respectively. After slicing along τ1, τ2, the topological pants can be conformally mapped to the hyperbolic space and isometrically embedded in the topological disk of fundamental domain, as shown in (b). (c) is an illustration of the Poincaré disk model. (d) is a saddle plane which has constant negative Gaussian curvatures with a hyperbolic triangle.
Figure 4.

A chart showing the computation of geodesic curves for a ventricular surface. After introducing one cut on each horn by topology optimization, the ventricular surface became a genus-0 surface with 3 boundaries, which is homotopic to a pair of topological pants (a). We traced two paths connecting consistent endpoints of the boundaries, i.e., the endpoint pair with the same color (b). We then computed the hyperbolic metric of the ventricular surface with hyperbolic Ricci flow and isometrically embedded it onto the Poincaré disk. (c) is the topological disk fundamental domain, which was obtained by slicing (b) along the paths and embedding it on the Poincaré disk with the hyperbolic metric. (d) is a portion of the universal covering space of the ventricular surface, tiled by 5 fundamental domains, which were obtained with the deck transformation group generators. In (d), we computed geodesic curves, i.e., hyperbolic circle arcs (e). The geodesic curves were consistent across subjects as we constrained them to connect consistent endpoints of existing geodesics γ1, γ2, γ3. (f) shows a zoomed view of the geodesic curves. After slicing the universal covering space along the geodesic curves, we got a consistent fundamental domain for each ventricular surface, which we call the canonical fundamental domain (g). Finally, we converted (g) to the Klein model (h), which is a Euclidean polygon. The Klein model was used as the canonical parameter space for ventricular surface registration.
Poincaré disk model
As the hyperbolic space cannot be realized in ℝ3, we use the Poincaré disk model to visualize it. The Poincaré disk is the unit disk |z| < 1, z = x + iy in the complex plane with the metric . The rigid motion in the Poincaré disk1 is the Möbius transformation:
| (1) |
A hyperbolic line (a geodesic) in the Poincaré disk is a circular arc which is perpendicular to the unit circle |z| = 1. A hyperbolic circle circ(c, r) (c is the center and r is the radius) looks like a Euclidean circle Circ(C, R), with , and , where . Figure 2 (c) shows an illustration of the Poincaré disk. In order to map the ventricular surfaces to the hyperbolic Poincaré disk, we automatically traced two paths, τ1 connecting γ1 and γ2 and τ2 connecting γ1 and γ3, respectively, as shown in Fig. 4 (b). Initially, the locations of the paths were not required to be consistent across subjects. But they were required to connect consistent ends of γ1, γ2, γ3 for consistent surface mappings to be discussed in Sec. 2.7. As shown in Fig. 4 (a–b), endpoints with same colors were connected to each other. After slicing along the paths, a ventricular surface became a simply connected domain, which we call a topological disk. Figure 2 (b) is an illustration of the topological disk of the topological pants in Fig. 2 (a), which provides the fundamental domain when embedded in the Poincaré disk.
In practice, surfaces are represented by triangular meshes. If a surface admits hyperbolic geometry, all triangles on it are hyperbolic triangles. As an illustration of the hyperbolic geometry, Fig. 2 (d) shows a saddle-shape plane which has constant negative Gaussian curvatures with a hyperbolic triangle.
2.5. Hyperbolic Ricci Flow
In this work we use the surface Ricci flow method (Jin et al., 2008; Wang et al., 2009c; Wang et al., 2006; Wang et al., 2012; Zeng et al., 2010) to conformally project the ventricular surfaces to the hyperbolic space and isometrically embed them in the Poincaré disk. We call this method the hyperbolic Ricci flow method.
Ricci flow is a powerful curvature flow method, which was first introduced in (Hamilton, 1988). Let S be a smooth surface with Riemannian metric g(gij), the Ricci flow deforms the metric g(t) according to the Gaussian curvature K(t) (induced by the metric itself),
| (2) |
where t is the time parameter. Eq. (2) states that the metric should change according to the Gaussian curvature, so that the curvature evolves like a heat diffusion process. There is an analogy between the Ricci flow and heat diffusion. Suppose T(t) is a temperature field on the surface, the heat diffusion equation is , where Δg is the Laplace-Beltrami operator induced by the surface metric. The temperature field becomes more and more uniform with the increase in t, and it will become constant eventually. In a physical sense, the curvature evolution induced by the Ricci flow is exactly the same as the heat diffusion on the surface as , where Δg(t) is the Laplace-Beltrami operator induced by the metric g(t). For the proof of this analogy, please refer to (Wang et al., 2012).
With conformal mapping, which requires g(t) = e2u(t)g(0), we have a simplified Ricci flow equation
| (3) |
the derivation of Eq. (3) can be found in (Wang et al., 2012).
In engineering field, surfaces are approximated by triangular meshes. Major concepts such as metric, curvature, Ricci flow, etc., which were introduced above in the continuous setting, need to be generalized to the discrete setting. Suppose M(V, E, F) is a triangular mesh, with the vertex set V, edge set E, and face set F. We define vi the i th vertex, [vi, vj] the edge connecting vertices vi and vj, and [vi, vj, vk] the face formed by vi, vj, vk. The discrete Riemannian metric on M is a function defined on each edge l: E → R+ such that in each face [vi, vj, vk], the triangle inequality holds li + lj > lk. Usually, it is the edge length. As shown in Fig. 3 (a), the corner angles in each face are determined by the metric according to the hyperbolic cosine law:
| (4) |
Figure 3.
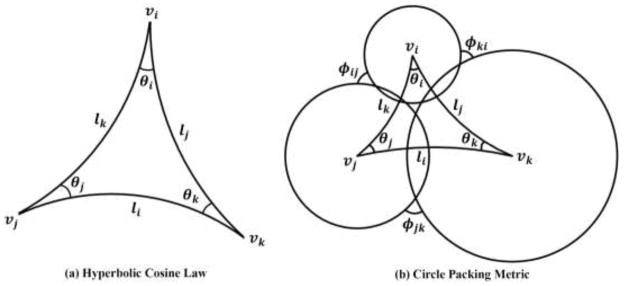
Illustration of the hyperbolic cosine law (a) and visualization of the circle packing metric on a hyperbolic triangle (b).
Let fijk be the face formed by vi, vj, vk, and the corner angle at vi in this face, the discrete Gaussian curvature on vi can be defined by the angle deficit:
| (5) |
The discrete Gaussian curvature definition is an approximation of that in the continuous setting, for the derivation, please refer to (Gu and Yau, 2008). Accordingly, the Gauss-Bonnet theorem also holds for the discrete meshes Σvi∈VKi = 2πχ(M) (Do Carmo, 1976).
By definition, the conformal deformation maps infinitesimal circles in one surface to infinitesimal circles in another and preserves angles among the circles. The discrete conformal deformation uses circles with finite radii to approximate the infinitesimal circles. The concept of the circle packing metric was introduced in (Thurston, 1976) and later adopted by Hurdal and Stephenson in their discrete cortical conformal flattening work (Hurdal and Stephenson, 2004, 2009). Figure 3 (b) shows a hyperbolic triangle together with three circles centered at its three vertices. Let Γ be a function defined on vertices Γ: V → ℝ+, which assigns a radius γi to vertex vi. Similarly, let Φ be a function defined on edges , which assigns an acute angle ϕij to edge eij and is called a weight function of the edge. The pair of vertex radius function and edge weight function, (Γ, Φ), is called the circle packing metric of M. As shown in (Stephenson, 2005; Wang et al., 2012; Zeng et al., 2010), the circles in the circle packing metric are not necessarily tangent to each other, they can intersect (Wang et al., 2012), or not intersect at all (Zeng et al., 2010). As shown in Fig. 3 (b), for each triangle [vi, vj, vk], one can compute the Riemannian metrics by the hyperbolic cosine law:
| (6) |
Let U:V → ℝ be the discrete conformal factor and (Jin et al., 2008; Zeng et al., 2010),
| (7) |
we define the discrete Ricci flow as
| (8) |
The discrete Ricci flow is in the exact same form as the smooth Ricci flow (Eq. 3). Let U = (u1, u2, … , un) be the conformal factor vector, where n is the number of vertices on M, and U0 = (0, 0, …, 0), then the discrete hyperbolic Ricci energy is defined as (Jin et al., 2008)
| (9) |
Given the definitions (4), (6) and (7), by direct computations, we get . Considering the definition of Ki (Eq. 5), immediately we get . Thus, the differential 1-form is closed as dω = 0. This proves that the hyperbolic Ricci energy (Eq. 9) is convex and its unique global minimum corresponds to the hyperbolic metric with zero vertex Gaussian curvatures. The discrete Ricci flow is the negative gradient flow of the hyperbolic Ricci energy.
The algorithm with gradient descent is summarized as following:
Compute the initial radius γi for each vertex vi, and weight ϕij for each edge eij with the hyperbolic cosine law;
Set the target Gaussian curvature as zero;
Compute edge lengths with Eq. (6), face corner angles with Eq. (4), and the Gaussian curvature with Eq. (5).
Update ui for each vertex vi with Eq. (8) as ui+1 = ui − 2ΔtKi.
Update γi with Eq. (7).
Repeat steps (3) to (5) until the final Gaussian curvature is no greater than a user-specified error tolerance.
Instead of gradient descent, the Ricci energy (Eq. 9) can also be optimized by Newton’s method (Jin et al., 2008; Wang et al., 2012), which requires compute the Hessian matrix. Let H = (hij) be the Hessian matrix, then
In our experiments, we have used the Newton’s method to optimize the Ricci energy, which is stable and fast. For a ventricular surface with more than 50K vertices, the optimization took less than 30 seconds on a 2.66 GHz Intel Quad CPU Q8400 PC with Windows 7 64-bit operating system.
2.6. Embedding into the Poincaré Disk Model
After computing the discrete hyperbolic metric of a surface, we can embed this surface into the Poincaré disk. In the beginning, we select a seed face f012 and compute the positions of the vertices v0, v1, v2 in the Poincaré disk as following:
Then we propagate the embedding to other faces. We put all un-embedded faces adjacent to the current face into a queue. We pop a face fijk from the queue and check whether all its vertices have been embedded. If so, we continue to pop the next face from the queue. Otherwise, suppose that vi and vj are embedded, then p(vk) can be computed as one of the two intersections between two hyperbolic circles, circ(p(vi), lki) and circ(p(vj), lkj), satisfying (p(vj) − p(vi)) × (p(vk) − p(vi)) > 0. We continue to do so until the queue is empty. Figure 4 (c) shows the embedding of the ventricular surface in the Poincaré disk. The boundaries γ1, γ2, γ3 have become geodesics γ2, γ3. We call it as the Poincaré disk embedding of the fundamental domain of the surface. As pointed out in (Jin et al., 2008), different selections of the seed face will result in different layouts of the fundamental domain. In this work, to keep the fundamental domain consistency across subjects, we first applied our prior holomorphic 1-form method (Wang et al., 2011; Wang et al., 2009e) to compute a Euclidean conformal mapping and automatically chose the seed face at the center of the zero point region (Wang et al., 2007), as shown in Fig. 9 (a).
The computed boundaries of the fundamental domains of different ventricular surfaces are not consistent, i.e., the positions of τ1, τ2 may not be consistent. We further apply a geodesic lifting step to achieve consistent boundaries with the deck transformation group generators. For a surface with hyperbolic geometry, its universal covering space is the entire Poincaré disk. As shown in Fig. 4 (c), there are 4 free sides in the fundamental domain, τ1, τ2 and their compliments (after we cut along a curve, it generates two boundaries on the new surface, one is τ1 and its compliment is ). The rigid transformations across these sides induce different periods of the surface mapping. In Poincaré disk, all rigid motions are Möbius transformations. There exist unique Möbius transformations map τ1 to and τ2 to , respectively, as shown in Fig. 4 (d). We explain the details for computing the Möbius transformation that maps τ1 to . Counterclockwisely, let the starting and ending vertices of the two sides be ∂τ1 = (p0, q0) and . The geodesic distance from p0 to q0 equals the geodesic distance from p1 to q1 in the Poincaré disk. To align them, we first compute a Möbius transformation t0, which maps p0 to the origin and q0 to a positive real number, with
Similarly, we can compute another Möbius transformations t1, which maps p1 to the origin and q1 to a positive real number. Then with t0(q0) = t1(q1), we get the final Möbius transformation , which satisfies p1 = t(p0) and q1 = t(q0). Any deck transformation can be composed by the generators. Then the universal covering space can be tiled by transforming a fundamental domain by the deck transformations and gluing the transformed fundamental domains with the original fundamental domain. Figure 4 (d) shows a portion of the universal covering space, which is tiled by 5 fundamental domains, one original and 4 transformed by the 4 deck transformation group generators.
2.7. Geodesic Curve Lifting and Ventricular Surface Constrained Harmonic Map via the Klein Model
To register brain surfaces, a common approach is to compute a range of intermediate mappings to a canonical parameter space, such as a sphere (Bakircioglu et al., 1999; Fischl et al., 1999b; Gu et al., 2004; Yeo et al., 2010) or a planar domain (Auzias et al., 2013; Joshi et al., 2007; Thompson et al., 2004b; Thompson and Toga, 2002; Wang et al., 2013b; Wang et al., 2010). In the current work, we propose to use the Klein model as the canonical space to register ventricular surfaces.
First, we use the Poincaré disk model to achieve consistent geodesic curves across ventricular surfaces. As shown in Fig. 4 (c), , γ2, γ3 are already geodesics on the Poincaré disk model, but the paths between them, τ1, τ2, , are not. Figure 4 (b) shows the paths on the original surface. If the positions of the paths are not consistent across subjects, the fundamental domains will also be different for different surfaces. We solve this problem by locating the geodesic on the Poincaré disk between two fixed points and mapping it back to the original surface, a step known as geodesic curve lifting. Specifically, each of these geodesics is an arc on a circle which passes two fixed points in the Poincaré disk and is orthogonal to the unit circle. Thus the geodesics are unique. The fixed points are the endpoints of existing geodesics. For example, as shown in Fig. 4 (e), τ1 is an arc on the circle which passes one endpoint of and one endpoint of γ2 and is orthogonal to |z| = 1. As we stated in Sec. 2.4, the initial paths τ1, τ2 can be inconsistent, but they have to connect consistent endpoints of γ1, γ2, γ3, as to guarantee the consistency of the geodesic curve computation. After slicing the universal covering space along the geodesics, we get the canonical fundamental domain, as shown in Fig. 4 (g). All the boundary curves become geodesics. As the geodesics are unique, they are also consistent when we map them back to the surface in ℝ3. As shown in Fig. 5, the first row shows a left ventricular surface from the MCI stable group and second row shows one from the MCI converter group. We can see that, although the two surfaces have different shapes due to disease progression, the geodesics τ1, τ2 on them are consistent.
Figure 5.
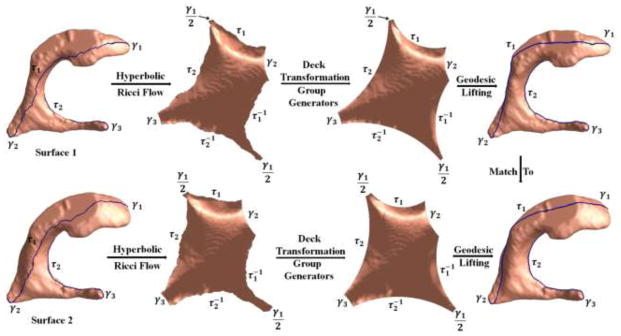
Illustration of ventricular surface registration with the hyperbolic Ricci flow and geodesic curve lifting. Surface 1 and surface 2 were from the MCI stable group and MCI converter group, respectively. After computing their canonical fundamental domains with the steps in Fig. 4, we lifted the computed geodesic curves to the original surfaces. The last column shows that the geodesic curves introduced by our method are consistent across subjects. Then the surfaces were registered by constrained harmonic map with consistent geodesic curve matching.
Furthermore, we convert the Poincaré model to the Klein model with the following transformation (Zeng et al., 2010),
| (10) |
It converts the canonical fundamental domains of the ventricular surfaces to a Euclidean octagon, as shown in Fig. 4 (h). Then we use the Klein disk as the canonical parameter space for the ventricular surface registration.
In our experiment, 133 left and 133 right ventricular surfaces were registered to a common left and right template, respectively. The templates are the left and right ventricular surfaces from a randomly selected subject. We implemented the octagon constrained harmonic map (Wang et al., 2012; Wang et al., 2011). Briefly, the constrained harmonic map was computed by solving the Laplace equation with the Dirichlet boundary condition. Suppose M, N are two ventricular surfaces with their Klein disks, the map f: M → N is a harmonic map if Δf = 0. In order to solve the Laplace equation, all the boundary curves in the Klein octagon disk were treated as boundary conditions and enforced to be aligned across subjects with linear interpolation by the arc length parameter. To show the correspondences between boundaries, we assigned unique labels to geodesic boundaries shown in Fig. 5.
2.8. Surface Tensor-based Morphometry and Its Smoothness with Heat Kernel Method
In this work we use surface tensor-based morphometry (TBM) (Chung et al., 2008; Davatzikos, 1996; Thompson et al., 2000) to analyze the ventricular shape changes along with disease progression. Suppose ϕ: S1 → S2 is a map from surface S1 to surface S2. The derivative map of ϕ is the linear map between the tangent spaces dϕ: TM(p) → TM(ϕ(p)), induced by the map ϕ, which also defines the Jacobian matrix of ϕ. In the triangle mesh surface, the derivative map dϕ is approximated by the linear map from one face [v1, v2, v3] to another [w1, w2, w3]. First, the surfaces [v1, v2, v3] and [w1, w2, w3,] are isometrically embedded onto the Klein disk, the planar coordinates of the vertices vi, wi are denoted by the same symbol vi, wi. Then the Jacobian matrix for the derivative map dϕ can be explicitly computed as (Wang et al., 2009a)
| (11) |
Then the TBM is defined as . TBM measures the amount of local area changes in a surface with the map ϕ (Chung et al., 2008).
As pointed out in (Chung et al., 2005b; Chung et al., 2003a), in an integrated surface analysis system, each step in the processing pipeline including MR image acquisition, image segmentation, surface reconstruction, etc., are expected to introduce noise in the deformation measurement. To account for the noise effects, we apply the heat kernel smoothing algorithm proposed in (Chung et al., 2005b) to increase the SNR in the TBM statistical features and boost the sensitivity of statistical analysis. We briefly describe the smoothing method as follows, for details please refer to (Chung et al., 2005b).
Let S be a surface and p ∈ S be a point on S. Y is a real-valued function defined on S, representing a measurement of the surface, e.g., the TBM features in our study. Consider a stochastic model for Y as Y(p) = θ(p) + ε(p), where θ is the unknown mean measurement and ε is a zero mean Gaussian random field. The heat kernel smoothing estimator of θ is defined by the convolution
| (12) |
where q is a point on S which is adjacent to p, μ(q) is the surface Lebesgue measure, and σ is the smoothing parameter (bandwidth). In numerical implementation, if σ is sufficiently small and q is sufficiently close to p, the heat kernel is defined as:
| (13) |
where d(p, q) is the geodesic distance between p and q. Heat kernel smoothing with large bandwidth can be decomposed into iterated kernel smoothing with small bandwidth via
| (14) |
For the case at hand, we define Np = {q0, q1, …, qk} to be the set of neighboring points of p on S and the normalized truncated kernel for S to be
| (15) |
The discrete convolution is defined as .
2.9. Ventricular Surface Morphometry Analysis of MCI Group Differences Study
To evaluate whether ventricular morphometry, analyzed in this way, could be a valid predictive biomarker, we studied morphological differences in the lateral ventricles extracted from the baseline MR images between the two different MC groups. We applied Student’s t test on the TBM statistic to study group difference; we used permutation tests to correct for multiple comparisons (Nichols and Holmes, 2002). Given two groups of ventricular surfaces, on each surface point, we compute a t value with true group labels to represent the difference between the two groups of subjects on this point. We then randomly assign the ventricular surfaces into two groups with same number of subjects in each group as in the true grouping and re-compute the t value on each surface point, which we denote as the t′ value. The random group assignment is permuted 5,000 times and results in 5,000 t′ values on each point. A probability on each surface point is computed as the ratio of the number of t′ values which are greater than the t value to the number of total permutations. These probability values (p-values) are color coded on an average ventricular shape to build the significance p-map (uncorrected) of the group comparison. Given a pre-defined statistical threshold of p=0.05, the feature in a significance p-map is defined as number of surface points with p-values lower than this threshold, which is also regarded as the real effect in the true experiment. The feature is then compared with features that occur by accident in the random groupings. A ratio is computed describing the fraction of the time an effect of similar or greater magnitude to the real effect occurs in the random assignments. This ratio is the chance of the observed pattern occurring by accident and provides an overall significance value of the map (corrected for multiple comparisons) (Thompson et al., 2003).
2.10. Correlation Between Ventricular Shape and Cognition and Other AD Biomarkers
In addition to examining the group difference, we also investigated the ventricular shape morphometry correlation with each of several cognitive tests such as the 11-item Alzheimer’s Disease Assessment Scale-Cognitive (ADAS-COG11) (Rosen et al., 1984), and with the FDG-PET based hypometabolic convergence index (HCI) (Chen et al., 2011), which is computed from the same subject’s FDG-PET image and is a single measurement of the extent to which the pattern and magnitude of cerebral hypometabolism in an individual’s FDG-PET image correspond to that in AD patients. Such correlation analysis may help evaluate whether the proposed ventricular morphometry is linked to cognition or abnormal levels of AD-related markers that were previously reported. We apply a Pearson correlation method to analyze the relationship between the ventricular shape morphometry and cognitive or FDG-PET measures, where the latter is used as the predictor. We estimate the p-value of the correlation at every surface point to build the correlation p-map. The estimated r-value, i.e., the correlation coefficient on each surface point, is also computed. Similar to group difference analysis, the overall significance value of the correlation, corrected for multiple comparisons, is obtained through a permutation test (5,000 iterations) of cognitive or other AD biomarker values.
3. RESULTS
3.1 Volume and Area Differences between Diagnostic Groups
We first tested if there were significant differences between two groups (MCI converter vs. stable) with two global measurements of shape changes: the total volumes and surface areas of the ventricles. In each experiment, we combined the volumes or areas of the left and right ventricles to form a 1 × 2 vector (Vl, Vr) or (Al, Ar) for the permutation test with 5,000 random assignments of subjects to groups, given 0.05 as the significant level. However, neither of them detected significant differences between the groups. The permutation test corrected p-values are 0.0803 for the volume and 0.2922 for the area.
3.2 Group Difference Analysis with Tensor-based Morphometry
We performed a group comparison with Student’s t test on the smoothed TBM features after we registered ventricular surfaces with our proposed method. Specifically, for all points on the ventricular surface, we ran a permutation test with 5,000 random assignments of subjects to groups to estimate the statistical significance of the areas with group differences in surface morphometry. The probability was color coded on each surface point as the statistical p-map of group difference. Figure 6 shows the p-map of group difference detected between the MCI converter (n = 71) and stable (n = 62) groups, using the smoothed TBM as a measure of local surface area change and the significance level at each surface point as 0.05. In Fig. 6, the non-blue color areas denote the statistically significant difference areas between two groups. The overall significance of the map is 0.0172.
Figure 6.
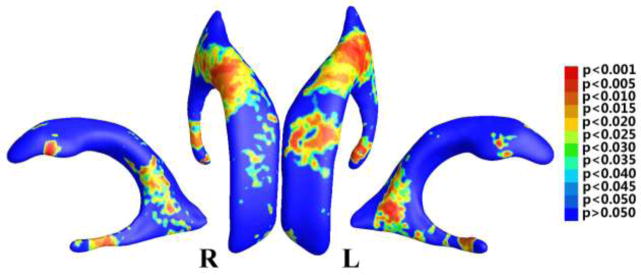
Illustration of statistical map showing local shape differences (p-values) between MCI converter and MCI stable groups from the ADNI baseline dataset, based on tensor-based morphometry (TBM), which was smoothed by the heat kernel smoothing method (Chung et al., 2005b).
3.3 Correlation Analysis of Ventricular Morphometry with Cognitive Measurements
We studied the correlation between the smoothed surface TBM statistic and three cognitive measurements, including MMSE score (Folstein et al., 1975), ADAS-COG11 (Rosen et al., 1984) and AVLT (Rey, 1964) on the 133 subjects with MCI. After the permutation tests, the correlation with ADAS-COG11 passed the multiple comparisons (the overall significance of the correlation value p = 0.0110) while the correlations with MMSE and AVLT did not pass the multiple comparisons test (the overall significance of the correlation value p = 0.8516 for MMSE and p = 0.4358 for AVLT). Figure 7 (a) shows the p-map of correlation results with ADAS-COG11, where the non-blue color areas denote the statistically significant difference areas; (b) shows the r-map of the r-values where the red color denotes a positive correlation and the blue color a negative correlation. In the statistically significant areas in Fig. 7 (a), the maximum r-value is 0.3701, the average r-value is 0.1548, and the dominant correlations are positive (86.18%).
Figure 7.

Correlation maps with ADAS-COG11. (a) shows the p-map of correlation results with ADAS-COG11, where the non-blue color areas denote the statistically significant difference areas; (b) shows the r-map of the r-values where the red color denotes a positive correlation and the blue color a negative correlation.
3.4 Correlation Analysis of Ventricular Morphometry with HCI
Since all subjects included in this study had both structural MRI and FDG-PET images, we attempted to study whether ventricular morphometry features were correlated with FDG-PET based single global index HCI. If such a correlation holds, we may use MRI measures as surrogates of disease progression in AD, even in pre-clinical stages (for related work, please see (Chou et al., 2009a; Chou et al., 2010; Henneman et al., 2009; Vemuri et al., 2010; Whitwell et al., 2008)). In previous studies, we showed that HCI correlated with AD progression and smaller hippocampal volumes (Chen et al., 2012; Reiman and Jagust, 2012; Schraml et al., 2013; Toledo et al., 2013).
The smoothed TBM statistic of the 133 MCI patients was correlated with their HCI measurements, with the permutation test corrected p-value as 0.0001. Figure 8 (a) shows the correlation p-map color-coded with uncorrected p-values and (b) shows the r-map color-coded with the correlation coefficients. On the statistically significant areas in Fig. 8 (a), the maximum r-value is 0.5163, the average r-value is 0.3030, and the dominant correlations are positive (99.40%). It is interesting to note that the enlargement of lateral ventricles in these patients was correlated with higher HCI, implicating enlarged ventricles were associated with greater glucose uptake reduction. Such positive correlation was observed in multiple locations. Of special interest and relevant to reported AD hypometabolism were the regions in the neighborhood of posterior cingulate.
Figure 8.

Correlation maps with HCI. (a) shows the p-map of correlation results with HCI, where the non-blue color areas denote the statistically significant difference areas; (b) shows the r-map of the r-values where the red color denotes a positive correlation and the blue color a negative correlation.
4. DISCUSSION
Our study has two main findings. First, we demonstrate the feasibility to apply hyperbolic geometry to register ventricular surfaces across subjects. In brain imaging, a surface-based morphometry analysis approach is to set up parametric grids on surfaces, and then use differential geometry to come up with useful descriptors of surface features of interest, or to summarize the geometry as a whole. Prior research has used sphere (Jeong et al., 2013; Lee et al., 2013; Styner et al., 2005) or Euclidean plane (Wang et al., 2011; Wang et al., 2010) as the parameter domain. However, for ventricular surfaces with a branching structure, as demonstrated in our prior work (Wang et al., 2010), spherical mapping creates distortions and planar mapping some inevitable singularities. The hyperbolic Ricci flow method (Wang et al., 2009b; Wang et al., 2009c; Zeng et al., 2010) is capable of parameterizing complex shapes. Thus it has the potential to detect subtle differences between people with high accuracy and categorize them into diseased and healthy control groups, or as in the current study categorize them into different risk levels of disease, by analyzing ventricular surface deformation tensors computed from a set of parametric surfaces using concepts from hyperbolic conformal parameterizations. In addition, the introduced hyperbolic Ricci flow method is theoretically sound and numerically efficient (Jin et al., 2008; Wang et al., 2012; Zeng et al., 2010). Together with geodesic curve lifting and the Klein model, our proposed computational framework may achieve a diffeomorphic ventricular surface registration with consistent boundary matching condition. Second, the surface tensor-based morphometry, which is computable from the conformal grid, carries rich information on local surface geometry that is defined at the coordinates of the well-organized surface grid. As demonstrated in many prior studies (Chung et al., 2008; Chung et al., 2003b; Davatzikos, 1996; Thompson et al., 2000), the resulting set of surface tensor methods practically encodes a great deal of information that would otherwise be inaccessible, or overlooked. The analysis of parametric meshes for computational studies of ventricular structures can be made more powerful by analyzing the surface metric tensor information inherent in the surface.
We validated our proposed methods in our ongoing work on MCI conversion prediction (Chen et al., 2013) which examined baseline measurements of structural MRI and FDG-PET, in combination with cognitive tests, to distinguish individuals with MCI who developed incident AD from those who did not, with the aim of establishing their usefulness as predictors for progression to AD. Our current work focused on ventricular morphometry analysis. Although the analyses of global ventricular volume and surface area did not differentiate MCI converter and MCI stable groups, our fine-grained analysis revealed significant differences mostly localized around the subregion of the ventricular body that abuts medial temporal lobe structures. This subregional ventricular enlargement was reported to correlate with atrophy of medial temporal lobe which includes the hippocampal formation. Consistent with prior observations, e.g. (Frisoni et al., 2010; Thompson et al., 2003), our findings suggest that grey matter atrophy starts from the temporal lobe region and then spreads to involve frontal cortices, consistent with Braak staging of neurofibrillary pathology (Braak et al., 2006). Importantly, they provide evidence that ventricular subfield analysis provides enhanced statistical power in structural MRI analysis compared with ventricular volume analysis. Some recent studies (Li et al., 2012; Weiner et al., 2012; Westman et al., 2013) found that including optimum features from multiple modalities provides better AD predictive value than any one measure alone. The proposed ventricular surface TBM features may enhance the predictive value of MRI-derived data in AD research.
Furthermore, the positive correlation between ventricular morphometry and ADAS-COG11 that we found is consistent with previous studies that correlated ventricular expansion with worsening cognition in MCI subjects (Jack et al., 2009; Samtani et al., 2012). The strong positive correlation with HCI values supports to the validity of our algorithm and demonstrates the linkage between functional abnormalities and structural changes (ventricle enlargement particularly in our study). As shown in the Results section, we found that the ventricular subregions where the statistically significant correlation between ventricle enlargement and HCI abutted areas of earliest FDG-PET change in AD, particularly the posterior cingulate (Buckner et al., 2008; Leech and Sharp, 2014; Matsuda, 2007a), and to our knowledge, this is the first study to explore the relationship between ventricular measures and FDG-PET measures.
Applicability to other brain structures
As stated by the uniformization theorem, any surface with a negative Euler characteristic number admits a hyperbolic background geometry and can be conformally mapped to the hyperbolic space
. Geometrically, the Euler characteristic number is defined as 2 − 2g for closed surfaces, where g is the surface genus, i.e., the number of handles on a surface, and is defined as 2 − 2g − b for surfaces with boundaries, where b is the number of boundaries. Thus the hyperbolic Ricci flow method has broad applicability in human brain surface morphometry studies, as surfaces of brain structures are often irregular and topologically complicated. Here we take the cortical surface as an example. In human brain mapping field, a diffeomorphic mapping between a pair of cortical surfaces with landmark correspondence is usually pursued to study brain deformations along with disease progression. By slicing a cortical surface open along three or more landmark curves, the cortical surface becomes a genus-0 surface with multiple boundaries, which has a negative Euler number. In our prior work (Shi et al., 2012), we illustrated the application of our method on a cortical surface with three landmark curves, which is homotopic to the topological pants. For cortical surfaces with more landmarks, which also have negative Euler numbers, the hyperbolic Ricci flow method is still applicable (Shi et al., 2013c; Shi et al., 2013d), so the remaining processes of the proposed method follow naturally. On the other hand, for different brain structures, certain processing steps in the pipeline may need to be adapted accordingly. For example, a major difference between cortical and ventricular surface processing with the proposed method is the topology optimization. Given the highly variable gyral patterns of cortical surfaces, one may need to work with experienced neuroanatomists to manually label homologous landmark curves across subjects following some well-established anatomical protocols such as (Sowell et al., 2002), as described in our prior work (Wang et al., 2012; Wang et al., 2013b). In this case, the topology optimization reduces to slicing a cortical surface along a set of manually defined landmark curves to change it into a genus-0 surface with multiple boundaries.
Comparison with holomorphic 1-form algorithm
The holomorphic 1-form algorithm (Wang et al., 2009d) is a commonly used method to analyze lateral ventricular surfaces (Wang et al., 2011). However, due to the limitation of holomorphic 1-form itself, this method introduces singularities and the number of singularities equals the absolute value of the Euler characteristic number of a surface. In analyzing lateral ventricular surfaces, each surface has a singular point, as shown in Fig. 9 (a), which was called zero point in Wang et al. (2009d) and Wang et al. (2011) and used as the starting point to segment a ventricular surface into three parts, the superior horn, the inferior horn, and the occipital horn, as shown in Fig. 9 (b). After registering the three horns separately and merging them to form the whole registered ventricular surface, a hole is generated around the zero point due to the changes from surface registration, as shown in Fig. 9 (c), which is not reasonable in analyzing anatomical surfaces. On the other hand, the new registration introduces no holes as shown in Fig. 6. Furthermore, the segmentation of ventricular surfaces with holomorphic 1-form, though consistent, separates an entire surface into independent partitions. The independent registrations of different partitions are based on matching surface features which should not be separated. For example, when registering the superior horn, the other two horns are not affected, which may not be true when registering the ventricular surfaces as a whole. Particularly, as shown in Fig. 6, as most of the significantly different areas concentrated at the locations of the partition cuts, the statistical analysis may be affected by the segmentations. Another problem with the ventricular surface segmentation is that the surface registration may be affected by the locations of the cuts that divide a ventricular surface into three parts. As shown in Fig. 9 (d), we slightly changed the locations of the cuts on a left ventricular surface (shown in two different views), where the original cuts are shown in green, and the changed cuts are shown in red. Although the cutting locations almost overlap, the resulting registered ventricular surfaces are different. By measuring the differences with the Euclidean distances between pairs of vertices on the two registered surfaces, the differences are in the range of [0.0001, 1.3545]. Even more careful studies are necessary to determine the impact of the cutting locations on the statistical analysis. Thus it is advantageous for the new algorithm as it takes the ventricular surface as an entirety for the registration.
Comparison with SPHARM
SPHARM (Styner et al., 2006) is another surface mapping tool with a number of applications (Alhadidi et al., 2012; Paniagua et al., 2012; Paniagua et al., 2013; Tae et al., 2011). It takes a binary image segmentation as input and provides functions such as surface reconstruction, spherical harmonic mapping and surface registration; statistical analysis tools are also included. The major limitation of SPHARM is that it assumes the input binary image segmentation has a spherical topology. Thus prior work on ventricular shape morphometry with SPHARM usually discarded the inferior horn (Gerig et al., 2001; Paniagua et al., 2013). The inclusion of the long and narrow inferior horn in our segmentation makes the shape of the lateral ventricle non-spherical. As a result, SPHARM cannot successfully parameterize the concave ventricular surfaces that are reconstructed from our segmentation unless a coarse resolution is used. For this experiment, we resampled the segmented binary images into a resolution of 2 × 2 × 2 mm3. However, the resulting spherical parameterizations still have severe distortion and overlap on the inferior horn, as shown in Fig. 10 (a), and 22 subjects failed the parameterization process. After surface registration, the TBM statistic was computed at each vertex of the aligned surfaces as described in Sec. 2.8 and group difference was analyzed as in Sec. 2.9. The significance p-map of group comparison between 58 converters and 53 stable MCI subjects with SPHARM is shown in Fig. 10 (b). The result of our method is shown in Fig. 10 (c) and the cumulative distribution function (CDF) plots in Fig. 10 (d) show the comparison of the resulting p-values for each method. While the line y = x represents null hypothesis, which implies there is no detectable difference, a steeper curve suggests that greater differences are detected. The details of the experiment with SPHARM can be found in (Shi et al., 2013a). From the CDF comparison, both methods got comparable results, but our method is more robust for processing the concave ventricular surfaces. The inferior horn on the lateral ventricle is also important for the study of AD, as it is adjacent to the hippocampus and its enlargement may indicate hippocampal atrophy – a well-established biomarker for AD. As shown in Fig. 6, our approach detected significant differences on both left and right inferior horns. Even with a small dataset, our method detected significant differences on the right inferior horn, as shown in Fig. 10 (c). The significance p-maps of the two methods are not quite consistent, most probably because that details in the original image segmentations were greatly removed during the resolution resampling step of SPHARM. A more convincing way to validate the new algorithm is to apply it to study cortical surface morphometry and compare the results to other extensively applied cortical analysis tools such as FreeSurfer (Fischl et al., 1999a). We will address this problem in future work.
Figure 10.

Comparison with SPHARM. (a) is the spherical harmonic mapping of a left ventricular surface; (b) is the statistical map from SPHARM (Styner et al., 2006) showing local shape differences (p-values) between MCI converter (N=58) and MCI stable (N=53) groups from the ADNI baseline dataset; (c) is the statistical map from our method showing local shape differences (p-values) between the same groups as in (b); (d) shows the CDF plots comparing the two methods.
Comparisons with voxel-based morphometry and pattern analysis
When studying brain morphology with imaging, the voxel-based morphometry (VBM) method has been extensively developed, improved, and used (Ashburner and Friston, 2000; Good et al., 2001; Killgore et al., 2012; Mechelli et al., 2005; Niedtfeld I et al., 2013; Whitwell, 2009). Briefly, VBM starts by spatially normalizing the T1-weighted image of each individual subject to a template image to establish a voxel-to-voxel correspondence across subjects. The registration process consists of both affine transformation and a nonlinear deformation. After segmenting the registered images into tissue classes, each voxel contains a measure of the probability that it belongs to a specific segmentation class. This quantity can be used to compute other brain anatomical features such as gray matter volume (Ashburner and Friston, 2000). Voxel-wise statistical analyses are then applied to study local differences in the anatomical features of each tissue class across subjects. The VBM method is available in many major neuroimaging software packages such as FSL and SPM and is efficient and easy to apply. However, the VBM method may have limited accuracy in measuring some aspects of brain morphology, particularly in regions where fine anatomical features are found within brain structures. For example, the cerebral cortex has a highly folded geometry. Many of its anatomical features are built in deep folds. The voxel-wise nature of the VBM method may limit its capability to accurately measure such features and to align these features across subjects. On the other hand, our surface-based method can achieve sub-voxel accuracy when applied to some specific structures. For example, as discussed above, the hyperbolic Ricci flow method can conformally flatten a convoluted cortical surface onto a 2D domain (Shi et al., 2013c). The flattened cortical surface retains substantial geometric information about the original surface with no singularities or overlap in the mapping, so all features in the cortical folds are well preserved and can be accurately analyzed. Pattern analysis (Joshi et al., 2011; Li et al., 2010; Liu et al., 2014) is another commonly applied method, which aims to identify the most discriminative disease-related features in brain images or surfaces. In this paper, the proposed method is based on tensor-based morphometry (TBM), which is generalized to deal with 3D surfaces, to study the morphological deformation patterns of ventricular surfaces along with disease progression. The TBM features encode rich information about the local surface geometry, which may be inaccessible or overlooked in other methods (Chung et al., 2008; Chung et al., 2003b; Davatzikos, 1996; Thompson et al., 2000). Experimental results in our group difference study illustrate the differentiation power of the TBM features, as shown in Fig. 6. These TBM features may also improve MRI-based diagnostic classification with sparse learning based feature selection method (Wang et al., 2013b). Despite the many advantages of the proposed method, however, a few issues need to be addressed before it can be established as an attractive alternative to other methods. First, more experiments on large-scale datasets of ventricular and other brain structure surfaces, especially cortical surfaces, are necessary to validate the efficacy of the method. Second, the system needs to be automated to hide the complex details for general users. Third, the ability of TBM features in diagnostic classification needs more systematic study. We will address these problems in our future work.
Statistical feature smoothing
In our surface processing pipeline, each of the MR image acquisition, image segmentation, surface reconstruction, surface parameterization, and surface registration procedures is expected to introduce noise in the TBM statistical features. The mesh smoothing process introduced in Sec. 2.3 is used to reduce the noise from image acquisition, segmentation and partial volume effects in surface reconstruction (Shi et al., 2013a). The remaining noise and noise introduced in subsequent processes still affect the SNR in the TBM features and the final statistical analysis. Thus, we have applied the heat kernel smoothing algorithm (Chung et al., 2005b) to the TBM features before the group difference and correlation studies, as introduced in Sec. 2.8. From Eq. (14), the bandwidth of the smoothing process is determined by the number of iterations. As pointed out in (Han et al., 2006), the correlation of noise in surface measurements falls off rapidly with distance on the surface, so it is sufficient to use a small kernel bandwidth. For heat kernel smoothing on cortical surfaces, usually applied parameters include bandwidth σ = 1 and number of iterations m = 200 yielding the effective smoothness of (Chung et al., 2005a) or even smaller smoothness values such as 6 mm in (Han et al., 2006). Based on these observations, in our experiment, we set σ = 1, m = 10 giving the effective smoothness of 3.16 mm. As few studies in the literature have validated the performance of the heat kernel smoothing method (Seo et al., 2010), the smoothing parameters were chosen tentatively. The group difference p-map with unsmoothed TBM features is shown in Fig. 11. In Fig. 6, the significant areas are consistent with those in Fig. 11, but the noisy distributions are greatly improved by the smoothing process. Similar comparison studies for correlation-based p-maps give similar results. Thus the parameters are suitable for our current studies. A potential future work is to quantitatively study the effects of the heat kernel smoothing process on the statistical analysis.
Figure 11.
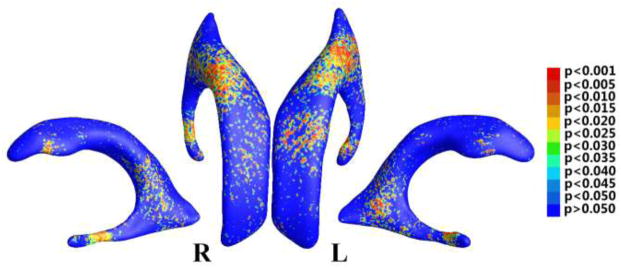
Illustration of statistical map showing local shape differences (p-values) between MCI converter and MCI stable groups from the ADNI baseline dataset, based on determinant of Jacobian matrix (TBM), which was not smoothed.
Surface multivariate tensor-based morphometry
In some of our prior studies (Wang et al., 2013b; Wang et al., 2010), the multivariate tensor-based morphometry (mTBM) was proved to be more powerful for checking group differences than other statistics including TBM. This paper used TBM as the statistic instead of mTBM because for the lateral ventricle, a fluid-filled subcortical structure, its changes vary drastically with normal aging, disease progression, or other brain activities. As the mTBM is very sensitive to local changes, the resulting significantly different areas spread on the ventricular surface even after smoothing, making the results difficult to be interpreted as meaningful anatomical findings or noise from subtle changes. Thus here we used TBM as the measurement of changes.
Integration of relative pose statistical analysis
In the current study, the proposed surface-based ventricular morphometry system relies on shape changes of the lateral ventricles along with disease progression. Similar to other shape analysis studies of a single structure, ventricular pose information is discarded in our system during the surface registration stage. Pose mainly depends on extrinsic factors such as the position and orientation of a ventricular surface in ℝ3 while our method depends on the intrinsic factors of the ventricular surfaces such as local enlargement. Although it rarely happens that atrophy of brain tissue causes only pose changes in adjacent structures without any local shape deformation, pose information is still very important in brain morphometry studies. In (Bossa et al., 2011), the statistical analysis of relative pose was presented to study brain atrophy associated pose changes of the subcortical nuclei in AD. Same method was applied in (Lao et al., 2013) to study pose changes of thalamus due to prematurity and in (Lao et al., 2014) to study pose changes of corpus callosum due to traumatic brain injury. Briefly, the relative pose is computed by following steps, where we take ventricular surfaces as an example. First, one-to-one point correspondences between different ventricular surfaces are established by a surface registration algorithm, such as the method proposed in this paper. Second, for each registered ventricular surface, a pose matrix is obtained by fitting a template shape to this surface with a Procrustes alignment. Third, the mean pose is calculated iteratively with the pose matrix of each ventricular surface. The relative pose of each ventricular surface, which consists of 7 parameters: 1 scale scalar, 3 rotation scalars and 3 translation scalars, is obtained by subtracting the mean pose from its pose matrix. Statistical analyses are then applied on the relative pose parameters. For details of the algorithm, please refer to (Bossa et al., 2011). Since our ventricular surface analysis gives indirect information about the atrophy of surrounding brain structures, integration of relative pose analysis in our system may help to better understand the abnormal growth of brain tissue adjacent to lateral ventricles. In future, we will try to integrate the statistical analysis of relative pose information in our system.
In neuroimaging research, T1-weighted MRI has high contrast differences from surrounding structures making accurate lateral ventricle segmentation straightforward for both manual and automatic methods (Carmichael et al., 2007; Chou et al., 2010; Ferrarini et al., 2006; Jack et al., 2003; Thompson et al., 2004a). Thus structural MRI based lateral ventricular structure has been used to study a variety of human diseases including AD (Chou et al., 2009a; Ferrarini et al., 2006; Ferrarini et al., 2008a; Gutman et al., 2013; Jack et al., 2003; Thompson et al., 2004a; Wang et al., 2011), HIV/AIDS (Thompson et al., 2006; Wang et al., 2010), normal pressure hydrocephalus (Bader et al., 2013), ventriculomegaly (Paniagua et al., 2013), vascular dementia (Bader et al., 2013), diabetes mellitus (Lee et al., 2013), drug addiction (Jeong et al., 2013), and others. Our proposed algorithm is very generalizable and may be applied to a similar range of diseases including but not limited to AD. Starting from our prior work on brain surface conformal parameterization (Gu et al., 2004; Shi et al., 2013c; Shi et al., 2013d; Wang et al., 2009b; Wang et al., 2009c; Wang et al., 2007), here we show that the hyperbolic Ricci flow method can be adopted to analyze branching ventricular morphometry. Besides its global non-singularity parameterization, our method also carries a few other novel ideas, such as using geodesic curve lifting to enforce a meaningful boundary matching, diffeomorphic surface registration via the Klein model, and combing hyperbolic conformal parameterization with TBM analysis. We expect that our work can provide some practical experience and inspire more interest in hyperbolic geometry related neuroimaging research.
5. CONCLUSION
In this paper, we present a hyperbolic Ricci flow and surface TBM based ventricular morphometry system, which can improve the computational efficiency and accuracy for in vivo regional structural MRI lateral ventricle estimation. Our approach introduces the hyperbolic Ricci flow method which computes a ventricular surface conformal parameterization on the hyperbolic Poincaré disk without any singularity. Through geodesic curve lifting and the conversion to the Klein model (Zeng et al., 2010), we can compute a diffeomorphic surface mapping with consistent boundary matching condition. Furthermore, we compute the TBM from the well-organized conformal grids and use it to capture any possible subtle surface deformations. We applied the developed tool to our ongoing work on MCI conversion prediction (Chen et al., 2013) and our results demonstrated that our proposed method achieved good correlation with cognition and other AD biomarker such as FDG-PET, which may help predict longitudinal AD conversion by capturing subtle ventricular morphometric differences from the baseline image analysis.
In the past few years, our group has developed a series of structural MRI analysis software tools for AD research, such as multivariate TBM on cortical surface (Wang et al., 2013b) and hippocampal abnormality analyses (Shi et al., 2014; Shi et al., 2013a; Shi et al., 2013b; Wang et al., 2011), together with cortical thickness estimation with volumetric Laplace-Beltrami operator and heat kernel (Wang et al., 2013a; Wang et al., 2014). In the future, we plan to apply our structural MRI software tools in our ongoing preclinical AD research (Caselli and Reiman, 2013; Langbaum et al., 2013). We will carefully explore a broad range of research questions on structural MRI analysis (Braskie and Thompson, 2014), such as (1) structural MRI as an AD biomarker to measure AD progression; (2) the relationship of structural MRI to cognition (3) and to other AD biomarkers including amyloid imaging and FDG-PET, and (4) the value for structural MRI measures to help predict cognitive decline.
Highlights.
A global conformal parameterization without singularities for branching surfaces
A geodesic curve lifting method for consistent boundary conditions across subjects
Surface TBM shows better group difference between MCI converter and stable groups
Ventricular morphology changes are consistent with other AD progression measurements
An automated, robust and generalizable ventricular morphometry system
Acknowledgments
Algorithm development and image analysis for this study was funded, in part, funded by the National Institute on Aging (R21AG043760 to JS, LCB, RJC and YW, AG016570 to PMT, R01AG031581 and P30AG19610 to EMR and RJC), the National Library of Medicine, the National Institute for Biomedical Imaging and Bioengineering (LM05639, EB01651, RR019771 to PMT), the Arizona Alzheimer’s Consortium (YW, CMS, KC, CR, LCB, EMR and RJC), and the National Science Foundation (DMS-1413417 to YW). Data collection and sharing for this project was funded by the Alzheimer’s Disease Neuroimaging Initiative (ADNI) (National Institutes of Health Grant U01 AG024904) and DOD ADNI (Department of Defense award number W81XWH-12-2-0012). ADNI is funded by the National Institute on Aging, the National Institute of Biomedical Imaging and Bioengineering, and through generous contributions from the following: Alzheimer’s Association; Alzheimer’s Drug Discovery Foundation; BioClinica, Inc.; Biogen Idec Inc.; Bristol-Myers Squibb Company; Eisai Inc.; Elan Pharmaceuticals, Inc.; Eli Lilly and Company; F. Hoffmann-La Roche Ltd and its affiliated company Genentech, Inc.; GE Healthcare; Innogenetics, N.V.; IXICO Ltd.; Janssen Alzheimer Immunotherapy Research & Development, LLC.; Johnson & Johnson Pharmaceutical Research & Development LLC.; Medpace, Inc.; Merck & Co., Inc.; Meso Scale Diagnostics, LLC.; NeuroRx Research; Novartis Pharmaceuticals Corporation; Pfizer Inc.; Piramal Imaging; Servier; Synarc Inc.; and Takeda Pharmaceutical Company. The Canadian Institutes of Health Research is providing funds to support ADNI clinical sites in Canada. Private sector contributions are facilitated by the Foundation for the National Institutes of Health (www.fnih.org). The grantee organization is the Northern California Institute for Research and Education, and the study is coordinated by the Alzheimer’s Disease Cooperative Study at the University of California, San Diego. ADNI data are disseminated by the Laboratory for Neuro Imaging at the University of Southern California.
Footnotes
In Euclidean space, rigid motions include translation and rotation. Any transformation consisting of rigid motions changes the position of an object without deforming the shape of the object. As the oincar disk is a representation of the hyperbolic space, the rigid motion in it is defined by Eq. (1), which is the Möbius transformation and is different from that in the Euclidean space. However, the Möbius transformation has the same properties as the Euclidean rigid motion. For example, as shown in Fig. 4 (d), the object at the center is transformed to four other different positions in the oincar disk with four different Möbius transformations. Each of the four pieces (shown in four colors) is a copy of the center object. They have different positions, but their shapes are the same in the hyperbolic space.
Publisher's Disclaimer: This is a PDF file of an unedited manuscript that has been accepted for publication. As a service to our customers we are providing this early version of the manuscript. The manuscript will undergo copyediting, typesetting, and review of the resulting proof before it is published in its final citable form. Please note that during the production process errors may be discovered which could affect the content, and all legal disclaimers that apply to the journal pertain.
References
- Alhadidi A, Cevidanes LH, Paniagua B, Cook R, Festy F, Tyndall D. 3D quantification of mandibular asymmetry using the SPHARM-PDM tool box. Int J Comput Assist Radiol Surg. 2012;7:265–271. doi: 10.1007/s11548-011-0665-2. [DOI] [PMC free article] [PubMed] [Google Scholar]
- Apostolova LG, Mosconi L, Thompson PM, Green AE, Hwang KS, Ramirez A, Mistur R, Tsui WH, de Leon MJ. Subregional hippocampal atrophy predicts Alzheimer’s dementia in the cognitively normal. Neurobiol Aging. 2010a;31:1077–1088. doi: 10.1016/j.neurobiolaging.2008.08.008. [DOI] [PMC free article] [PubMed] [Google Scholar]
- Apostolova LG, Thompson PM, Green AE, Hwang KS, Zoumalan C, Jack CR, Jr, Harvey DJ, Petersen RC, Thal LJ, Aisen PS, Toga AW, Cummings JL, Decarli CS. 3D comparison of low, intermediate, and advanced hippocampal atrophy in MCI. Hum Brain Mapp. 2010b;31:786–797. doi: 10.1002/hbm.20905. [DOI] [PMC free article] [PubMed] [Google Scholar]
- Ashburner J, Friston KJ. Voxel-based morphometry--the methods. Neuroimage. 2000;11:805–821. doi: 10.1006/nimg.2000.0582. [DOI] [PubMed] [Google Scholar]
- Auzias G, Lefevre J, Le Troter A, Fischer C, Perrot M, Regis J, Coulon O. Model-driven harmonic parameterization of the cortical surface: HIP-HOP. IEEE Trans Med Imaging. 2013;32:873–887. doi: 10.1109/TMI.2013.2241651. [DOI] [PubMed] [Google Scholar]
- Bader C, Cyrille C, Jadwiga Z, Joel D, Fichten A, Catherine GJ, Roger B, Olivier B. Estimation of the lateral ventricles volumes from a 2D image and its relationship with cerebrospinal fluid flow. Biomed Res Int. 2013;2013:215989. doi: 10.1155/2013/215989. [DOI] [PMC free article] [PubMed] [Google Scholar]
- Bakircioglu M, Joshi S, Miller MI. Landmark Matching on Brain Surfaces via Large Deformation Diffeomorphisms on the Sphere. Proc SPIE Medical Imaging. 1999:710–715. [Google Scholar]
- Bossa M, Zacur E, Olmos S. Statistical analysis of relative pose information of subcortical nuclei: application on ADNI data. Neuroimage. 2011;55:999–1008. doi: 10.1016/j.neuroimage.2010.12.078. [DOI] [PMC free article] [PubMed] [Google Scholar]
- Braak H, Alafuzoff I, Arzberger T, Kretzschmar H, Del Tredici K. Staging of Alzheimer disease-associated neurofibrillary pathology using paraffin sections and immunocytochemistry. Acta Neuropathol. 2006;112:389–404. doi: 10.1007/s00401-006-0127-z. [DOI] [PMC free article] [PubMed] [Google Scholar]
- Braskie MN, Thompson PM. A Focus on Structural Brain Imaging in the Alzheimer’s Disease Neuroimaging Initiative. Biol Psychiatry. 2014;75:527–533. doi: 10.1016/j.biopsych.2013.11.020. [DOI] [PMC free article] [PubMed] [Google Scholar]
- Buckner RL, Andrews-Hanna JR, Schacter DL. The brain’s default network: anatomy, function, and relevance to disease. Ann N Y Acad Sci. 2008;1124:1–38. doi: 10.1196/annals.1440.011. [DOI] [PubMed] [Google Scholar]
- Cardenas VA, Chao LL, Studholme C, Yaffe K, Miller BL, Madison C, Buckley ST, Mungas D, Schuff N, Weiner MW. Brain atrophy associated with baseline and longitudinal measures of cognition. Neurobiol Aging. 2011;32:572–580. doi: 10.1016/j.neurobiolaging.2009.04.011. [DOI] [PMC free article] [PubMed] [Google Scholar]
- Carmichael OT, Kuller LH, Lopez OL, Thompson PM, Dutton RA, Lu A, Lee SE, Lee JY, Aizenstein HJ, Meltzer CC, Liu Y, Toga AW, Becker JT. Ventricular volume and dementia progression in the Cardiovascular Health Study. Neurobiol Aging. 2007;28:389–397. doi: 10.1016/j.neurobiolaging.2006.01.006. [DOI] [PMC free article] [PubMed] [Google Scholar]
- Caroli A, Prestia A, Chen K, Ayutyanont N, Landau SM, Madison CM, Haense C, Herholz K, Nobili F, Reiman EM, Jagust WJ, Frisoni GB. Summary metrics to assess Alzheimer disease-related hypometabolic pattern with 18F-FDG PET: head-to-head comparison. J Nucl Med. 2012;53:592–600. doi: 10.2967/jnumed.111.094946. [DOI] [PMC free article] [PubMed] [Google Scholar]
- Caselli RJ, Reiman EM. Characterizing the preclinical stages of Alzheimer’s disease and the prospect of presymptomatic intervention. J Alzheimers Dis. 2013;33(Suppl 1):S405–416. doi: 10.3233/JAD-2012-129026. [DOI] [PMC free article] [PubMed] [Google Scholar]
- Chen K, Ayutyanont N, Langbaum JB, Fleisher AS, Reschke C, Lee W, Liu X, Alexander GE, Bandy D, Caselli RJ, Reiman EM. Correlations between FDG PET glucose uptake-MRI gray matter volume scores and apolipoprotein E epsilon4 gene dose in cognitively normal adults: A cross-validation study using voxel-based multi-modal partial least squares. Neuroimage. 2012;60:2316–2322. doi: 10.1016/j.neuroimage.2012.02.005. [DOI] [PMC free article] [PubMed] [Google Scholar]
- Chen K, Ayutyanont N, Langbaum JBS, Fleisher AS, Reschke C, Lee W, Liu X, Bandy D, Alexander GE, Thompson PM, Shaw L, Trojanowski JQ, Jack CR, Jr, Landau SM, Foster NL, Harvey DJ, Weiner MW, Koeppe RA, Jagust WJ, Reiman EM. Characterizing Alzheimer’s disease using a hypometabolic convergence index. Neuroimage. 2011;56:52–60. doi: 10.1016/j.neuroimage.2011.01.049. [DOI] [PMC free article] [PubMed] [Google Scholar]
- Chen K, Reiman EM, Alexander GE, Caselli RJ, Gerkin R, Bandy D, Domb A, Osborne D, Fox N, Crum WR, Saunders AM, Hardy J. Correlations between apolipoprotein E epsilon4 gene dose and whole brain atrophy rates. Am J Psychiatry. 2007;164:916–921. doi: 10.1176/ajp.2007.164.6.916. [DOI] [PubMed] [Google Scholar]
- Chen K, Stonnington C, Ayutyanont N, Reschke C, Thiyyagura P, Protas H, Liu X, Roontiva A, Parks S, Bauer R, Lee W, Fleisher A, Reiman E. Baseline FDG PET and volumetric MR predicts Alzheimer’s disease conversion from mild cognitive impairment: An ADN study. Alzheimer’s Association nternational Conference; Boston. 2013. [Google Scholar]
- Chou YY, Leporé N, Avedissian C, Madsen SK, Parikshak N, Hua X, Shaw LM, Trojanowski JQ, Weiner MW, Toga AW, Thompson PM. Mapping correlations between ventricular expansion and CSF amyloid and tau biomarkers in 240 subjects with Alzheimer’s disease, mild cognitive impairment and elderly controls. NeuroImage. 2009a;46:394–410. doi: 10.1016/j.neuroimage.2009.02.015. [DOI] [PMC free article] [PubMed] [Google Scholar]
- Chou YY, Leporé N, Chiang M, Avedissian C, Barysheva M, McMahon KL, de Zubicaray GI, Meredith M, Wright MJ, Toga AW, Thompson PM. Mapping genetic influences on ventricular structure in twins. NeuroImage. 2009b;44:1312–1323. doi: 10.1016/j.neuroimage.2008.10.036. [DOI] [PMC free article] [PubMed] [Google Scholar]
- Chou YY, Leporé N, Saharan P, Madsen SK, Hua X, Jack CR, Shaw LM, Trojanowski JQ, Weiner MW, Toga AW, Thompson PM. Ventricular maps in 804 ADNI subjects: correlations with CSF biomarkers and clinical decline. Neurobiol Aging. 2010;31:1386–1400. doi: 10.1016/j.neurobiolaging.2010.05.001. [DOI] [PMC free article] [PubMed] [Google Scholar]
- Chung MK, Dalton KM, Davidson RJ. Tensor-Based Cortical Surface Morphometry via Weighted Spherical Harmonic Representation. IEEE Trans Med Imag. 2008;27:1143–1151. doi: 10.1109/TMI.2008.918338. [DOI] [PubMed] [Google Scholar]
- Chung MK, Robbins S, Evans AC. Unified Statistical Approach to Cortical Thickness Analysis. Information Processing in Medical Imaging (IPMI) 2005a:627–638. doi: 10.1007/11505730_52. [DOI] [PubMed] [Google Scholar]
- Chung MK, Robbins SM, Dalton KM, Davidson RJ, Alexander AL, Evans AC. Cortical thickness analysis in autism with heat kernel smoothing. NeuroImage. 2005b;25:1256–1265. doi: 10.1016/j.neuroimage.2004.12.052. [DOI] [PubMed] [Google Scholar]
- Chung MK, Worsley KJ, Robbins S, Evans AC. Tensor-based Brain Surface Modeling and Analysis. IEEE Conference on Computer Vision and Pattern Recognition; 2003a. pp. 467–473. [Google Scholar]
- Chung MK, Worsley KJ, Robbins S, Paus T, Taylor J, Giedd JN, Rapoport JL, Evans AC. Deformation-based Surface Morphometry Applied to Gray Matter Deformation. NeuroImage. 2003b;18:198–213. doi: 10.1016/s1053-8119(02)00017-4. [DOI] [PubMed] [Google Scholar]
- Collins DL, Neelin P, Peters TM, Evans AC. Automatic 3D intersubject registration of MR volumetric data in standardized Talairach space. J Comput Assist Tomogr. 1994;18:192–205. [PubMed] [Google Scholar]
- Colom R, Stein JL, Rajagopalan L, Martínez K, Hermel D, Wang Y, Álvarez-Linera J, Burgaleta M, Quiroga MA, Shih PC, Thompson PM. Hippocampal structure and human cognition: key role of spatial processing and evidence supporting the efficiency hypothesis in females. Intelligence. 2013;41:129–140. doi: 10.1016/j.intell.2013.01.002. [DOI] [PMC free article] [PubMed] [Google Scholar]
- Costafreda SG, Dinov ID, Tu Z, Shi Y, Liu CY, Kloszewska I, Mecocci P, Soininen H, Tsolaki M, Vellas B, Wahlund LO, Spenger C, Toga AW, Lovestone S, Simmons A. Automated hippocampal shape analysis predicts the onset of dementia in mild cognitive impairment. Neuroimage. 2011;56:212–219. doi: 10.1016/j.neuroimage.2011.01.050. [DOI] [PMC free article] [PubMed] [Google Scholar]
- Davatzikos C. Spatial Normalization of 3D Brain Images using Deformable Models. J Comput Assist Tomogr. 1996;20:656–665. doi: 10.1097/00004728-199607000-00031. [DOI] [PubMed] [Google Scholar]
- den Heijer T, van der Lijn F, Koudstaal PJ, Hofman A, van der Lugt A, Krestin GP, Niessen WJ, Breteler MMB. A 10-year follow-up of hippocampal volume on magnetic resonance imaging in early dementia and cognitive decline. Brain. 2010;133:1163–1172. doi: 10.1093/brain/awq048. [DOI] [PubMed] [Google Scholar]
- Dewey J, Hana G, Russell T, Price J, McCaffrey D, Harezlak J, Sem E, Anyanwu JC, Guttmann CR, Navia B, Cohen R, Tate DF. Reliability and validity of MRI-based automated volumetry software relative to auto-assisted manual measurement of subcortical structures in HIV-infected patients from a multisite study. NeuroImage. 2010;51:1334–1344. doi: 10.1016/j.neuroimage.2010.03.033. [DOI] [PMC free article] [PubMed] [Google Scholar]
- Do Carmo MP. Differential Geometry of Curves and Surfaces. Prentice-Hall, Inc; 1976. [Google Scholar]
- Ferrarini L, Palm WM, Olofsen H, van Buchem MA, Reiber JHC, Admiraal-Behloul F. Shape differences of the brain ventricles in Alzheimer’s disease. NeuroImage. 2006;32:1060–1069. doi: 10.1016/j.neuroimage.2006.05.048. [DOI] [PubMed] [Google Scholar]
- Ferrarini L, Palm WM, Olofsen H, van der Landen R, Blauw GJ, Westendorp RGJ, Bollen ELEM, Middelkoop HAM, Reiber JHC, van Buchem MA, Admiraal-Behloul F. MMSE scores correlate with local ventricular enlargement in the spectrum from cognitively normal to Alzheimer disease. NeuroImage. 2008a;39:1832–1838. doi: 10.1016/j.neuroimage.2007.11.003. [DOI] [PubMed] [Google Scholar]
- Ferrarini L, Palm WM, Olofsen H, van der Landen R, van Buchem MA, Reiber JHC, Admiraal-Behloul F. Ventricular shape biomarkers for Alzheimer’s disease in clinical MR images. Magn Reson Med. 2008b;59:260–267. doi: 10.1002/mrm.21471. [DOI] [PubMed] [Google Scholar]
- Fischl B, Sereno MI, Dale AM. Cortical Surface-Based Analysis II: Inflation, Flattening, and a Surface-Based Coordinate System. NeuroImage. 1999a;9:195– 207. doi: 10.1006/nimg.1998.0396. [DOI] [PubMed] [Google Scholar]
- Fischl B, Sereno MI, Tootell RB, Dale AM. High-resolution intersubject averaging and a coordinate system for the cortical surface. Hum Brain Mapp. 1999b;8:272–284. doi: 10.1002/(SICI)1097-0193(1999)8:4<272::AID-HBM10>3.0.CO;2-4. [DOI] [PMC free article] [PubMed] [Google Scholar]
- Folstein MF, Folstein SE, McHugh PR. “Mini-mental state”. A practical method for grading the cognitive state of patients for the clinician. J Psychiatr Res. 1975;12:189–198. doi: 10.1016/0022-3956(75)90026-6. [DOI] [PubMed] [Google Scholar]
- Fox NC, Scahill RI, Crum WR, Rossor MN. Correlation between rates of brain atrophy and cognitive decline in AD. Neurology. 1999;52:1687–1689. doi: 10.1212/wnl.52.8.1687. [DOI] [PubMed] [Google Scholar]
- Frisoni GB, Fox NC, Jack CR, Scheltens P, Thompson PM. The clinical use of structural MRI in Alzheimer disease. Nat Rev Neurol. 2010;6:67–77. doi: 10.1038/nrneurol.2009.215. [DOI] [PMC free article] [PubMed] [Google Scholar]
- Gauthier S, Reisberg B, Zaudig M, Petersen RC, Ritchie K, Broich K, Belleville S, Brodaty H, Bennett D, Chertkow H, Cummings JL, de Leon M, Feldman H, Ganguli M, Hampel H, Scheltens P, Tierney MC, Whitehouse P, Winblad B. Mild cognitive impairment. Lancet. 2006;367:1262–1270. doi: 10.1016/S0140-6736(06)68542-5. [DOI] [PubMed] [Google Scholar]
- Gerig G, Styner M, Jones D, Weinberger D, Lieberman M. Shape analysis of brain ventricles using SPHARM. IEEE Workshop on Mathematical Methods in Biomedical Image Analysis (MMBIA’01).2001. [Google Scholar]
- Good CD, Johnsrude I, Ashburner J, RNH, Friston KJ, Frackowiak RS. Cerebral asymmetry and the effects of sex and handedness on brain structure: a voxel-based morphometric analysis of 465 normal adult human brains. NeuroImage. 2001;14:685–700. doi: 10.1006/nimg.2001.0857. [DOI] [PubMed] [Google Scholar]
- Gu X, Wang Y, Chan TF, Thompson PM, Yau ST. Genus zero surface conformal mapping and its application to brain surface mapping. IEEE Trans Med Imag. 2004;23:949–958. doi: 10.1109/TMI.2004.831226. [DOI] [PubMed] [Google Scholar]
- Gu X, Yau S-T. Computational Conformal Geometry. International Press of Boston; 2008. [Google Scholar]
- Gutman BA, Hua X, Rajagopalan P, Chou YY, Wang Y, Yanovsky I, Toga AW, Jack CR, Jr, Weiner MW, Thompson PM. Maximizing power to track Alzheimer’s disease and MCI progression by LDA-based weighting of longitudinal ventricular surface features. Neuroimage. 2013;70:386–401. doi: 10.1016/j.neuroimage.2012.12.052. [DOI] [PMC free article] [PubMed] [Google Scholar]
- Hamilton RS. The Ricci flow on surfaces. Contemp Math. 1988;71:237–262. [Google Scholar]
- Han X, Jovicich J, Salat D, Kouwe Avd, Quinn B, Czanner S, Busa E, Pacheco J, Albert M, Killiany R, Maguire P, Rosas D, Makris N, Dale A, Dickerson B, Fischl B. Reliability of MRI-derived measurements of human cerebral cortical thickness: The effects of field strength, scanner upgrade and manufacturer. NeuroImage. 2006;32:180–194. doi: 10.1016/j.neuroimage.2006.02.051. [DOI] [PubMed] [Google Scholar]
- Han X, Xu C, Prince JL. A topology preserving level set method for geometric deformable models. IEEE Trans Pattern Anal Mach Intell. 2003;25:755–768. [Google Scholar]
- Henneman WJ, Vrenken H, Barnes J, Sluimer IC, Verwey NA, Blankenstein MA, Klein M, Fox NC, Scheltens P, Barkhof F, van der Flier WM. Baseline CSF p-tau levels independently predict progression of hippocampal atrophy in Alzheimer disease. Neurology. 2009;73:935–940. doi: 10.1212/WNL.0b013e3181b879ac. [DOI] [PMC free article] [PubMed] [Google Scholar]
- Holland D, Brewer JB, Hagler DJ, Fenema-Notestine C, Dale AM. Subregional neuroanatomical change as a biomarker for Alzheimer’s disease. Proc Natl Acad Sci U S A. 2009;106:20954–20959. doi: 10.1073/pnas.0906053106. [DOI] [PMC free article] [PubMed] [Google Scholar]
- Hoppe H. Progressive meshes. Proceedings of the 23rd annual conference on Computer graphics and interactive techniques; ACM; 1996. pp. 99–108. [Google Scholar]
- Hua X, Gutman B, Boyle C, Rajagopalan P, Leow AD, Yanovsky I, Kumar AR, Toga AW, Jack CR, Jr, Schuff N, Alexander GE, Chen K, Reiman EM, Weiner MW, Thompson PM. Accurate measurement of brain changes in longitudinal MRI scans using tensor-based morphometry. Neuroimage. 2011;57:5–14. doi: 10.1016/j.neuroimage.2011.01.079. [DOI] [PMC free article] [PubMed] [Google Scholar]
- Hua X, Lee S, Hibar DP, Yanovsky I, Leow AD, Toga AW, Jack CR, Jr, Bernstein MA, Reiman EM, Harvey DJ, Kornak J, Schuff N, Alexander GE, Weiner MW, Thompson PM. Mapping Alzheimer’s disease progression in 1309 MRI scans: Power estimates for different inter-scan intervals. NeuroImage. 2010;51:63–75. doi: 10.1016/j.neuroimage.2010.01.104. [DOI] [PMC free article] [PubMed] [Google Scholar]
- Hurdal MK, Stephenson K. Cortical cartography using the discrete conformal approach of circle packings. Neuroimage. 2004;23:S119–S128. doi: 10.1016/j.neuroimage.2004.07.018. [DOI] [PubMed] [Google Scholar]
- Hurdal MK, Stephenson K. Discrete conformal methods for cortical brain flattening. Neuroimage. 2009;45:S86–98. doi: 10.1016/j.neuroimage.2008.10.045. [DOI] [PubMed] [Google Scholar]
- Hyman BT. Amyloid-dependent and amyloid-independent stages of Alzheimer disease. Arch Neurol. 2011;68:1062–1064. doi: 10.1001/archneurol.2011.70. [DOI] [PubMed] [Google Scholar]
- ICD. Mild cognitive impairment, so stated. ICD-9-CM Index to Diseases and Injuries (FY10) 2010 [online]. Available from ftp://ftp.cdc.gov/pub/Health_Statistics/NCHS/Publications/ICD9-CM/2009/
- Jack CR, Jr, Lowe VJ, Weigand SD, Wiste HJ, Senjem ML, Knopman DS, Shiung MM, Gunter JL, Boeve BF, Kemp BJ, Weiner M, Petersen RC. Serial PIB and MRI in normal, mild cognitive impairment and Alzheimer’s disease: implications for sequence of pathological events in Alzheimer’s disease. Brain. 2009;132:1355–1365. doi: 10.1093/brain/awp062. [DOI] [PMC free article] [PubMed] [Google Scholar]
- Jack CR, Jr, Shiung MM, Gunter JL, O’Brien PC, Weigand SD, Knopman DS, Boeve BF, Ivnik RJ, Smith GE, Cha RH, Tangalos EG, Petersen RC. Comparison of different MRI brain atrophy rate measures with clinical disease progression in AD. Neurology. 2004;62:591–600. doi: 10.1212/01.wnl.0000110315.26026.ef. [DOI] [PMC free article] [PubMed] [Google Scholar]
- Jack CR, Jr, Slomkowski M, Gracon S, Hoover TM, Felmlee JP, Stewart K, Xu Y, Shiung M, O’Brien PC, Cha R, Knopman D, Petersen RC. MRI as a biomarker of disease progression in a therapeutic trial of milameline for AD. Neurology. 2003;60:253–260. doi: 10.1212/01.wnl.0000042480.86872.03. [DOI] [PMC free article] [PubMed] [Google Scholar]
- Jack CR, Jr, Weigand SD, Shiung MM, Przybelski SA, O’Brien PC, Gunter JL, Knopman DS, Boeve BF, Smith GE, Petersen RC. Atrophy rates accelerate in amnestic mild cognitive impairment. Neurology. 2008;70:1740–1752. doi: 10.1212/01.wnl.0000281688.77598.35. [DOI] [PMC free article] [PubMed] [Google Scholar]
- Jack CR, Jr, Wiste HJ, Vemuri P, Weigand SD, Senjem ML, Zeng G, Bernstein MA, Gunter JL, Pankratz VS, Aisen PS, Weiner MW, Petersen RC, Shaw LM, Trojanowski JQ, Knopman DS. Brain beta-amyloid measures and magnetic resonance imaging atrophy both predict time-to-progression from mild cognitive impairment to Alzheimer’s disease. Brain. 2010;133:3336–3348. doi: 10.1093/brain/awq277. [DOI] [PMC free article] [PubMed] [Google Scholar]
- Jeong HS, Lee S, Yoon S, Jung JJ, Cho HB, Kim BN, Ma J, Ko E, Im JJ, Ban S, Renshaw PF, Lyoo IK. Morphometric abnormalities of the lateral ventricles in methamphetamine-dependent subjects. Drug Alcohol Depend. 2013;131:222–229. doi: 10.1016/j.drugalcdep.2013.05.009. [DOI] [PMC free article] [PubMed] [Google Scholar]
- Jin M, Kim J, Luo F, Gu X. Discrete surface Ricci flow. IEEE Trans Vis Comput Graph. 2008;14:1030–1043. doi: 10.1109/TVCG.2008.57. [DOI] [PubMed] [Google Scholar]
- Joshi AA, Shattuck DW, Thompson PM, Leahy RM. Surface-Constrained Volumetric Brain Registration Using Harmonic Mappings. IEEE Trans Med Imag. 2007;26:1657–1669. doi: 10.1109/tmi.2007.901432. [DOI] [PMC free article] [PubMed] [Google Scholar]
- Joshi SH, Bowman I, Toga AW, Van Horn JD. Brain pattern analysis of cortical valued distributions. IEEE International Symposium on Biomedical Imaging: from nano to macro; 2011. pp. 1117–1120. [DOI] [PMC free article] [PubMed] [Google Scholar]
- Killgore WDS, Schwab ZJ, Kipman M, DelDonno SR, Weber M. Voxel-based morphometric gray matter correlates of daytime sleepiness. Neuroscience Letters. 2012;518:10–13. doi: 10.1016/j.neulet.2012.04.029. [DOI] [PubMed] [Google Scholar]
- Kremen WS, Panizzon MS, Neale MC, Fennema-Notestine C, Prom-Wormley E, Eyler LT, Stevens A, Franz CE, Lyons MJ, Grant MD, Jak AJ, Jernigan TL, Xian H, Fischl B, Thermenos HW, Seidman LJ, Tsuang MT, Dale AM. Heritability of brain ventricle volume: converging evidence from inconsistent results. Neurobiol Aging. 2012;33:1–8. doi: 10.1016/j.neurobiolaging.2010.02.007. [DOI] [PMC free article] [PubMed] [Google Scholar]
- Langbaum JB, Fleisher AS, Chen K, Ayutyanont N, Lopera F, Quiroz YT, Caselli RJ, Tariot PN, Reiman EM. Ushering in the study and treatment of preclinical Alzheimer disease. Nat Rev Neurol. 2013;9:371–381. doi: 10.1038/nrneurol.2013.107. [DOI] [PMC free article] [PubMed] [Google Scholar]
- Lao Y, Gajawelli N, Hass L, Wilkins B, Hwang D, Tsao S, Wang Y, Law M, Leporé N. 3D pre- versus post-season comparisons of surface and relative pose of the corpus callosum in contact sport athletes. SPIE, Medical Imaging 2014 [Google Scholar]
- Lao Y, Shi J, Wang Y, Ceschin R, Hwang D, Nelson MD, Panigrahy A, Leporé N. Statistical Analysis of Relative Pose of the Thalamus in Preterm Neonates. MICCAI workshop on CLinical Imagebased Procedures (CLIP 2013): Translational Research in Medical Imaging; 2013. pp. 1–9. [DOI] [PMC free article] [PubMed] [Google Scholar]
- Lee JH, Yoon S, Renshaw PF, Kim TS, Jung JJ, Choi Y, Kim BN, Jacobson AM, Lyoo IK. Morphometric changes in lateral ventricles of patients with recent-onset type 2 diabetes mellitus. PLoS One. 2013;8:e60515. doi: 10.1371/journal.pone.0060515. [DOI] [PMC free article] [PubMed] [Google Scholar]
- Leech R, Sharp DJ. The role of the posterior cingulate cortex in cognition and disease. Brain. 2014;137:12–32. doi: 10.1093/brain/awt162. [DOI] [PMC free article] [PubMed] [Google Scholar]
- Leow AD, Yanovsky I, Parikshak N, Hua X, Lee S, Toga AW, Jack CR, Jr, Bernstein MA, Britson PJ, Gunter JL, Ward CP, Borowski B, Shaw LM, Trojanowski JQ, Fleisher AS, Harvey D, Kornak J, Schuff N, Alexander GE, Weiner MW, Thompson PM. Alzheimer’s disease neuroimaging initiative: a one-year follow up study using tensor-based morphometry correlating degenerative rates, biomarkers and cognition. Neuroimage. 2009;45:645–655. doi: 10.1016/j.neuroimage.2009.01.004. [DOI] [PMC free article] [PubMed] [Google Scholar]
- Li K, Guo L, Li G, Nie J, Faraco C, Cui G, Zhao Q, Miller LS, Liu T. Gyral folding pattern analysis via surface profiling. NeuroImage. 2010;52:1202–1214. doi: 10.1016/j.neuroimage.2010.04.263. [DOI] [PMC free article] [PubMed] [Google Scholar]
- Li Y, Wang Y, Wu G, Shi F, Zhou L, Lin W, Shen D. Discriminant analysis of longitudinal cortical thickness changes in Alzheimer’s disease using dynamic and network features. Neurobiol Aging. 2012;33:427, e415–430. doi: 10.1016/j.neurobiolaging.2010.11.008. [DOI] [PMC free article] [PubMed] [Google Scholar]
- Liu S, Cai W, Wen L, Feng DD, Pujol S, Kikinis R, Fulham MJ, Eberl S. Multi-Channel neurodegenerative pattern analysis and its application in Alzheimer’s disease characterization. Computerized Medical Imaging and Graphics. 2014 doi: 10.1016/j.compmedimag.2014.05.003. In Press. [DOI] [PMC free article] [PubMed] [Google Scholar]
- Loop C. Smooth Subdivision Surfaces Based on Triangles. Mathematics Department. University of Utah; 1987. [Google Scholar]
- Lorensen WE, Cline HE. Marching cubes: A high resolution 3D surface construction algorithm. SIGGRAPH Comput Graph. 1987;21:163–169. [Google Scholar]
- Luders E, Thompson PM, Kurth F, Hong JY, Phillips OR, Wang Y, Gutman BA, Chou YY, Narr KL, Toga AW. Global and regional alterations of hippocampal anatomy in long-term meditation practitioners. Hum Brain Mapp. 2013;34:3369–3375. doi: 10.1002/hbm.22153. [DOI] [PMC free article] [PubMed] [Google Scholar]
- Luo F, Gu X, Dai J. Variational principles on discrete Surfaces. International Press; 2008. [Google Scholar]
- Madsen SK, Ho AJ, Hua X, Saharan PS, Toga AW, Jack CR, Jr, Weiner MW, Thompson PM. 3D maps localize caudate nucleus atrophy in 400 AD, MCI, and healthy elderly subjects. Neurobiol Aging. 2010;31:1312–1325. doi: 10.1016/j.neurobiolaging.2010.05.002. [DOI] [PMC free article] [PubMed] [Google Scholar]
- Matsuda H. Role of neuroimaging in Alzheimer’s disease, with emphasis on brain perfusion SPECT. J Nucl Med. 2007a;48:1289–1300. doi: 10.2967/jnumed.106.037218. [DOI] [PubMed] [Google Scholar]
- Matsuda H. The role of neuroimaging in mild cognitive impairment. Neuropathology. 2007b;27:570–577. doi: 10.1111/j.1440-1789.2007.00794.x. [DOI] [PubMed] [Google Scholar]
- McEvoy LK, Fennema-Notestine C, Roddey JC, Hagler DJ, Jr, Holland D, Karow DS, Pung CJ, Brewer JB, Dale AM. Alzheimer disease: quantitative structural neuroimaging for detection and prediction of clinical and structural changes in mild cognitive impairment. Radiology. 2009;251:195–205. doi: 10.1148/radiol.2511080924. [DOI] [PMC free article] [PubMed] [Google Scholar]
- Mechelli A, Price CJ, Friston KJ, Ashburner J. Voxel-based Morphometry of the Human Brain: Methods and Applications. Current Medical Imaging Reviews. 2005;1:105. [Google Scholar]
- Monje M, Thomason ME, Rigolo L, Wang Y, Waber DP, Sallan SE, Golby AJ. Functional and structural differences in the hippocampus associated with memory deficits in adult survivors of acute lymphoblastic leukemia. Pediatr Blood Cancer. 2013;60:293–300. doi: 10.1002/pbc.24263. [DOI] [PMC free article] [PubMed] [Google Scholar]
- Morra JH, Tu Z, Apostolova LG, Green AE, Avedissian C, Madsen SK, Parikshak N, Toga AW, Jack CR, Jr, Schuff N, Weiner MW, Thompson PM. Automated mapping of hippocampal atrophy in 1-year repeat MRI data from 490 subjects with Alzheimer’s disease, mild cognitive impairment, and elderly controls. NeuroImage. 2009;45:S3–S15. doi: 10.1016/j.neuroimage.2008.10.043. [DOI] [PMC free article] [PubMed] [Google Scholar]
- Nichols TE, Holmes AP. Nonparametric permutation tests for functional neuroimaging: a primer with examples. Hum Brain Mapp. 2002;15:1–25. doi: 10.1002/hbm.1058. [DOI] [PMC free article] [PubMed] [Google Scholar]
- Niedtfeld II, Schulze L, Krause-Utz A, Demirakca T, Bohus M, Schmahl C. Voxel-Based Morphometry in Women with Borderline Personality Disorder with and without Comorbid Posttraumatic Stress Disorder. PLoS ONE. 2013;8:e65824. doi: 10.1371/journal.pone.0065824. [DOI] [PMC free article] [PubMed] [Google Scholar]
- Paniagua B, Bompard L, Cates J, Whitaker R, Datar M, Vachet C, Styner M. Combined SPHARM-PDM and entropy-based particle systems shape analysis framework. SPIE Conference 8317 Progress in Biomedical Optics and Imaging; 2012. [DOI] [PMC free article] [PubMed] [Google Scholar]
- Paniagua B, Lyall A, Berger JB, Vachet C, Hamer RM, Woolson S, Lin W, Gilmore J, Styner M. Lateral ventricle morphology analysis via mean latitude axis. Proc Soc Photo Opt Instrum Eng. 2013:8672. doi: 10.1117/12.2006846. [DOI] [PMC free article] [PubMed] [Google Scholar]
- Petersen RC. Clinical practice. Mild cognitive impairment. N Engl J Med. 2011;364:2227–2234. doi: 10.1056/NEJMcp0910237. [DOI] [PubMed] [Google Scholar]
- Petersen RC, Jack CR., Jr Imaging and biomarkers in early Alzheimer’s disease and mild cognitive impairment. Clin Pharmacol Ther. 2009;86:438–441. doi: 10.1038/clpt.2009.166. [DOI] [PMC free article] [PubMed] [Google Scholar]
- Pihlajamaki M, Jauhiainen AM, Soininen H. Structural and functional MRI in mild cognitive impairment. Curr Alzheimer Res. 2009;6:179–185. doi: 10.2174/156720509787602898. [DOI] [PubMed] [Google Scholar]
- Qiu A, Brown T, Fischl B, Ma J, Miller MI. Atlas generation for subcortical and ventricular structures with its applications in shape analysis. IEEE Trans Image Process. 2010;19:1539–1547. doi: 10.1109/TIP.2010.2042099. [DOI] [PMC free article] [PubMed] [Google Scholar]
- Reiman EM, Jagust WJ. Brain imaging in the study of Alzheimer’s disease. Neuroimage. 2012;61:505–516. doi: 10.1016/j.neuroimage.2011.11.075. [DOI] [PMC free article] [PubMed] [Google Scholar]
- Reiman EM, Uecker A, Caselli RJ, Lewis S, Bandy D, de Leon MJ, De Santi S, Convit A, Osborne D, Weaver A, Thibodeau SN. Hippocampal volumes in cognitively normal persons at genetic risk for Alzheimer’s disease. Ann Neurol. 1998;44:288–291. doi: 10.1002/ana.410440226. [DOI] [PubMed] [Google Scholar]
- Rey A. L’examen clinique en psychologie. Presses Universitaires de France; Paris: 1964. [Google Scholar]
- Ridha BH, Anderson VM, Barnes J, Boyes RG, Price SL, Rossor MN, Whitwell JL, Jenkins L, Black RS, Grundman M, Fox NC. Volumetric MRI and cognitive measures in Alzheimer disease: comparison of markers of progression. J Neurol. 2008;255:567–574. doi: 10.1007/s00415-008-0750-9. [DOI] [PubMed] [Google Scholar]
- Roberts JS, Karlawish JH, Uhlmann WR, Petersen RC, Green RC. Mild cognitive impairment in clinical care: a survey of American Academy of Neurology members. Neurology. 2010;75:425–431. doi: 10.1212/WNL.0b013e3181eb5872. [DOI] [PMC free article] [PubMed] [Google Scholar]
- Rosen WG, Mohs RC, Davis KL. A new rating scale for Alzheimer’s disease. Am J Psychiatry. 1984;141:1356–1364. doi: 10.1176/ajp.141.11.1356. [DOI] [PubMed] [Google Scholar]
- Samtani MN, Farnum M, Lobanov V, Yang E, Raghavan N, Dibernardo A, Narayan V. An improved model for disease progression in patients from the Alzheimer’s disease neuroimaging initiative. J Clin Pharmacol. 2012;52:629–644. doi: 10.1177/0091270011405497. [DOI] [PubMed] [Google Scholar]
- Schraml F, Chen K, Ayutyanont N, Auttawut R, Langbaum JB, Lee W, Liu X, Bandy D, Reeder SQ, Alexander GE, Caselli RJ, Fleisher AS, Reiman EM. Association between an Alzheimer’s Disease-Related Index and Gene Dose. PLoS One. 2013;8:e67163. doi: 10.1371/journal.pone.0067163. [DOI] [PMC free article] [PubMed] [Google Scholar]
- Seo S, Chung MK, Vorperian HK. Heat kernel smoothing using Laplace-Beltrami eigenfunctions. 13th International Conference on Medical Image Computing and Computer Assisted Intervention (MICCAI); 2010. pp. 505–512. [DOI] [PMC free article] [PubMed] [Google Scholar]
- Shattuck DW, Leahy RM. BrainSuite: an automated cortical surface identification tool. Med Image Anal. 2002;6:129–142. doi: 10.1016/s1361-8415(02)00054-3. [DOI] [PubMed] [Google Scholar]
- Shi J, Lepore N, Gutman BA, Thompson PM, Baxter LC, Caselli RJ, Wang Y. Genetic influence of apolipoprotein E4 genotype on hippocampal morphometry: An N = 725 surface-based Alzheimer’s disease neuroimaging initiative study. Hum Brain Mapp. 2014 doi: 10.1002/hbm.22447. [DOI] [PMC free article] [PubMed] [Google Scholar]
- Shi J, Thompson PM, Gutman B, Wang Y. Surface fluid registration of conformal representation: application to detect disease effect and genetic influence on hippocampus. NeuroImage. 2013a;78:111–134. doi: 10.1016/j.neuroimage.2013.04.018. [DOI] [PMC free article] [PubMed] [Google Scholar]
- Shi J, Thompson PM, Wang Y. Hyperbolic Ricci Flow and Its Application in Studying Lateral Ventricle Morphometry. In: Yap P-T, Liu T, Shen D, Westin C-F, Shen L, editors. Multimodal Brain Image Analysis. Springer; Berlin Heidelberg: 2012. pp. 61–76. [Google Scholar]
- Shi J, Wang Y, Ceschin R, An X, Lao Y, Vanderbilt D, Nelson MD, Thompson PM, Panigrahy A, Lepore N. A multivariate surface-based analysis of the putamen in premature newborns: regional differences within the ventral striatum. PLoS One. 2013b;8:e66736. doi: 10.1371/journal.pone.0066736. [DOI] [PMC free article] [PubMed] [Google Scholar]
- Shi R, Zeng W, Su Z, Damasio H, Lu Z, Wang Y, Yau S-T, Gu X. Hyperbolic Harmonic Mapping for Constrained Brain Registration. IEEE Conf Comp Vis Patt Recog CVPR ‘13 2013c [Google Scholar]
- Shi R, Zeng W, Su Z, Wang Y, Damasio H, Lu Z, Yau S-T, Gu X. Hyperbolic Harmonic Brain Surface Registration with Curvature-based Landmark Matching. Information Processing in Medical Imaging, 23rd International Conference (IPMI); Asilomar, CA. 2013d. [DOI] [PubMed] [Google Scholar]
- Small GW, Kepe V, Ercoli LM, Siddarth P, Bookheimer SY, Miller KJ, Lavretsky H, Burggren AC, Cole GM, Vinters HV, Thompson PM, Huang SC, Satyamurthy N, Phelps ME, Barrio JR. PET of brain amyloid and tau in mild cognitive impairment. N Engl J Med. 2006;355:2652–2663. doi: 10.1056/NEJMoa054625. [DOI] [PubMed] [Google Scholar]
- Small GW, Siddarth P, Burggren AC, Kepe V, Ercoli LM, Miller KJ, Lavretsky H, Thompson PM, Cole GM, Huang SC, Phelps ME, Bookheimer SY, Barrio JR. Influence of cognitive status, age, and APOE-4 genetic risk on brain FDDNP positron-emission tomography imaging in persons without dementia. Arch Gen Psychiatry. 2009;66:81–87. doi: 10.1001/archgenpsychiatry.2008.516. [DOI] [PMC free article] [PubMed] [Google Scholar]
- Sowell ER, Thompson PM, Rex D, Kornsand D, Tessner KD, Jernigan TL, Toga AW. Mapping sulcal pattern asymmetry and local cortical surface gray matter distribution in vivo: maturation in perisylvian cortices. Cereb Cortex. 2002;12:17–26. doi: 10.1093/cercor/12.1.17. [DOI] [PubMed] [Google Scholar]
- Stephenson K. Introduction to Circle Packing: The Theory of Discrete Analytic Functions. Cambridge University Press; 2005. [Google Scholar]
- Stonnington CM, Chu C, Kloppel S, Jack CR, Jr, Ashburner J, Frackowiak RS. Predicting clinical scores from magnetic resonance scans in Alzheimer’s disease. Neuroimage. 2010;51:1405–1413. doi: 10.1016/j.neuroimage.2010.03.051. [DOI] [PMC free article] [PubMed] [Google Scholar]
- Styner M, Lieberman JA, McClure RK, Weinberger DR, Jones DW, Gerig G. Morphometric analysis of lateral ventricles in schizophrenia and healthy controls regarding genetic and disease-specific factors. Proc Natl Acad Sci U S A. 2005;102:4872–4877. doi: 10.1073/pnas.0501117102. [DOI] [PMC free article] [PubMed] [Google Scholar]
- Styner M, Oguz I, Xu S, Brechbühler C, Pantazis D, Levitt JL, Shenton ME, Gerig G. Framework for the Statistical Shape Analysis of Brain Structures using SPHARM-PDM. Insight Journal. 2006:242–250. [PMC free article] [PubMed] [Google Scholar]
- Tae WS, Kim SS, Lee KU, Nam EC, Choi JW, Park JI. Hippocampal shape deformation in female patients with unremitting major depressive disorder. AJNR Am J Neuroradiol. 2011;32:671–676. doi: 10.3174/ajnr.A2367. [DOI] [PMC free article] [PubMed] [Google Scholar]
- Tang X, Holland D, Dale AM, Younes L, Miller MI. Shape abnormalities of subcortical and ventricular structures in mild cognitive impairment and Alzheimer’s disease: Detecting, quantifying, and predicting. Hum Brain Mapp. 2014 doi: 10.1002/hbm.22431. [DOI] [PMC free article] [PubMed] [Google Scholar]
- Thompson PM, Dutton RA, Hayashi KM, Lu A, Lee SE, Lee JY, Lopez OL, Aizenstein HJ, Toga AW, Becker JT. 3D Mapping of Ventricular and Corpus Callosum Abnormalities in HIV/AIDS. NeuroImage. 2006;31:12–23. doi: 10.1016/j.neuroimage.2005.11.043. [DOI] [PubMed] [Google Scholar]
- Thompson PM, Giedd JN, Woods RP, MacDonald D, Evans AC, Toga AW. Growth Patterns in the Developing Human Brain Detected Using Continuum-Mechanical Tensor Mapping. Nature. 2000;404:190–193. doi: 10.1038/35004593. [DOI] [PubMed] [Google Scholar]
- Thompson PM, Hayashi KM, de Zubicaray GI, Janke AL, Rose SE, Semple J, Hong MS, Herman DH, Gravano D, Doddrell DM, Toga AW. Mapping hippocampal and ventricular change in Alzheimer’s disease. NeuroImage. 2004a;22:1754–1766. doi: 10.1016/j.neuroimage.2004.03.040. [DOI] [PubMed] [Google Scholar]
- Thompson PM, Hayashi KM, Sowell ER, Gogtay N, Giedd JN, Rapoport JL, de Zubicaray GI, Janke AL, Rose SE, Semple J, Doddrell DM, Wang Y, van Erp TGM, Cannon TD, Toga AW. Mapping cortical change in Alzheimer’s disease, brain development, and schizophrenia. NeuroImage. 2004b;23:S2–S18. doi: 10.1016/j.neuroimage.2004.07.071. [DOI] [PubMed] [Google Scholar]
- Thompson PM, Hayashi KM, Zubicaray GD, Janke AL, Rose SE, Semple J, Herman D, Hong MS, Dittmer SS, Doddrell DM, Toga AW. Dynamics of Gray Matter Loss in Alzheimer’s Disease. J Neuroscience. 2003;23:994–1005. doi: 10.1523/JNEUROSCI.23-03-00994.2003. [DOI] [PMC free article] [PubMed] [Google Scholar]
- Thompson PM, Toga AW. A Framework for Computational Anatomy. Computing and Visualization in Science. 2002;5:1–12. [Google Scholar]
- Thurston WP. Princeton lecture notes. 1976. Geometry and Topology of Three-Manifolds. [Google Scholar]
- Toledo JB, Cairns NJ, Da X, Chen K, Carter D, Fleisher A, Householder E, Ayutyanont N, Roontiva A, Bauer RJ, Eisen P, Shaw LM, Davatzikos C, Weiner MW, Reiman EM, Morris JC, Trojanowski JQ. Clinical and multimodal biomarker correlates of ADNI neuropathological findings. Acta Neuropathol Commun. 2013;1:65. doi: 10.1186/2051-5960-1-65. [DOI] [PMC free article] [PubMed] [Google Scholar]
- Tsui A, Fenton D, Vuong P, Hass J, Koehl P, Amenta N, Coeurjolly D, DeCarli C, Carmichael O. Globally optimal cortical surface matching with exact landmark correspondence. Proceedings of the 23rd international conference on Information Processing in Medical Imaging; Asilomar, CA: Springer-Verlag; 2013. pp. 487–498. [DOI] [PMC free article] [PubMed] [Google Scholar]
- Vemuri P, Gunter JL, Senjem ML, Whitwell JL, Kantarci K, Knopman DS, Boeve BF, Petersen RC, Jack CR., Jr Alzheimer’s disease diagnosis in individual subjects using structural MR images: validation studies. NeuroImage. 2008a;39:1186–1197. doi: 10.1016/j.neuroimage.2007.09.073. [DOI] [PMC free article] [PubMed] [Google Scholar]
- Vemuri P, Whitwell JL, Kantarci K, Josephs KA, Parisi JE, Shiung MS, Knopman DS, Boeve BF, Petersen RC, Dickson DW, Jack CR., Jr Antemortem MRI based STructural Abnormality iNDex (STAND)-scores correlate with postmortem Braak neurofibrillary tangle stage. NeuroImage. 2008b;42:559–567. doi: 10.1016/j.neuroimage.2008.05.012. [DOI] [PMC free article] [PubMed] [Google Scholar]
- Vemuri P, Wiste HJ, Weigand SD, Knopman DS, Trojanowski JQ, Shaw LM, Bernstein MA, Aisen PS, Weiner M, Petersen RC, Jack CR., Jr Serial MRI and CSF biomarkers in normal aging, MCI, and AD. Neurology. 2010;75:143–151. doi: 10.1212/WNL.0b013e3181e7ca82. [DOI] [PMC free article] [PubMed] [Google Scholar]
- Wang G, Zhang X, Su Q, Chen J, Wang L, Ma Y, Liu Q, Xu L, Shi J, Wang Y. A Heat Kernel Based Cortical Thickness Estimation Algorithm. In: Shen L, Liu T, Yap P-T, Huang H, Shen D, Westin C-F, editors. Multimodal Brain Image Analysis. Springer International Publishing; 2013a. pp. 233–245. [Google Scholar]
- Wang G, Zhang X, Su Q, Shi J, Caselli RJ, Wang Y. A Novel Cortical Thickness Estimation Method based on Volumetric Laplace-Beltrami Operator and Heat Kernel. Medical Image Analysis. 2014 doi: 10.1016/j.media.2015.01.005. (Under Revision) [DOI] [PMC free article] [PubMed] [Google Scholar]
- Wang Y, Chan TF, Toga AW, Thompson PM. Multivariate Tensor-based Brain Anatomical Surface Morphometry via Holomorphic One-Forms. Med Image Comput Comput Assist Interv Proceedings. 2009a;12:337–344. doi: 10.1007/978-3-642-04268-3_42. [DOI] [PMC free article] [PubMed] [Google Scholar]
- Wang Y, Dai W, Chou Y, Gu X, Chan TF, Toga AW, Thompson PM. Studying Brain Morphology using Conformal Equivalence Class. IEEE 12th International Conference on Computer Vision 2009, ICCV 2009; 2009b. pp. 2365–2372. [Google Scholar]
- Wang Y, Dai W, Gu X, Chan TF, Yau ST, Toga AW, Thompson PM. Teichmüller shape space theory and its application to brain morphometry. Med Image Comput Comput Assist Interv Proceedings. 2009c;12:133–140. doi: 10.1007/978-3-642-04271-3_17. [DOI] [PubMed] [Google Scholar]
- Wang Y, Gu X, Chan TF, Thompson PM, Yau S-T. Brain Surface Conformal Parameterization with Algebraic Functions. Med Image Comput Comput Assist Interv Proceedings, Part II; 2006. pp. 946–954. [DOI] [PubMed] [Google Scholar]
- Wang Y, Lui LM, Gu X, Hayashi KM, Chan TF, Toga AW, Thompson PM, Yau ST. Brain Surface Conformal Parameterization using Riemann Surface Structure. IEEE Trans Med Imag. 2007;26:853–865. doi: 10.1109/TMI.2007.895464. [DOI] [PMC free article] [PubMed] [Google Scholar]
- Wang Y, Shi J, Yin X, Gu X, Chan TF, Yau ST, Toga AW, Thompson PM. Brain Surface Conformal Parameterization with the Ricci Flow. IEEE Trans Med Imag. 2012;31:251–264. doi: 10.1109/TMI.2011.2168233. [DOI] [PMC free article] [PubMed] [Google Scholar]
- Wang Y, Song Y, Rajagopalan P, An T, Liu K, Chou YY, Gutman B, Toga AW, Thompson PM. Surface-based TBM boosts power to detect disease effects on the brain: An N=804 ADNI study. Neuroimage. 2011;56:1993–2010. doi: 10.1016/j.neuroimage.2011.03.040. [DOI] [PMC free article] [PubMed] [Google Scholar]
- Wang Y, Yuan L, Shi J, Greve A, Ye J, Toga AW, Reiss AL, Thompson PM. Applying tensor-based morphometry to parametric surfaces can improve MRI-based disease diagnosis. NeuroImage. 2013b;74:209–230. doi: 10.1016/j.neuroimage.2013.02.011. [DOI] [PMC free article] [PubMed] [Google Scholar]
- Wang Y, Zhang J, Chan TF, Toga AW, Thompson PM. Brain Surface Conformal Parameterization with Holomorphic Flow Method and Its Application to HIV/AIDS. NeuroImage. 2009d;47:99. [Google Scholar]
- Wang Y, Zhang J, Chan TF, Toga AW, Thompson PM. Multivariate Tensor-based Morphometry on Surfaces: Application to Mapping Ventricular Changes in HIV/AIDS. IEEE International Symposium on Biomedical Imaging: From Nano to Macro, 2009 (ISBI 2009).2009e. [Google Scholar]
- Wang Y, Zhang J, Gutman B, Chan TF, Becker JT, Aizenstein HJ, Lopez OL, Tamburo RJ, Toga AW, Thompson PM. Multivariate tensor-based morphometry on surfaces: Application to mapping ventricular abnormalities in HIV/AIDS. NeuroImage. 2010;49:2141–2157. doi: 10.1016/j.neuroimage.2009.10.086. [DOI] [PMC free article] [PubMed] [Google Scholar]
- Weiner MW, Veitch DP, Aisen PS, Beckett LA, Cairns NJ, Green RC, Harvey D, Jack CR, Jagust W, Liu E, Morris JC, Petersen RC, Saykin AJ, Schmidt ME, Shaw L, Siuciak JA, Soares H, Toga AW, Trojanowski JQ. The Alzheimer’s Disease Neuroimaging Initiative: a review of papers published since its inception. Alzheimers Dement. 2012;8:S1–68. doi: 10.1016/j.jalz.2011.09.172. [DOI] [PMC free article] [PubMed] [Google Scholar]
- Westman E, Aguilar C, Muehlboeck JS, Simmons A. Regional magnetic resonance imaging measures for multivariate analysis in Alzheimer’s disease and mild cognitive impairment. Brain Topogr. 2013;26:9–23. doi: 10.1007/s10548-012-0246-x. [DOI] [PMC free article] [PubMed] [Google Scholar]
- Whitwell JL. Voxel-based morphometry: an automated technique for assessing structural changes in the brain. The Journal of Neuroscience. 2009;29:9661–9664. doi: 10.1523/JNEUROSCI.2160-09.2009. [DOI] [PMC free article] [PubMed] [Google Scholar]
- Whitwell JL, Josephs KA, Murray ME, Kantarci K, Przybelski SA, Weigand SD, Vemuri P, Senjem ML, Parisi JE, Knopman DS, Boeve BF, Petersen RC, Dickson DW, Jack CR., Jr MRI correlates of neurofibrillary tangle pathology at autopsy: a voxel-based morphometry study. Neurology. 2008;71:743–749. doi: 10.1212/01.wnl.0000324924.91351.7d. [DOI] [PMC free article] [PubMed] [Google Scholar]
- Wolf H, Jelic V, Gertz HJ, Nordberg A, Julin P, Wahlund LO. A critical discussion of the role of neuroimaging in mild cognitive impairment. Acta Neurol Scand Suppl. 2003;179:52–76. doi: 10.1034/j.1600-0404.107.s179.10.x. [DOI] [PubMed] [Google Scholar]
- Wolz R, Heckemann RA, Aljabar P, Hajnal JV, Hammers A, Lötjönen J, Rueckert D. Measurement of hippocampal atrophy using 4D graph-cut segmentation: Application to ADNI. NeuroImage. 2010;52:109–118. doi: 10.1016/j.neuroimage.2010.04.006. [DOI] [PubMed] [Google Scholar]
- Yeo BT, Sabuncu MR, Vercauteren T, Ayache N, Fischl B, Golland P. Spherical demons: fast diffeomorphic landmark-free surface registration. IEEE Trans Med Imaging. 2010;29:650–668. doi: 10.1109/TMI.2009.2030797. [DOI] [PMC free article] [PubMed] [Google Scholar]
- Zeng W, Samaras D, Gu XD. Ricci flow for 3D shape analysis. IEEE Trans Pattern Anal Mach Intell. 2010;32:662–677. doi: 10.1109/TPAMI.2009.201. [DOI] [PubMed] [Google Scholar]