

Abstract
Brain lateralization is a widely studied topic, however there has been little work focused on lateralization of intrinsic networks (regions showing similar patterns of covariation among voxels) in the resting brain. In this study, we evaluate resting state network lateralization in an age and gender-balanced functional magnetic resonance imaging (fMRI) dataset comprising over 600 healthy subjects ranging in age from 12 to 71. After establishing sample-wide network lateralization properties, we continue with an investigation of age and gender effects on network lateralization. All data was gathered on the same scanner and preprocessed using an automated pipeline (Scott et al., 2011). Networks were extracted via group independent component analysis (gICA) (Calhoun, Adali, Pearlson, & Pekar, 2001). Twenty-eight resting state networks discussed in previous (Allen et al., 2011) work were re-analyzed with a focus on lateralization. We calculated homotopic voxelwise measures of laterality in addition to a global lateralization measure, called the laterality cofactor, for each network. As expected, many of the intrinsic brain networks were lateralized. For example, the visual network was strongly right lateralized, auditory network and default mode networks were mostly left lateralized. Attentional and frontal networks included nodes that were left lateralized and other nodes that were right lateralized. Age was strongly related to lateralization in multiple regions including sensorimotor network regions precentral gyrus, postcentral gyrus and supramarginal gyrus; and visual network regions lingual gyrus; attentional network regions inferior parietal lobule, superior parietal lobule and middle temporal gyrus; and frontal network regions including the inferior frontal gyrus. Gender showed significant effects mainly in two regions, including visual and frontal networks. For example, the inferior frontal gyrus was more right lateralized in males. Significant effects of age were found in sensorimotor and visual networks on the global measure. In summary, we report a large-sample of lateralization study that finds intrinsic functional brain networks to be highly lateralized, with regions that are strongly related to gender and age locally, and with age a strong factor in lateralization, and gender exhibiting a trend-level effect on global measures of laterality.
Keywords: laterality, resting state, gender differences, aging, fMRI
Introduction
The idea that the two halves of our brain's cerebral cortex perform different functions has been known for centuries, starting with the seminal observations by Paul Broca (Broca, 1861) and Carl Wernicke (Wernicke, 1874), and later confirmed and extended by the work of Roger Sperry (Sperry, 1974) and numerous others (see (Kenneth Hugdahl & Westerhausen, 2010) for an overview of research on brain laterality). In humans, the left hemisphere has been shown to be involved with functions associated with language such as grammar and vocabulary, as well as analytical and logical functions, while the right hemisphere is associated with non-verbal functions such as visuospatial, intuitive and sensory tasks (Breier, Simos, Zouridakis, & Papanicolaou, 1999; Cai, Van der Haegen, & Brysbaert, 2013; Clements et al., 2006; Gobbele et al., 2008; Gotts et al., 2013; Groen, Whitehouse, Badcock, & Bishop, 2012; Smith, Jonides, & Koeppe, 1996; Stephan et al., 2003; Thomason et al., 2009). Other studies have probed how lateralization of the brain effects our perception of color, the formation of language, our understanding of mathematics (Herve, Zago, Petit, Mazoyer, & Tzourio-Mazoyer, 2013), and a whole range of other cognitive and emotional functions (Davidson, 1998; Hellige, 1993). Furthermore, research shows that lateralization is not uniquely human; cerebral lateralization has also been shown to occur in non-human primates (Bianki, 1981; Corballis, 2014; Denenberg, 1981; Denenberg, Garbanati, Sherman, Yutzey, & Kaplan, 1978; Hauser & Andersson, 1994) and songbirds (Bottjer, Glaessner, & Arnold, 1985; Nottebohm, 1970).
The invention of modern brain imaging techniques, such as positron emission tomography (PET) and fMRI, provide a new set of tools with which to study cerebral lateralization (Kenneth Hugdahl, 2011). Even though there have been several studies related to cerebral lateralization using PET or fMRI, most of them are focused on lateralization in task-related data. Very few studies on lateralization of brain activity at rest have been published. For example, (Liu, Stufflebeam, Sepulcre, Hedden, & Buckner, 2009) found 37 left lateralized and 47 right lateralized regions, and reported multiple separate factors contribute to lateralization of these regions and along with small sex differences. (Swanson et al., 2011) showed significant lateral differences between schizophrenia patients and healthy controls in the default mode network. (Gotts et al., 2013) claimed right and left hemispheres are lateralized in two distinct ways, left hemisphere preferably interacts more itself, while right hemisphere interacts with both hemispheres. (Nielsen, Zielinski, Ferguson, Lainhart, & Anderson, 2013) found 9 left and 11 right lateralized hubs on the resting brain and reported a small increase in lateralization with age and no gender effects. (Zuo et al., 2010) analysed the human brain's homotopic resting-state functional connectivity globally and found regions that are effected by aging linearly, quadratic and cubically, also observed homotopic differences on functional connectivity between genders. (Zuo et al., 2012) explores the connectivity within a whole brain functional network using 4 different type of network centrality measures based on graph theory approaches on a dataset combined from 21 centers. Results in that paper show that local or direct connectivity show a decrease with increasing age in connections with hub-like regions within the brain. (Filippi et al., 2013) reported higher resting state functional connectivity (RSFC) for men in parietal and occipital regions and higher functional connectivity (FNC) in cognitive and sensory regions, and higher RSFC for women in frontal, temporal regions, and in cerebellum, and higher FNC in attentional and right working memory networks. Moreover, (Zhu et al., 2014) found lateralization of speech production and reception areas in a small-scale (N = 25) resting state fMRI paradigm, but this analysis was restricted to the language area, not including other networks and network nodes.
Recent studies have indicated that both genetic and environmental factors can influence brain lateralization (Liu et al., 2009; Yoon, Fahim, Perusse, & Evans, 2010). While the idea that some cognitive functions are lateralized to left or right hemispheres has gained acceptance, there has been little work focusing on the lateralization of the brain's functional organization as assessed by functional connectivity, more specifically in the context of the lateralization of specific functional brain networks (rather than global measures of laterality). In addition, much of the previous brain imaging work has involved relatively small sample sizes, e.g. (Zhu et al., 2014) study only included 25 subjects and (Filippi et al., 2013) studied only 48/56 men/women subjects. In this work we focus on resting fMRI data from over 600 subjects, representing one of the largest single site studies of functional connectivity of the human brain. We re-analyze data previously presented in (Allen et al., 2011) with a focus on network lateralization. Using the functional networks detailed in (Allen et al., 2011), we assess gender and age effects on a local voxelwise measure of laterality (Swanson et al., 2011) and also a more global network-level measure. Previous functional imaging studies on the effects of gender and age on lateralization of brain activation have mostly been related to active task processing though there is some work on resting state activity, they analysed the whole brain rather than intrinsic networks (Zuo et al., 2012; Zuo et al., 2010), and have also been confined to analysis of single brain areas, so called “blobs” e.g. (K. Hugdahl, Thomsen, & Ersland, 2006).
Methods and Materials
Data, preprocessing, and group ICA were identical to (Allen et al., 2011), to allow comparisons of lateralization measures with previously extracted and discussed intrinsic networks. We re-summarize the methods in sections 2.1-2.4 for clarity and a flowchart is presented in Figure 1.
Figure 1.

Flowchart of the data processing, see section 2 for details.
2.1 Participants
Existing data from a total of 603 subjects combined from 34 studies and the work of 18 principal investigators at the Mind Research Network (MRN) on the same scanner with identical parameters were used for this study. In accordance with institutional guidelines at the University of New Mexico, informed consent was obtained from all subjects. The data were all obtained using the same scanner, and were made anonymous before group analysis began. At the time of the scan, none of the subjects were taking psychoactive medications, nor did any have a history of psychiatric or neurological disorders. Subjects were excluded from the study if they were consuming high levels of alcohol (2.5 or more drinks a day) or nicotine (average of 11 or more cigarettes a day). Subjects whose functional scans showed extreme motion (maximum translation > 6mm, approximately 2 voxels) were also excluded from the study. Table 1 shows the demographic information of the subjects, with 305 females and 298 males in the sample, gender is nearly balanced, and the age distributions for genders are also very similar. Handedness is not considered in this study, as the sample is mostly right-handed (46 ambidextrous or left-handed individuals) and preliminary tests in (Allen et al., 2011) did not indicate any handedness effects.
Table 1.
Demographic information of the subjects. Gender and age distribution.
| N | % | ||||||
|---|---|---|---|---|---|---|---|
| Gender | 603 | 100 | |||||
| Male | 298 | 49.4 | |||||
| Female | 305 | 50.6 | |||||
| Mean | SD | Min | 25% | 50% | 75% | Max | |
|---|---|---|---|---|---|---|---|
| Age (y) | 23.4 | 9.2 | 12 | 17 | 21 | 27 | 71 |
| Male | 23.8 | 9.1 | 12 | 17 | 21 | 26 | 71 |
| Female | 23.1 | 9.3 | 12 | 16 | 21 | 27 | 55 |
2.2 Data Acquisition
Images were collected using the 3-Tesla Siemens Trio scanner. High resolution T1-weighted structural images were obtained using a 5-echo MPRAGE sequence with TE = [1.64, 3.5, 5.36, 7.22, 9.08] ms, TR = 2.53 s, TI = 1.2 s, flip angle = 7°, number of excitations = 1, slice thickness = 1 mm, field of view = 256 mm, resolution = 256 × 256. T2*-weighted functional images were obtained using a gradient-echo EPI sequence with TE = 29 ms, TR = 2 s, flip angle = 75 °, slice thickness = 3.5 mm, slice gap =1.05 mm, field of view = 240 mm, matrix size = 64×64, voxel size = 3.75×3.75×4.55 mm. Resting state scans were a minimum of 5 minutes, 4 seconds (152 volumes). In order to match data quantity throughout participants, additional volumes, if collected, were not used. During the scan, subjects were told to stare passively at a fixation cross. They were also instructed to keep their eyes open, as it has been suggested this helps network delineation, when compared to eyes-closed conditions (Van Dijk et al., 2010).
2.3 Data Preprocessing
Functional and structural MRI data were preprocessed as in (Allen et al., 2011), using an automated preprocessing pipeline based on SPM5 (http://www.fil.ion.ucl.ac.uk/spm/software/spm5/) and a neuroinformatics system (Scott et al., 2011) developed at the MRN. Scanned data were automatically copied and archived to an analysis directory, where they were then preprocessed. In the functional data pipeline, the first four volumes were excluded in order to remove T1 equilibrium effects. Images are also realigned using INRIalign (Freire, Roche, & Mangin, 2002) and slice-timing correction is performed with the middle slice used as the reference frame. Data were then spatially normalized into the standard Montreal Neurological Institute (MNI) space, resliced to 3×3×3 mm voxels, and were then smoothed using a 10 mm full-width and half-maximum (FWHM) Gaussian kernel. Following automated preprocessing, the data were intensity normalized by dividing the time series of each voxel by its average intensity, converting data to percent signal change units (Allen et al., 2011).
For the structural data, spatial normalization, bias correction, tissue classification, and image registration were automatically performed using voxel-based morphometry (VBM) in SPM5, in which the above steps were incorporated into a unified model (Ashburner & Friston, 2005). Unmodulated grey matter images estimating local grey matter concentration (GMC) are then matched with the functional image dimensions by being smoothed using a Gaussian kernel with a 10 mm FWHM and resliced to 3×3×3 mm.
2.4 Group Independent Component Analysis
Using gICA, data were decomposed into functional networks. When applied to fMRI data, gICA identifies temporally-coherent networks by estimating maximally independent spatial sources, or spatial maps (SMs), from their linearly-mixed fMRI signals, or time courses (TCs). For a detailed discussion of the gICA analysis performed on this data, refer to (Allen et al., 2011).
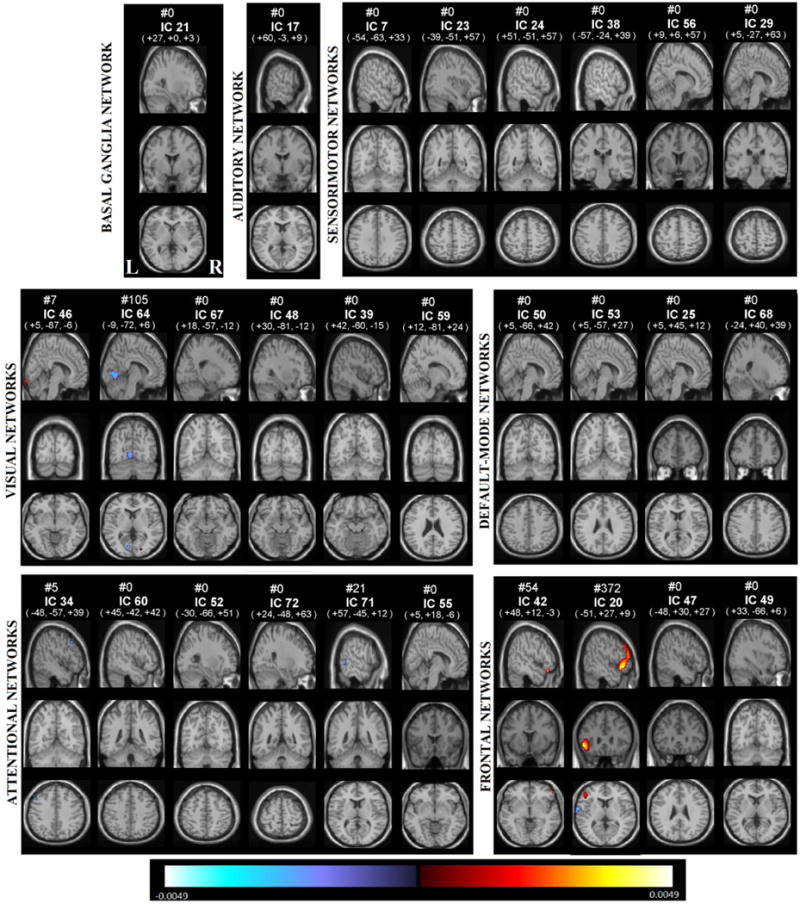
Out of the 75 components, a subset of 28 components, considered to be resting state networks (RSNs) are selected by inspecting the group-level SMs and average power spectra. We refer to (Allen et al., 2011) for the detailed discussion of the RSN selection. The usage of the term ‘network’ can be murky and (Erhardt, Allen, Damaraju, & Calhoun, 2011) suggest that it is incumbent upon authors to provide a meaningful interpretation of networks utilized in their study. In our study, we refer to regions that have temporally-coherent time series as ‘networks’, and thus use it interchangeably with the word component. We also calculated one sample t-tests of the SMs, and thresholded with the three standard deviations of the t-statistics of each of the component spatial maps, and created masks that corresponded to these thresholded regions. The most functionally active part of the components is shown in Figure 2 and corresponding regions in Table 2.
Figure 2.
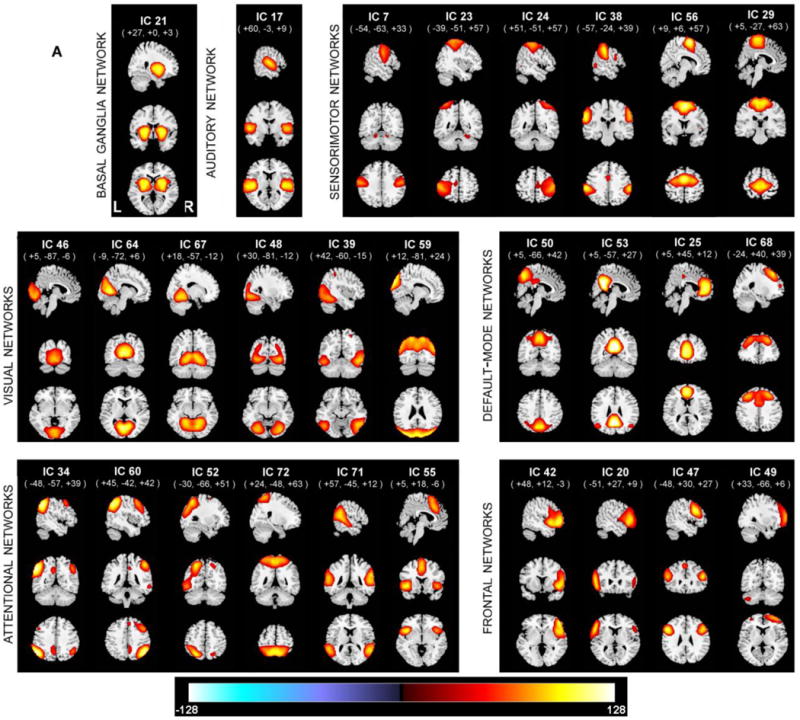
Spatial maps of the 28 components that are identified as RSNs, plotted as one sample t-statistics, thresholded with tc>3σc, and are displayed at the three most informative slices. RSNs are divided into groups based on their anatomical and functional properties and include basal ganglia (BG), auditory (AUD), sensorimotor (MOT), visual (VIS), default-mode (DMN), attentional (ATTN), and frontal (FRONT) networks. We refer to Allen et all for the details of grouping.
Table 2.
The talairach table associated with the each selected RSN shown on Fig 2, BA = Brodmann area; VI = number of voxels in each cluster; tmax = maximum t-statistic in each cluster; Coordinate = coordinate (in mm) of tmax in MNI space, following LPI convention (Allen et al., 2011).
| BASAL GANGLIA NETWORKS | BA | VI | tmax | Coords. |
|---|---|---|---|---|
| IC 21(0.98) | ||||
| R Putamen | 1454 | 108.7 | 25 -1 0 | |
| L Putamen | 1407 | 108.7 | -25 -3 0 | |
| AUDITORY NETWORKS | BA | VI | tmax | Coords. |
|
| ||||
| IC 17 (0.98) | ||||
| L Superior Temporal Gyrus | 22 | 2374 | 107 | -51 -18 7 |
| R Superior Temporal Gyrus | 22 | 2257 | 108.3 | 52 -15 5 |
| R Middle Cingulate Cortex | 24 | 165 | 42.8 | 2 -4 49 |
| SENSORIMOTOR NETWORKS | BA | VI | tmax | Coords |
|
| ||||
| IC 07 (0.98) | ||||
| L Precentral Gyrus | 6 | 1814 | 81 | -52 -9 31 |
| R Precentral Gyrus | 6 | 1694 | 78.3 | 52 -7 29 |
| L Cerebellum (Declive) | 116 | 45.5 | -16 -63 -22 | |
| R Cerebellum (Declive) | 84 | 40.9 | 17 -63 -21 | |
| IC 23 (0.98) | ||||
| L Precentral Gyrus | 4 | 3623 | 86.8 | -35 -27 54 |
| R Cerebellum | 342 | 40.3 | 24 -52 -23 | |
| R Postcentral Gyrus | 252 | 35.6 | 44 -28 56 | |
| R Inferior Frontal Gyrus | 45 | 79 | 23.7 | 54 29 0 |
| R Precuneus | 76 | 26.7 | 8 -62 32 | |
| IC 24 (0.98) | ||||
| R Precentral Gyrus | 4 | 3882 | 83.3 | 37 -25 53 |
| R Middle Temporal Gyrus | 165 | 36.1 | 50 -64 -2 | |
| L Cerebellum | 99 | 26.1 | -20 -53 -24 | |
| L Middle Temporal Gyrus | 63 | 23.5 | -61 -28 -8 | |
| L Middle Temporal Gyrus | 44 | 24.5 | -51 -70 4 | |
| IC 29 (0.98) | ||||
| Bi Paracentral lobule | 6 | 3199 | 100.9 | 1 -28 61 |
| L Insula | 13 | 44 | 40.1 | -35 -24 15 |
| IC 38 (0.98) | ||||
| L Supra marginal Gyrus | 2 | 1377 | 110.5 | -55 -34 37 |
| R Supramarginal Gyrus | 2 | 963 | 96.2 | 56 -32 40 |
| L inferior Frontal Gyrus | 44 | 207 | 58.6 | -48 5 18 |
| Bi Middle Cingulate Cortex | 24 | 189 | 51.5 | 1 7 38 |
| L Middle Temporal Gyrus | 37 | 128 | 54.4 | -57 -60 -2 |
| IC 56 (0.97) | ||||
| Bi Supplementary Motor Area | 6 | 3770 | 122.7 | 1 -3 61 |
| R Superior Temporal Gyrus | 22 | 193 | 48.2 | 50 8 4 |
| L Inferior Frontal Gyrus | 44 | 149 | 42.7 | -53 5 14 |
| R Inferior Frontal Gyrus | 40 | 61 | 41.1 | 58 -29 24 |
| L Inferior Frontal Gyrus | 40 | 26 | 35.9 | -58 -32 23 |
| VISUAL NETWORKS | BA | VI | tmax | Coords. |
|
| ||||
| IC 46 (0.96) | ||||
| Bi Lingual Gyrus | 17,18 | 3654 | 87.3 | 1 -87 -2 |
| Bi Middle Cingulate Cortex | 31 | 230 | 34.1 | 1 -45 32 |
| IC 64 (0.90) | ||||
| Bi Calcarine Gyrus | 17,18 | 3694 | 117.9 | 1 -71 13 |
| IC 67 (0.89) | ||||
| R Lingual Gyrus | 18 | 1740 | 97.7 | 17 -55 -9 |
| L Lingual Gyrus | 18 | 1820 | 94.8 | -15 -56 -8 |
| IC 48 (0.96) | ||||
| R Lingual Gyrus | 18,19 | 1367 | 86.5 | 29 -76 -8 |
| L Lingual Gyrus | 18,19 | 1324 | 83.6 | -29 -76 -7 |
| L Inferior Parietal Lobule | 40 | 43 | 41 | -49 -55 42 |
| IC 39 (0.97) | ||||
| R Inferior Temporal Gyrus | 37 | 1800 | 91.9 | 48 -63 -8 |
| L Inferior Temporal Gyrus | 37 | 667 | 80.7 | -47 -63 -14 |
| R Inferior Parietal Lobule | 40 | 33 | 46.2 | 42 -39 50 |
| IC 59 (0.92) | ||||
| Bi Cuneus | 19 | 3079 | 113.7 | 2 -84 28 |
| DEFAULT- MODE NETWORKS | BA | VI | tmax | Coords. |
|
| ||||
| IC 50 (0.96) | ||||
| Bi Precuneus | 7 | 2902 | 102.5 | 1 -64 43 |
| IC 53 (0.95) | ||||
| Bi Posterior Cingulate Cortex | 23 | 2387 | 139.6 | 0 -52 22 |
| L Angular Gyrus | 39 | 332 | 71.5 | -43 -69 33 |
| R Angular Gyrus | 39 | 194 | 59.8 | 47 -66 32 |
| Bi Medial Frontal Gyrus | 10 | 61 | 50.7 | -1 45 -9 |
| IC 25 (0.98) | ||||
| Bi Anterior Cingulate Cortex | 32 | 3126 | 114.5 | 0 41 4 |
| Bi Middle Cingulate Cortex | 31 | 358 | 53.6 | 1 -30 41 |
| R Inferior Frontal Gyrus | 93 | 48.2 | 32 22 -15 | |
| R Middle Frontal Gyrus | 46 | 63 | 37.8 | 40 43 8 |
| IC 68 (0.85) | ||||
| L Middle Frontal Gyrus | 8 | 1490 | 95.2 | -26 26 42 |
| R Middle Frontal Gyrus | 8 | 1210 | 87.9 | 26 33 41 |
| Bi Middle Cingulate Cortex | 32 | 450 | 67.6 | 0 21 40 |
| ATTENTIONAL NETWORKS | BA | VI | tmax | Coords. |
|
| ||||
| IC 34 (0.98) | ||||
| L Inferior Parietal Lobule | 40 | 1383 | 124.6 | -47 -57 39 |
| L Middle Frontal Gyrus | 8 | 1000 | 76.3 | -27 24 49 |
| R Inferior Parietal Lobule | 40 | 482 | 75.3 | 49 -54 39 |
| L Precuneus | 31 | 373 | 63.4 | -6 -52 37 |
| L Middle Temporal Gyrus | 21 | 233 | 75.3 | -62 -37 -12 |
| R Superior Temporal Gyrus | 22 | 124 | 44.1 | 56 0 2 |
| IC 60 (0.93) | ||||
| R Inferior Parietal Lobule | 40 | 2480 | 120.8 | 42 -56 42 |
| R Middle Frontal Gyrus | 8 | 2137 | 87.3 | 34 24 44 |
| L Superior Temporal Gyrus | 22 | 318 | 46.9 | -61 -2 0 |
| R Middle Temporal Gyrus | 21 | 249 | 58.7 | 64 -39 -11 |
| L Inferior Parietal Lobule | 40 | 163 | 45.7 | -45 -53 45 |
| IC 52 (0.96) | ||||
| L Angular Gyrus | 39 | 2841 | 100.6 | -33 -64 31 |
| L Inferior Frontal Gyrus | 45 | 295 | 54.2 | -43 24 21 |
| R Superior Parietal Lobule | 7 | 283 | 57.8 | 27 -65 44 |
| L Middle Frontal Gyrus | 6 | 119 | 52.3 | -25 1 60 |
| L Superior Temporal Gyrus | 22 | 24 | 40.4 | -50 -5 -4 |
| IC 72 (0.93) | ||||
| Bi Precuneus | 7 | 3283 | 105.2 | 0 -53 61 |
| L Superior Frontal Gyrus | 9 | 111 | 35.8 | -32 38 39 |
| R Middle Frontal Gyrus | 6 | 85 | 32.4 | 26 0 60 |
| L Middle Frontal Gyrus | 6 | 80 | 32.4 | -23 0 63 |
| R Superior Frontal Gyrus | 9 | 53 | 30.3 | 33 39 35 |
| IC 71 (0.88) | ||||
| R Superior Temporal Gyrus | 22 | 1775 | 95 | 57 -44 11 |
| L Superior Temporal Gyrus | 22 | 1337 | 89 | -56 -48 18 |
| Bi Precuneus | 7 | 123 | 51 | 1 -51 51 |
| R Precentral Gyrus | 6 | 44 | 50 | 51 2 50 |
| IC 55 (0.95) | ||||
| Bi Cingulate Gyrus | 32 | 1210 | 92.8 | 0 22 45 |
| L Insula | 47 | 670 | 103.1 | -46 15 -5 |
| R Insula | 47 | 331 | 80.8 | 45 18 -6 |
| L Middle Frontal Gyrus | 10 | 217 | 65.4 | -32 53 21 |
| FRONTAL NETWORKS | BA | VI | tmax | Coords. |
|
| ||||
| IC 42 (0.98) | ||||
| R Inferior Frontal Gyrus | 45 | 3371 | 105.7 | 50 23 2 |
| L Insula | 44 | 132 | 40 | -41 10 -2 |
| L Inferior Frontal Gyrus | 45 | 70 | 35.3 | -42 39 5 |
| R Supramarginal Gyrus | 2 | 65 | 35.5 | 58 -36 36 |
| R Middle Temporal Gyrus | 56 | 33 | 63 -45 0 | |
| L Inferior Parietal Lobule | 40 | 37 | 31.9 | -58 -40 49 |
| R Caudate Nucleus | 31 | 33.5 | 12 8 5 | |
| IC 20 (0.98) | ||||
| L Inferior Frontal Gyrus | 44,45 | 1781 | 103.2 | -55 22 7 |
| R Inferior Frontal Gyrus | 45 | 252 | 50.7 | 56 26 4 |
| IC 47 (0.95) | ||||
| L Middle Frontal Gyrus | 9 | 1020 | 110.8 | -48 17 29 |
| R Middle Frontal Gyrus | 9,46 | 885 | 97.1 | 49 22 25 |
| Bi Superior Medial Gyrus | 8 | 259 | 64.1 | -1 32 46 |
| R Superior Parietal Lobule | 7 | 38 | 49.3 | 33 -60 49 |
| IC 49 (0.97) | ||||
| R Middle Frontal Gyrus | 10 | 1661 | 84.3 | 31 55 7 |
| L Pyramis | 144 | 42.2 | -39 -66 -44 | |
| L Middle Frontal Gyrus | 10 | 64 | 33.4 | -31 52 8 |
2.5 Lateralization maps
Spatial normalization to symmetric templates
Though two hemispheres of the brains look like mirror images of each other, several known (Giedd et al., 1999; Penhune, Zatorre, MacDonald, & Evans, 1996) asymmetries must be accounted for before performing anatomical or functional comparisons (Stevens, Calhoun, & Kiehl, 2005). (Swanson et al., 2011) warped the data into a symmetric template in the spatial normalization process to overcome hemispheric asymmetries. We approached the problem with a different methodology. Since all subjects are already spatially normalized to the MNI template, we perform an additional normalization step, warping from the MNI template to a symmetrized version of the MNI template. This approach facilitates comparisons with (Allen et al., 2011) since, as a warping of one template to another, the additional symmetry normalization step is identical for all subjects and can be applied to component spatial maps following the gICA. The symmetric MNI template is an average of the template and its mirror image. The standard MNI template was then spatially normalized to the symmetric MNI template and this warping was applied to all component images for all subjects.
Calculation of voxelwise homotopic maps
For each subject, and for each component, we took the differences between component values on the right side of the cerebral cortex and its homotopic (geometrically corresponding) voxel on the left side and tested the difference with a one-sample t-test. For convenience, we plot voxels showing a positive difference (R>L) on the right side of the brain and voxels showing a negative difference (L>R) on the left side of the brain, that is:
Where R represents the right hemisphere and L represents the left hemisphere for each homotopic voxel νh. From this point forward, we will refer to this quantity, B, as the laterality component.
One Sample t-test
For each of the laterality components, and for each of the voxels, we computed a one sample t-test over 603 subjects. We then apply a mask that retains voxels whose t-values exceed one standard deviation of the t-statistics. In order to count only the most functionally active part of the component, these thresholded t-models are masked with the activation masks that were calculated previously, results are displayed in Figure 3.
Figure 3.
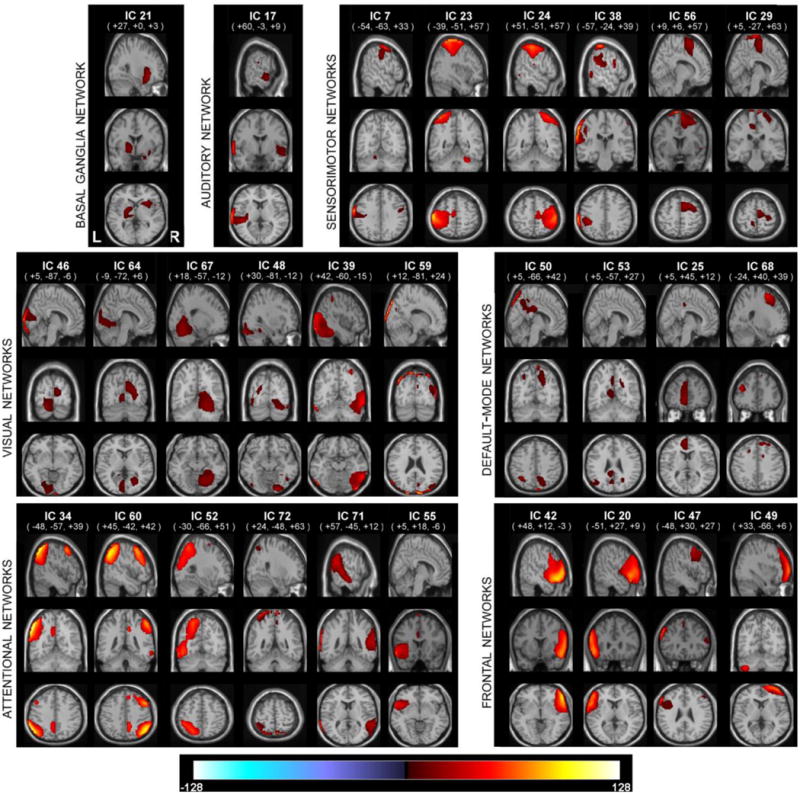
One sample t-statistics of the laterality component masked with the RSN activation mask, and thresholded with tb> σb. RSNs are displayed at the same coordinates with the SMs and grouped with a similar matter with Fig 2. RSNs are divided into groups based on their anatomical and functional properties and include basal ganglia (BG), auditory (AUD), sensorimotor (MOT), visual (VIS), default-mode (DMN), attentional (ATTN), and frontal (FRONT) networks. We refer to Allen et all for the details of grouping.
2.6 Global Effects: Laterality cofactor
In addition to the voxelwise laterality, we also summarize the amount of laterality for a given functional component by computing a global laterality metric (called a laterality cofactor). This metric was applied to both our average models, as well as each of our subjects individually. The laterality cofactor was calculated by taking the differences between the sum of all intensities on the right and left hemispheres with respect to the sum of all intensities across the brain.
2.7 Local Effects: Voxelwise Modeling of Age and Gender Effects
In addition to evaluating the laterality of the brain networks based on average intensity across subjects, we also tested the relationship of lateralization to age and gender on each voxel by a linear regression of laterality on gender and age: Bν = β0 + βgenderXgender + βageXage + ε. Where Xage is age of the subject, Xgender is a number indicating the gender of subject with 1 for males and -1 for females. All β's are the parameter of the regression model with ε being the error parameter for the model. This analysis gives us the voxels that are significantly (p<0.05, following false discovery rate (FDR) correction for multiple comparisons) affected by age and gender (Genovese, Lazar, & Nichols, 2002). Surviving voxels in the most informative slices are shown in the result section. A similar analysis was performed to determine age and gender effects on the global laterality measure described above, and in the Appendix we present results of these analyses performed separately on subsets of the overall age distribution.
Results
The global laterality results were useful to summarize the overall laterality of the networks, but were much less sensitive to age and gender. In contrast, the voxelwise results were more sensitive and showed significant laterality effects with both age and gender. In the following we briefly summarize the global results and provide more details for the voxelwise results for age and gender.
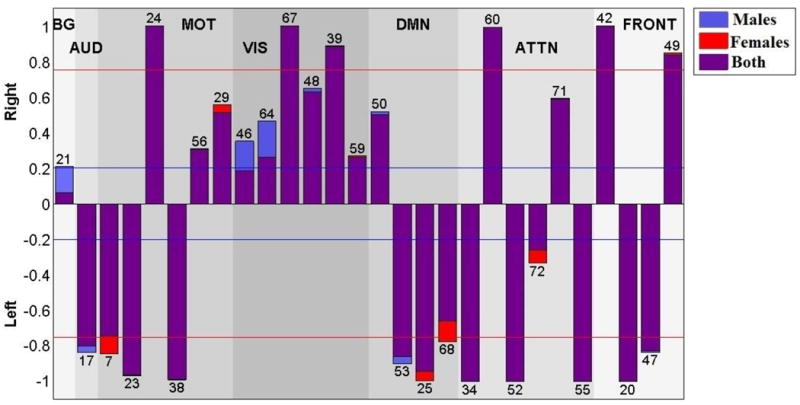
Global laterality effects (laterality cofactors)
The laterality cofactors for each component are displayed in Figure 4 and indicating regions summarized on Table 3. We designate a component as ‘lateralized’ if the absolute value of the laterality cofactor is greater than 0.2 and ‘highly lateralized’ if it is above 0.75. Most of the networks are lateralized. The laterality cofactors indicate that the basal-ganglia network (IC 21) is symmetric; the auditory network (IC 17) is highly left lateralized.
Figure 4.
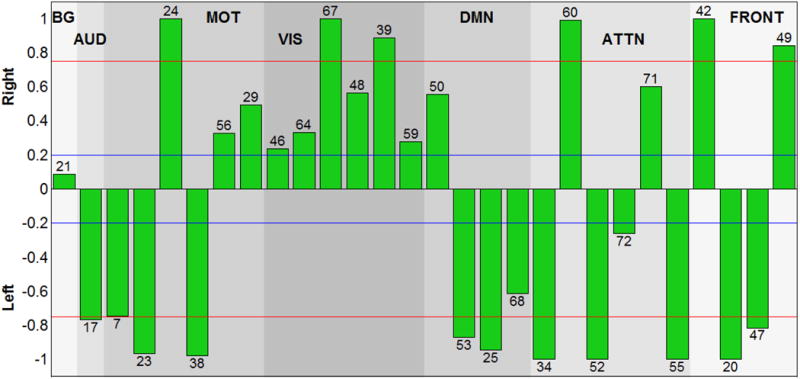
Laterality cofactors for each component over 600 subjects that are ranging from age 12 to 71. The cofactors that have absolute value above the 0.75 (red line) are called highly lateralized and the cofactors that have absolute value above 0.2 are called lateralized.
Table 3.
The Talairach table associated with the each t-model of RSN (shown on Fig 3), BA = Brodmann area; VI = number of voxels in each cluster; tmax = maximum t-statistic in each cluster; Coordinate =coordinate (in mm) of tmax in MNI space, following LPI convention.
| BASAL GANGLIA NETWORKS | BA | VI | tmax | Coords. |
|---|---|---|---|---|
| IC 21 | ||||
| L Pallidum | 534 | 18 | -22 -3 0 | |
| R Putamen | 47 | 446 | 24 | 24 18 -9 |
| AUDITORY NETWORKS | BA | VI | tmax | Coords. |
|
| ||||
| IC 17 | ||||
| L Superior Temporal Gyrus | 42 | 902 | 71 | -72 -21 9 |
| SENSORIMOTOR NETWORKS | BA | VI | tmax | Coords. |
|
| ||||
| IC 07 | ||||
| L Postcentral Gyrus | 6 | 777 | 75 | -66 -9 36 |
| IC 23 | ||||
| L Postcentral Gyrus | 1 | 2460 | 85 | -48 -33 66 |
| IC 24 | ||||
| R Postcentral Gyrus | 2 | 2669 | 68 | 54 -24 54 |
| IC 38 | ||||
| L SupraMarginal Gyrus | 40 | 1128 | 97 | -69 -27 33 |
| IC 56 | ||||
| R Supplementary Motor Area | 6 | 725 | 75 | 3 3 78 |
| L Supplementary Motor Area | 6 | 118 | 69 | -9 6 78 |
| IC 29 | ||||
| R Paracentral Lobule | 575 | 64 | 6 -27 81 | |
| VISUAL NETWORKS | BA | VI | tmax | Coords. |
|
| ||||
| IC 46 | ||||
| L Lingual Gyrus | 17 | 554 | 25 | -18 -93 -18 |
| L Calcarine Gyrus | 18 | 425 | 66 | 3 -105 3 |
| IC 64 | ||||
| R Calcarine Gyrus | 31 | 626 | 17 | 12 -69 18 |
| IC 67 | ||||
| R Cerebellum (VI) | 19 | 1598 | 20 | 24, -66, -24 |
| IC 48 | ||||
| R Lingual Gyrus | 18 | 524 | 39 | 39 -90 -21 |
| IC 39 | ||||
| R Inferior Temporal Gyrus | 19 | 2021 | 76 | 48 -84 -9 |
| L Inferior Temporal Gyrus | 37 | 36 | 63 | -57 -66 -21 |
| IC 59 | ||||
| R Superior Occipital Gyrus | 19 | 374 | 112 | 18 -96 33 |
| DEFAULT-MODE NETWORKS | BA | VI | tmax | Coords. |
|
| ||||
| IC 50 | ||||
| R Precuneus | 7 | 645 | 74 | 3 -84 48 |
| IC 53 | ||||
| L Middle Occipital Gyrus | 39 | 231 | 56 | -6 -39 15 |
| IC 25 | ||||
| L Mid Orbital Gyrus | 10 | 933 | 47 | -3 63 -9 |
| IC 68 | ||||
| L Middle Frontal Gyrus | 6 | 428 | 35 | -21 9 60 |
| ATTENTIONAL NETWORKS | BA | VI | tmax | Coords. |
|
| ||||
| IC 34 | ||||
| L Angular Gyrus | 40 | 1414 | 118 | -60,-63,33 |
| Left Middle Frontal Gyrus | 8 | 543 | 69 | -45 15 54 |
| IC 60 | ||||
| R Inferior Parietal Lobule | 40 | 1497 | 90 | 51 -57 45 |
| R Middle Frontal Gyrus | 8 | 1197 | 77 | 36 15 57 |
| IC 52 | ||||
| L Inferior Temporal Gyrus | 37 | 2387 | 62 | -60 66 -12 |
| IC 72 | ||||
| R Precuneus | 7 | 265 | 92 | 3 -57 72 |
| L Superior Parietal Lobule | 7 | 297 | 79 | -18 -63 72 |
| IC 71 | ||||
| R Angular Gyrus | 40 | 1299 | 36 | 60 -54 24 |
| IC 55 | ||||
| L Temporal Pole | 47 | 699 | 63 | -57 21 -12 |
| L Middle Frontal Gyrus | 10 | 333 | 57 | -39 63 18 |
| FRONTAL-NETWORKS | BA | VI | tmax | Coords. |
|
| ||||
| IC 42 | ||||
| R Inferior Frontal Gyrus | 47 | 2351 | 88 | 51 33 -9 |
| IC 20 | ||||
| L Inferior Frontal Gyrus | 47 | 2012 | 75 | -57 27 -9 |
| IC 47 | ||||
| L Inferior Frontal Gyrus | 9 | 745 | 74 | -60 21 33 |
| IC 49 | ||||
| R Middle Frontal Gyrus | 10 | 1796 | 66 | 39 57 3 |
The sensorimotor networks has both left lateralized and right lateralized components. The lateralized regions are mostly occurring in L/R pairs, (postcentral gyrus, and supplementary motor) which is consistent with the right hemisphere control left part of the body, left hemisphere controls right part of the body phenomena (Janssen, Meulenbroek, & Steenbergen, 2011). Even though we have equally distributed (3 left and 3 right), the magnitude of lateralization is greater for the left lateralized component, which is also consistent with the left hemisphere dominant phenomena in the literature (Janssen et al., 2011).
The visual network is the most dominantly right lateralized functional network. All six components of the visual network are right lateralized, on regions lingual gyrus, calcarine gyrus (Right BA 18), cerebellum, inferior temporal gyrus and superior occipital gyrus. (Liu et al., 2009) also indicated the visual cortex as one of the most strongly right lateralized regions.
The default mode network components are mostly left lateralized on regions middle occipital gyrus, mid orbital gyrus and middle temporal gyrus (ICs 53, 25, 68) with one right lateralized exception IC 50 on region of precuneus. Our results are parallel with the (Nielsen et al., 2013), which reports the default networks as left lateralized, and (Swanson et al., 2011) that also indicates left dominancy in the default mode networks while indicating lateral differences between healthy control and schizophrenia patients.
The attentional network components are highly lateralized with the exception on ICs 72 and 71. Angular gyrus and middle frontal gyrus (IC 34); inferior temporal gyrus (IC 52); temporal pole and middle frontal gyrus (IC 55); are highly left lateralized regions while IC 60 (inferior parietal lobule, middle frontal gyrus) is highly right lateralized. The right-sided parietal lobule lateralizations fit nicely with previous work on asymmetry of spatial attention, including both healthy individuals e.g. (K. Hugdahl et al., 2006) and brain-damaged patients showing signs of visuo-spatital attentional neglect (Berger & Posner, 2000).
According to laterality cofactors, the frontal networks are the most sharply lateralized network, with two left (inferior frontal gyrus) and two right (inferior frontal and middle frontal gyrus) lateralized components.
Assessment of component lateralization null distribution
A possible question that might arise is how lateralized would the gICA results be by chance. To investigate this, we simulated group ICA on some synthetic data to observe the laterality on random data. We generated, for 20 trials, 2D random components according to logistic distribution with 120 random time series for 40 subjects and combined them, later we applied group ICA on these simulated data and calculate the laterality cofactors on these components, the results are presented in Table 4 and Figure 5. Results show the probability of finding a lateralized component, above 0.2, is almost zero and provide additional support for the results reported in this paper.
Table 4. Statistics of the simulated laterality cofactors.
| Absolute Maximum | Absolute Minimum | Absolute Mean | Absolute Variance |
|---|---|---|---|
| 0.234 | 0 | 0.052 | 0.0015 |
Figure 5. Probability distribution of the absolute laterality cofactors on synthetic dataset.

Voxel-wise effects of age
Figure 6 shows the significant (p<0.05, following FDR correction for multiple comparisons) age effects on voxel-wise laterality, Table 5 shows the corresponding regions that are becoming less lateralized with aging. Sensorimotor networks contain the largest volume whose lateralization decreases (with respect to their mirror images) along with the visual, attentional and frontal networks that are also presenting many lateralized voxels. The left lateralized sensorimotor network components, 7, 23 and 38 have regions that are becoming more symmetric in postcentral gyrus, precentral gyrus and supramarginal gyrus. Right lateralized sensorimotor network, IC 24, is also becoming more symmetric in precentral gyrus.
Figure 6.
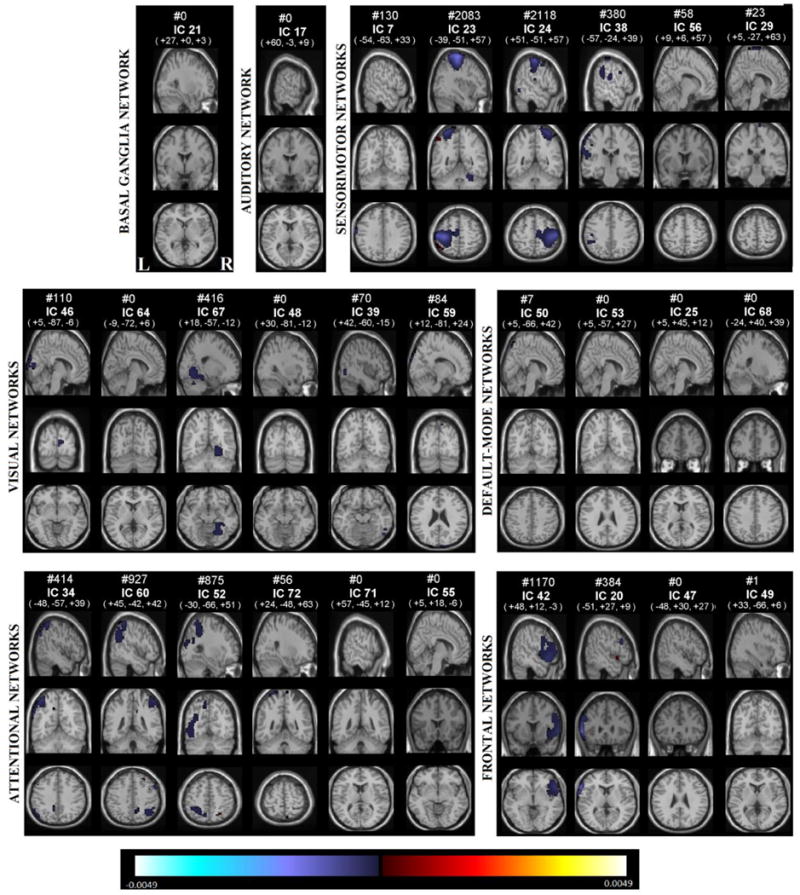
Age effects on each voxel and each component, voxels that survives FDR correction shown in color, are displayed at the same coordinates with the SMs and grouped with a similar matter with Fig 2. RSNs are divided into groups based on their anatomical and functional properties and include basal ganglia (BG), auditory (AUD), sensorimotor (MOT), visual (VIS), default-mode (DMN), attentional (ATTN), and frontal (FRONT) networks. We refer to Allen et all for the details of grouping.
Table 5.
The Talairach table associated with the FDR surviving regions on age effects, that are becoming less lateralized as age goes from 12 to 71, each (shown on Fig 6), BA = Brodmann area; VI = number of voxels in each cluster; Coords = coordinate (in mm) of tmax in MNI space, following LPI convention.
| SENSORIMOTOR NETWORKS | BA | VI | Coords | |
|---|---|---|---|---|
| IC 07 | ||||
| L Postcentral Gyrus | 6 | 130 | -66 -6 33 | |
| IC 23 | ||||
| L Precentral Gyrus | 6 | 1912 | -36 -24 69 | |
| IC 24 | ||||
| R Precentral Gyrus | 4 | 2088 | 36 -27 69 | |
| IC 38 | ||||
| L Postcentral Gyrus | 2 | 182 | -66 -21 24 | |
| L SupraMarginal Gyrus | 40 | 181 | -63 -48 24 | |
| VISUAL NETWORKS | BA | VI | Coords | |
|
| ||||
| IC 67 | ||||
| R Lingual Gyrus | 19 | 416 | 21 -63 -6 | |
| ATTENTIONAL NETWORKS | BA | VI | Coords | |
|
| ||||
| IC 34 | ||||
| L Inferior Parietal Lobule | 40 | 345 | -42 -57 60 | |
| IC 60 | ||||
| R Superior Parietal Lobule | 40 | 747 | 45 -48 60 | |
| IC 52 | ||||
| L Superior Parietal Lobule | 7 | 428 | -27 -60 66 | |
| L Middle Temporal Gyrus | 37 | 421 | -57 -66 -3 | |
| FRONTAL-NETWORKS | BA | VI | Coords | |
|
| ||||
| IC 42 | ||||
| R Inferior Frontal Gyrus | 47 | 1154 | 54 21 -6 | |
| IC 20 | ||||
| L Inferior Frontal Gyrus | 45 | 364 | -63 21 3 | |
The visual network component 67 (lingual gyrus), show decreased right lateralization with age. The attentional network components 34 and 52, show less left lateralization with age in inferior parietal lobule, superior parietal lobule and middle temporal gyrus. The right lateralized component 60 becomes more symmetric due to the changes in superior parietal lobule.
The right lateralized frontal network component 42, shows age-related changes in inferior frontal gyrus, becoming less right lateralized as age goes from 12 to 71. The left lateralized component, 20, has regions on the inferior frontal gyrus that are becoming less left lateralized.
Voxel-wise effects of gender
We display the significant (p<0.05, following FDR correction for multiple comparisons) gender effects on voxel-wise laterality in Figure 7. Corresponding regions that are more lateralized in females are shown at Table 6a, and regions that are more lateralized in males listed at Table 6b. In general, males showed more lateralization than did females. Right lateralized visual component 64 has left lingual gyrus being more active in females, indicating more right lateralization of this region in males. Frontal network component 20 shows more left lateralization in males in the inferior frontal gyrus.
Figure 7.
Gender effects on each voxel and each component, voxels that survives FDR correction shown in color, are displayed at the same coordinates with the SMs and grouped with a similar matter with Fig 2. RSNs are divided into groups based on their anatomical and functional properties and include basal ganglia (BG), auditory (AUD), sensorimotor (MOT), visual (VIS), default-mode (DMN), attentional (ATTN), and frontal (FRONT) networks. We refer to Allen et all for the details of grouping.
Table 6.
a-) The Talairach table associated with the FDR surviving regions on gender effects, that are more lateralized at females, each (shown on Fig 7), BA = Brodmann area; VI = number of voxels in each cluster; Coords = coordinate (in mm) of tmax in MNI space, following LPI convention, b-) The Talairach table associated with the FDR surviving regions on gender effects, that are more lateralized at males, each (shown on Fig 7), BA = Brodmann area; VI = number of voxels in each cluster; Coords = coordinate (in mm) of tmax in MNI space, following LPI convention.
| a-) | |||
|---|---|---|---|
| VISUAL NETWORKS | BA | VI. | Coord. |
| IC 64 | |||
| L Lingual Gyrus | 18 | 93 | -9 -78 -3 |
| b-) | |||
|---|---|---|---|
| FRONTAL NETWORKS | BA | VI. | Coord. |
| IC 20 | |||
| L inferior Frontal Gyrus | 47 | 285 | -51 27 -6 |
Gender laterality cofactor effects
Laterality cofactors that are calculated for the male and female subgroups are shown at Figure 8. The two groups show differences mostly on the visual networks, which are more right lateralized for males. Several other networks also show slight differences between genders. Though the basal-ganglia (IC 21) is predominantly symmetric, it is right lateralized in males compared to the females. The visual network components 46 (lingual and calcarine gyrus) and 64 (calcarine gyrus) are more right lateralized in males. The default mode network component 68 is more lateralized in females.
Figure 8.
Laterality Cofactors for gender subgroups. Visible blue bars shows the components that are more lateralized for males, visible red bars shows the components that are more lateralized for females.
Figure 9 shows the beta values of regression analysis for gender effects on laterality cofactors. The effects are mild, with some uncorrected p-values less than 0.05, but none remain significant following FDR correction. The visual network component 46 (left lingual gyrus, left cingulate gyrus), (p<0.05, uncorrected) is more right lateralized in males, and the attentional network component 55 (temporal pole and middle temporal gyrus), (p<0.05, uncorrected) is more left lateralized in females.
Figure 9.

Beta values for Gender effects on laterality cofactors. Blue bars show the components that are more lateralized for females, Red bars shows the components that are more lateralized for males. No components survive from 0.05 level FDR correction. Component 46 is more lateralized for males (P<0.05) and component 55 is more lateralized for females (P<0.05).
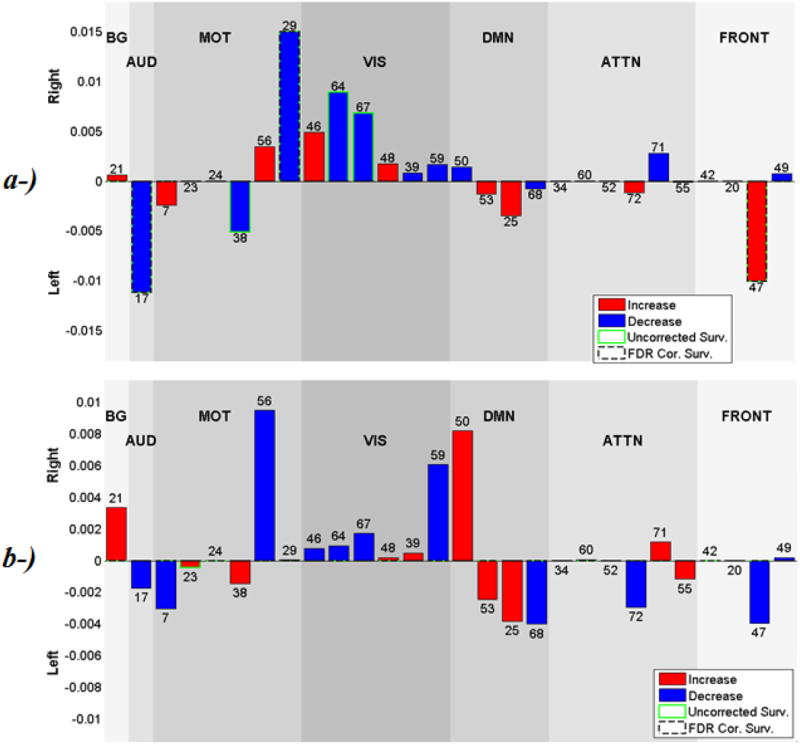
Age laterality cofactor effects
The beta values of regression analysis of age effects on laterality cofactors are displayed in Figure 10. Significant age effects are reported for sensorimotor and visual networks, both showing a decrease in lateralization as subjects are getting older. The sensorimotor network component 38 (supramarginal gyrus) and visual network component 67 (cerebellum), survived 0.05 level FDR correction, components 38 and 67 becomes less left lateralized and less right lateralized respectively as age increases from 12 to 71. No other networks exhibit age effects with p-values less than 0.05.
Figure 10.

Beta values for Age effects on laterality cofactors. Blue bars show the components that are more lateralized as age goes from 12 to 71. Red bars show the components that are less lateralized as age goes from 12 to 71. Components 38 and 67 (dashed circulated) survive 0.05 level FDR correction, and are getting less lateralized as age goes from 12 to 71. No other component has p-value smaller than 0.05, besides the ones that also survive FDR correction.
Reproducibility of the results
As a further analysis, we randomly subgrouped samples into groups of 10, 25, 50 and 100 for 50 trials and calculated the lateralization cofactors and present the results in Table 7. For each component, we calculated the variance among 50 trials and calculate the maximum value. The second column represents the error which is the absolute difference from of the full-sample laterality cofactors from the mean of the 50 trials with the corresponding number of samples used. The last column represents the mean of the absolute error among all 28 components.
Table 7.
Robustness test on the laterality cofactor.
| #samples | Maximum Variance | Maximum Error | Mean of Absolute Error |
|---|---|---|---|
| 10 | 0.1 | 0.25 | 0.06 |
| 25 | 0.067 | 0.076 | 0.025 |
| 50 | 0.046 | 0.075 | 0.016 |
| 100 | 0.017 | 0.045 | 0.011 |
The table indicates that component lateralization is quiet robust. Even with a sample size of just 10, we get very reliable and stable results.
We performed two analyses to determine the required number of samples to observe gender effects. For the first analysis, we calculated how much we can reduce the number of samples in t-statistic formula before it no longer passes the FDR threshold. Results are presented in Table 8:
Table 8. Required number of samples to observe gender effects for each component.
| Component | #20 | #64 |
|---|---|---|
| Required Number of Samples | 172 | 294 |
In addition, we replicated the analysis on subgroups; we find that gender effects are consistent in gender balanced samples of 250 subjects.
In a similar manner, we investigated the required number of samples for stable age effects. Analysis results are shown in Table 9. The required number of samples varies across components from as low as 34 for one component to as high as 235 for another. This reflects the complexity and diversity of the age effects.
Table 9. Required number of samples to observe age effects for each component.
| Component | #7 | #20 | #23 | #24 | #34 | #38 | #42 | #52 | #60 | #67 |
|---|---|---|---|---|---|---|---|---|---|---|
| Required Number of Samples | 235 | 149 | 34 | 44 | 93 | 159 | 82 | 155 | 92 | 138 |
It is not straightforward to generate a well-matched age distribution in sub-samples due to the non-uniform age distribution of the dataset. This makes it difficult to determine a precise number of required number of samples by replicating the analysis on subgroups as the required sample will be sensitive to the age distribution of the randomly chosen subgroups. This is further compounded by the fact that some of the age effects exhibit non-linear properties. In order to obtain stable age effect results given these considerations, approximately 300 samples are required.
Discussion
We analyzed lateralization of resting state networks in a dataset of over 600 subjects, and studied how age and gender affects brain lateralization. Most of the intrinsic networks are lateralized, and sensorimotor (postcentral, precentral supramarginal gyrus), visual (lingual gyrus), attentional (inferior parietal lobule, superior parietal lobule, middle temporal gyrus) and frontal network (inferior frontal gyrus) have regions that are showing mostly decrease in lateralization with aging. Visual (lingual gyrus) and frontal network (inferior frontal gyrus) also have regions that are affected by gender.
Our results indicate that age is an important factor for lateralization and affecting most of the networks. We observe a decrease in lateralization in four sensorimotor network (3 left and 1 right lateralized), which suggest that left dominancy of sensorimotor networks is getting balanced with aging. Our results are consistent with (Zuo et al., 2010), that found increasing homotopic resting state connectivity on sensorimotor regions, specifically linear increase in supplementary motor area and postcentral gyrus. (Zuo et al., 2010) interpret this change as increasing hemispheric cooperation for complex bimanual functions. We also found that attentional and frontal networks become more symmetric with aging. Though our result is conflicting with (Zuo et al., 2010) which indicates a decrease in homotopic resting state connectivity in high-order cognitive regions such as anterior cingulate, inferior parietal cortex, precuneus, it is parallel with others (Reuter-Lorenz et al., 2000) who found for young adult, verbal working memory is left and spatial working memory is right lateralized in anterior working memory whereas older adults have a global pattern of anterior bilateralized working memory for both visual and verbal memory. (Reuter-Lorenz et al., 2000) suggested this bilateralization can be an attempt to overcome neural decline. (Cabeza, Anderson, Locantore, & McIntosh, 2002) also found bilateral prefrontal cortex activity in older adults comparing to young adult, and compare the hemispheric asymmetries in two groups; low-performing older adults versus high performing older adults; and found a hemispheric asymmetry reduction in high performing group, supporting the compensation theory that brain cognitive networks become more bilateral in order to compensate neural decline. If our results are supported by subsequent studies , the effects of age and gender on the components that intersect significantly with primary sensory and motor cortices, would tend to mitigate against recent findings of (Mueller et al., 2013) that primary sensory and motor cortices exhibit relatively less individual variation than the association cortex.
Some studies reports that gender is a factor in brain lateralization, while some studies report no gender effect on brain lateralization. Significant gender differences in intra and inter-hemisphere connectivity were recently reported by (Ingalhalikar et al., 2013) in a DTI study, (Zuo et al., 2010) presented significant differences in regions of dorsolateral prefrontal cortex (BA 9 and 47) and amygdala for homotopic functional connectivity, and some small differences are also reported (Liu et al., 2009). In our study, voxelwise results showed gender to be a factor in lateralization of two regions, lingual gyrus (visual network) and inferior frontal gyrus (frontal network), suggesting males being more lateralized in both regions; consistent with (Zuo et al., 2010) that reports females having higher homotopic functional connectivity with in posterior cingulate cortex, medial prefrontal cortex, and the superior and middle frontal cortex, comparing to males. They also found males having stronger homotopic connectivity in cerebellum, parahippocampal gyrus, and fusiform gyrus comparing to the females. (Good et al., 2001) reported several morphological asymmetries between genders, including right inferior frontal gyrus being increased in volume in females. Globally, the gender effect on lateralization cofactors are not significant which is consistent with (Nielsen et al., 2013) and meaningful given our relatively large sample size.
The age effects on the laterality cofactors are varying, some components are linear, some nonlinear, some are additive and some components are subtractive. For instance, lateralization of Component 47 (inferior frontal gyrus) increases significantly with age for subjects between 12 and 29 years old , decreases with age for subjects aged 30 to 71, (see Appendix). Evaluated over the whole population (ages 12 to 71) however, lateralization of the inferior frontal gyrus trends negatively with age , indicating a non-linear age effect which is consistent with the work by (Zuo et al., 2010) where linear, quadratic and cubical age related changes reported on the whole brain resting state functional connectivity. In general, there appear to be more nonlinear effects at the younger age range. In a recent large-scale study (N = 1782) (Hirnstein, Westerhausen, Korsnes, & Hugdahl, 2013) found no main-effect of sex on a dichotic listening task, which assesses auditory laterality, but that sex interacted with age. In brief, these authors found that the laterality index increased with increasing age, driven by the females. These behavioral findings however were not corroborated in an fMRI study on a selected sub-sample (N = 104) wherein males still showed greater behavioral asymmetry. Thus, the relationship between sex and age effects on brain asymmetry and lateralization is complex, and with intrinsic interactions between the two factors, future research should therefore ideally include both younger and older subjects when studying sex differences and brain function, which would also apply to analysis of cortical networks, and neuronal connectivity.
In this work, we studied the lateralization in resting state networks, rather than brain lateralization in general. Were we to ignore networks, some of the lateralized regions would appear highly symmetric. For example, ICs 23 and 24 (left and right postcentral gyrus), look like mirror images of one another. This indicates the power of our analysis comparing to the whole brain analysis. The model order is very crucial and unfortunately, though various estimation approaches exist, there is no analytic way to determine perfect model order. We also performed an eigenvalue analysis on the ICs to evaluate the ability of the components to be well captured when using variance as the criteria. To do so, we used PCA to decompose the group average component-by-voxels matrices. Results showed that to capture 90% of the variance 50 components are needed, and 60 components are needed to capture 95% of the variance. Based on this, we conclude that there is considerable value in these higher model order approach.
Limitations
We should consider some limitation interpreting the results. Firstly, we do not have information about the education or IQ level or other domains such as the working memory of subject during the scanning process. Also, subjects have not been tested to measure their behavior abilities; they may not be balanced with verbal ability, motor skills or visuospatial attention. Though our subjects are ranging from age 12 to 71, they do not cover the most rapidly changing ages of childhood, and the distribution of age is not uniform. Moreover, for comparison purposes we focused on the resting state networks extracted from a previous study that has ICA model order of 75, but it would also be interesting to evaluate the age and gender related changes for higher and lower model orders using different criteria to determine dimensionality. Even though we used a large sample size, subjects were scanned with a minimum of 5 minutes (152 volumes), this may limit the sensitivity detection of the effects. Besides, even though, we warped the data into a symmetric template to count for well-known structural asymmetries, the possibility that additional structural asymmetries might still be present should be considered while interpreting the results. Finally, there are many other ways to measure the amount of lateralization of a component; we choose one method, the laterality cofactor, due to its simplicity, in addition to the voxelwise homotopic effects.
Conclusion
In summary, we analyze lateralization of 28 resting state networks in a large fMRI dataset consisting of over 600 healthy subjects ranging in age from 12 to 71. We found many of the intrinsic brain networks are highly lateralized, with several regions (sensorimotor, visual, attentional and frontal) showing a strong relationship with age and two networks (visual and frontal) showed voxelwise differences between genders. On the global measure of laterality, age was found as strong factor and gender exhibiting a trend-level effect. Our results support the theory that multiple brain networks grow more bilateral in an attempt to compensate neural decline with aging. In future work, investigating compensation effects by studying changes lateralization in subjects with injured brains or lesions, and examining age effects in more details in subgroups such as childhood, teenage, young adults etc. with more balanced numbers of subjects across the full age range, are promising research directions. Significant gender effects were also found, but showed a more complex pattern of change in which greater lateralization was observed in some regions in females and other regions in males. In summary, our approach of focusing on network-specific lateralization thus appears to be a promising and sensitive tools for studying brain organization.
Highlights.
Dataset consisting of over 600 healthy subjects ranging in age from 12 to 71.
Most intrinsic networks are highly lateralized.
Several regions show a decrease in lateralization with aging.
Significant gender effects are found in two regions.
Acknowledgments
This work was supported in part by NIH grants including 2R01EB005846 and a Center of Biomedical Research Excellence (COBRE) grant P20GM103472.
Appendix
In order to check if the age effects are varying over age, we divide the data into two age subgroups; teenagers and young adult versus adults, and calculated laterality cofactors in each subgroup. We used the cut-off age as 29, just to match with some previous work (Nielsen et al., 2013). Later, we performed a robust regression analysis on these laterality cofactors for both groups.
Nonlinear effects
We also subgroup the subjects into two different age groups to look at the age effects to test for nonlinear aging effects. In general there were many more changes in lateralization at the younger (age range 12 to 29) versus the older age range (range 30 to 71). Figure 11 shows the laterality cofactors for the two subgroups. Almost all networks have differences in laterality cofactors of two subgroups. Among them, basal ganglia, sensorimotor and visual networks have the most remarkable differences. The basal ganglia network (IC 21) is more right lateralized for the elder age group, while it is symmetric for young age group. The sensorimotor network components 7 and 29 are more lateralized and component 56 is less lateralized in the elder age group. Components 23, 24 and 38 are almost identical for both groups. The visual network component 46 is more right lateralized and 48 are less right lateralized at elder age group. The other components 64, 67, 39 and 59 are similar. The auditory network (IC 17) is more left lateralized in the elder age group. The default mode networks are more right lateralized for the elder age group (IC 53, 25, 68), with the exception of IC 50 which is essentially symmetric in the elder age group while right lateralized in the young age group. The attentional network components 34, 60, 52 and 55 are not showing changes with age while 72 and 71 are. IC 72 is more lateralized in the elder age group while IC 71 is more lateralized at young age group. The frontal network components 55, 42, 20 are 49 same for both age groups, and with component 47 slightly more lateralized in the elder age group.
Figure 11.

Laterality cofactors for different subgroups. Blue bar shows components that are more lateralized for the age group 12 to 29 and red bars show the components that are more lateralized for age group 30 to 71.
Subgroup Age 12 to 29
Beta values of the regression analysis on the laterality cofactors for the subjects aging from 12 to 29 are presented in Figure 12a. In general, aging from 12 to 29 makes networks less lateralized, in other words more symmetric. Three components survive 0.05 level FDR correction, the auditory network component 17, sensorimotor network component 29 and frontal network component 47. Component 17, the auditory network including left superior temporal gyrus, is becoming less left lateralized as age increases from 12 to 29. While it is hard to make firm conclusions about the impact of learning language and subsequent pruning of the cortex on the observed lateralization, it is consistent with the idea that lateralization at the younger ages provides a benefit for learning language (DeKeyser, 2013).
Figure 12.
a-) Beta values for Age effects on laterality cofactors for the subgrouped data between 12 to 29. Blue bars show the components that are more lateralized as age goes from 12 to 29, Red bars show the components that are less lateralized as age goes from 12 to 29. Component 17, 29 and 47 (dashed circulated) survive 0.05 FDR correction, components 17 and 29 are getting less lateralized and component 47 is getting more lateralized as age goes from 12 to 29. Component 38, 64, 67 (green circulated) do not survive FDR correction, but they have p-values smaller than 0.05, and are getting less lateralized as age goes from 12 to 29.
b-) Beta values for Age effects on laterality cofactors for the subgrouped data between 30 to 71. Blue bars show the components that are more lateralized as age goes from 30 to 71, Red bars show the components that are less lateralized as age goes from 30 to 71. No component survives 0.05 FDR correction. Component 23 (outlined in green) does not survive FDR correction, but it has a p-value smaller than 0.05, and is getting more lateralized as age goes from 30 to 71.
Component 29, part of visual network including the paracentral lobule, is growing less right lateralized with age. Component 47, a part of the frontal network including left inferior frontal gyrus and left middle frontal gyrus, and it is growing more left lateralized as age goes from 12 to 29. (Xiao, 2012) reported that early developed native spoken language is processed by the left inferior frontal gyrus, while late developed written language is proceeded by the left middle frontal gyrus in a manner dependent on the age of language acquisition. Age 12 to 29 is during a phase of rapid acquisition of written language and vocabulary. As (Xiao, 2012) reported, the increase in the left middle frontal gyrus due to acquisition of new vocabulary is consistent with the increase in left lateralization.
Sensorimotor network component 38, regions of supramarginal and middle temporal gyrus, is decreasing in lateralization (p<0.05) as age goes from 12 to 29, visual network component 64 and 67, regions of calcarine and lingual gyrus respectively, and both are also growing less right lateralized (p<0.05) as age increases from 12 to 29.
Subgroup Age 30 to 71
In Figure 12b, we present the beta values of the regression analysis on the laterality cofactors data age interval 30 to 71. There is no significant age effect in this age interval surviving from 0.05 level FDR correction, however component 23 of sensorimotor network has p-value less than 0.05, with the region of precentral gyrus and it is growing more left lateralized as age goes from 30 to 71.
Nonlinear gender effect
On two age subgroups, we also look at the gender effects to test if the gender effects vary with aging. Figure 13 and 14 shows the beta values of regression analysis for gender effects on the laterality cofactor for the young and elder subgroup, respectively. For both groups, no component survives from FDR correction, but some components have p-values less than 0.05.
Figure 13.

Gender effects on the data age subgroup ranging from 12 to 29. Blue bars show the components that are more lateralized for females, Red bars show the components that are more lateralized for males. No components survive 0.05 level FDR correction. Component 46 is more lateralized for males (P<0.05).
Figure 14.

Gender effects on the data subgroup ranging from 30 to 71. Blue bars show the components that are more lateralized for females, Red bars show the components that are more lateralized for males. No components survive 0.05 level FDR correction. Components 60, 55 and 47 are more lateralized for females (P<0.05).
In the younger group, visual network component 46 is more right lateralized (p<0.05) on males. In the elder group, left lateralized component 55 (attentional) and component 47 (frontal) are more left lateralized on females, and right lateralized component 60 (attentional) is more lateralized at males.
Footnotes
Publisher's Disclaimer: This is a PDF file of an unedited manuscript that has been accepted for publication. As a service to our customers we are providing this early version of the manuscript. The manuscript will undergo copyediting, typesetting, and review of the resulting proof before it is published in its final citable form. Please note that during the production process errors may be discovered which could affect the content, and all legal disclaimers that apply to the journal pertain.
References
- Allen EA, Erhardt EB, Damaraju E, Gruner W, Segall JM, Silva RF, Calhoun VD. A baseline for the multivariate comparison of resting-state networks. Front Syst Neurosci. 2011;5:2. doi: 10.3389/fnsys.2011.00002. [DOI] [PMC free article] [PubMed] [Google Scholar]
- Ashburner J, Friston KJ. Unified segmentation. Neuroimage. 2005;26(3):839–851. doi: 10.1016/j.neuroimage.2005.02.018. [DOI] [PubMed] [Google Scholar]
- Berger A, Posner MI. Pathologies of brain attentional networks. Neurosci Biobehav Rev. 2000;24(1):3–5. doi: 10.1016/s0149-7634(99)00046-9. [DOI] [PubMed] [Google Scholar]
- Bianki VL. Lateralization of functions in the animal brain. Int J Neurosci. 1981;15(1-2):37–47. doi: 10.3109/00207458108985844. [DOI] [PubMed] [Google Scholar]
- Bottjer SW, Glaessner SL, Arnold AP. Ontogeny of Brain Nuclei Controlling Song Learning and Behavior in Zebra Finches. Journal of Neuroscience. 1985;5(6):1556–1562. doi: 10.1523/JNEUROSCI.05-06-01556.1985. [DOI] [PMC free article] [PubMed] [Google Scholar]
- Breier JI, Simos PG, Zouridakis G, Papanicolaou AC. Lateralization of cerebral activation in auditory verbal and non-verbal memory tasks using magnetoencephalography. Brain Topogr. 1999;12(2):89–97. doi: 10.1023/a:1023458110869. [DOI] [PubMed] [Google Scholar]
- Broca P. Sur le principe des localisations cerebrales. Bulletin de la Société d″Anthropologie. 1861;2:190–204. [Google Scholar]
- Cabeza R, Anderson ND, Locantore JK, McIntosh AR. Aging gracefully: compensatory brain activity in high-performing older adults. Neuroimage. 2002;17(3):1394–1402. doi: 10.1006/nimg.2002.1280. [DOI] [PubMed] [Google Scholar]
- Cai Q, Van der Haegen L, Brysbaert M. Complementary hemispheric specialization for language production and visuospatial attention. Proc Natl Acad Sci U S A. 2013;110(4):E322–330. doi: 10.1073/pnas.1212956110. [DOI] [PMC free article] [PubMed] [Google Scholar]
- Calhoun VD, Adali T, Pearlson GD, Pekar JJ. A method for making group inferences from functional MRI data using independent component analysis. Hum Brain Mapp. 2001;14(3):140–151. doi: 10.1002/hbm.1048. [DOI] [PMC free article] [PubMed] [Google Scholar]
- Clements AM, Rimrodt SL, Abel JR, Blankner JG, Mostofsky SH, Pekar JJ, Cutting LE. Sex differences in cerebral laterality of language and visuospatial processing. Brain Lang. 2006;98(2):150–158. doi: 10.1016/j.bandl.2006.04.007. [DOI] [PubMed] [Google Scholar]
- Corballis MC. Left brain, right brain: facts and fantasies. PLoS Biol. 2014;12(1):e1001767. doi: 10.1371/journal.pbio.1001767. [DOI] [PMC free article] [PubMed] [Google Scholar]
- Davidson RJ. Anterior electrophysiological asymmetries, emotion, and depression: conceptual and methodological conundrums. Psychophysiology. 1998;35(5):607–614. doi: 10.1017/s0048577298000134. [DOI] [PubMed] [Google Scholar]
- DeKeyser RM. Age Effects in Second Language Learning: Stepping Stones Toward Better Understanding. Language Learning. 2013;63:52–67. doi: 10.1111/j.1467-9922.2012.00737.x. [DOI] [Google Scholar]
- Denenberg VH. Hemispheric Laterality in Animals and the Effects of Early Experience. Behavioral and Brain Sciences. 1981;4(1):1–21. [Google Scholar]
- Denenberg VH, Garbanati J, Sherman G, Yutzey DA, Kaplan R. Infantile Stimulation Induces Brain Lateralization in Rats. Science. 1978;201(4361):1150–1152. doi: 10.1126/science.684436. [DOI] [PubMed] [Google Scholar]
- Erhardt EB, Allen EA, Damaraju E, Calhoun VD. On network derivation, classification, and visualization: a response to Habeck and Moeller. Brain Connect. 2011;1(2):1–19. [PMC free article] [PubMed] [Google Scholar]
- Filippi M, Valsasina P, Misci P, Falini A, Comi G, Rocca MA. The organization of intrinsic brain activity differs between genders: a resting-state fMRI study in a large cohort of young healthy subjects. Hum Brain Mapp. 2013;34(6):1330–1343. doi: 10.1002/hbm.21514. [DOI] [PMC free article] [PubMed] [Google Scholar]
- Freire L, Roche A, Mangin JF. What is the best similarity measure for motion correction in fMRI time series? IEEE Trans Med Imaging. 2002;21(5):470–484. doi: 10.1109/TMI.2002.1009383. [DOI] [PubMed] [Google Scholar]
- Genovese CR, Lazar NA, Nichols T. Thresholding of statistical maps in functional neuroimaging using the false discovery rate. Neuroimage. 2002;15(4):870–878. doi: 10.1006/nimg.2001.1037. [DOI] [PubMed] [Google Scholar]
- Giedd JN, Blumenthal J, Jeffries NO, Castellanos FX, Liu H, Zijdenbos A, Rapoport JL. Brain development during childhood and adolescence: a longitudinal MRI study. Nat Neurosci. 1999;2(10):861–863. doi: 10.1038/13158. [DOI] [PubMed] [Google Scholar]
- Gobbele R, Lamberty K, Stephan KE, Stegelmeyer U, Buchner H, Marshall JC, Waberski TD. Temporal activation patterns of lateralized cognitive and task control processes in the human brain. Brain Res. 2008;1205:81–90. doi: 10.1016/j.brainres.2008.02.031. [DOI] [PubMed] [Google Scholar]
- Good CD, Johnsrude I, Ashburner J, Henson RN, Friston KJ, Frackowiak RS. Cerebral asymmetry and the effects of sex and handedness on brain structure: a voxel-based morphometric analysis of 465 normal adult human brains. Neuroimage. 2001;14(3):685–700. doi: 10.1006/nimg.2001.0857. [DOI] [PubMed] [Google Scholar]
- Gotts SJ, Jo HJ, Wallace GL, Saad ZS, Cox RW, Martin A. Two distinct forms of functional lateralization in the human brain. Proc Natl Acad Sci U S A. 2013;110(36):E3435–3444. doi: 10.1073/pnas.1302581110. [DOI] [PMC free article] [PubMed] [Google Scholar]
- Groen MA, Whitehouse AJ, Badcock NA, Bishop DV. Does cerebral lateralization develop? A study using functional transcranial Doppler ultrasound assessing lateralization for language production and visuospatial memory. Brain Behav. 2012;2(3):256–269. doi: 10.1002/brb3.56. [DOI] [PMC free article] [PubMed] [Google Scholar]
- Hauser MD, Andersson K. Left hemisphere dominance for processing vocalizations in adult, but not infant, rhesus monkeys: field experiments. Proc Natl Acad Sci U S A. 1994;91(9):3946–3948. doi: 10.1073/pnas.91.9.3946. [DOI] [PMC free article] [PubMed] [Google Scholar]
- Hellige JB. Hemispheric Asymmetry: What's Right and What's Left. Harvard University Press; 1993. [Google Scholar]
- Herve PY, Zago L, Petit L, Mazoyer B, Tzourio-Mazoyer N. Revisiting human hemispheric specialization with neuroimaging. Trends Cogn Sci. 2013;17(2):69–80. doi: 10.1016/j.tics.2012.12.004. [DOI] [PubMed] [Google Scholar]
- Hirnstein M, Westerhausen R, Korsnes MS, Hugdahl K. Sex differences in language asymmetry are age-dependent and small: a large-scale, consonant-vowel dichotic listening study with behavioral and fMRI data. Cortex. 2013;49(7):1910–1921. doi: 10.1016/j.cortex.2012.08.002. [DOI] [PubMed] [Google Scholar]
- Hugdahl K. Hemispheric asymmetry: contributions from brain imaging. Wiley Interdisciplinary Reviews: Cognitive Science. 2011;2(5):461–478. doi: 10.1002/wcs.122. [DOI] [PubMed] [Google Scholar]
- Hugdahl K, Thomsen T, Ersland L. Sex differences in visuo-spatial processing: an fMRI study of mental rotation. Neuropsychologia. 2006;44(9):1575–1583. doi: 10.1016/j.neuropsychologia.2006.01.026. [DOI] [PubMed] [Google Scholar]
- Hugdahl K, Westerhausen R. The two halves of the brain : information processing in the cerebral hemispheres. Cambridge, Mass.: MIT Press; 2010. [Google Scholar]
- Ingalhalikar M, Smith A, Parker D, Satterthwaite TD, Elliott MA, Ruparel K, Verma R. Sex differences in the structural connectome of the human brain. Proc Natl Acad Sci U S A. 2013 doi: 10.1073/pnas.1316909110. [DOI] [PMC free article] [PubMed] [Google Scholar]
- Janssen L, Meulenbroek RG, Steenbergen B. Behavioral evidence for left-hemisphere specialization of motor planning. Exp Brain Res. 2011;209(1):65–72. doi: 10.1007/s00221-010-2519-5. [DOI] [PMC free article] [PubMed] [Google Scholar]
- Liu H, Stufflebeam SM, Sepulcre J, Hedden T, Buckner RL. Evidence from intrinsic activity that asymmetry of the human brain is controlled by multiple factors. Proc Natl Acad Sci U S A. 2009;106(48):20499–20503. doi: 10.1073/pnas.0908073106. [DOI] [PMC free article] [PubMed] [Google Scholar]
- Mueller S, Wang D, Fox MD, Yeo BT, Sepulcre J, Sabuncu MR, Liu H. Individual variability in functional connectivity architecture of the human brain. Neuron. 2013;77(3):586–595. doi: 10.1016/j.neuron.2012.12.028. [DOI] [PMC free article] [PubMed] [Google Scholar]
- Nielsen JA, Zielinski BA, Ferguson MA, Lainhart JE, Anderson JS. An evaluation of the left-brain vs. right-brain hypothesis with resting state functional connectivity magnetic resonance imaging. PLoS One. 2013;8(8):e71275. doi: 10.1371/journal.pone.0071275. [DOI] [PMC free article] [PubMed] [Google Scholar]
- Nottebohm F. Ontogeny of bird song. Science. 1970;167(3920):950–956. doi: 10.1126/science.167.3920.950. [DOI] [PubMed] [Google Scholar]
- Penhune VB, Zatorre RJ, MacDonald JD, Evans AC. Interhemispheric anatomical differences in human primary auditory cortex: probabilistic mapping and volume measurement from magnetic resonance scans. Cereb Cortex. 1996;6(5):661–672. doi: 10.1093/cercor/6.5.661. [DOI] [PubMed] [Google Scholar]
- Reuter-Lorenz PA, Jonides J, Smith EE, Hartley A, Miller A, Marshuetz C, Koeppe RA. Age differences in the frontal lateralization of verbal and spatial working memory revealed by PET. J Cogn Neurosci. 2000;12(1):174–187. doi: 10.1162/089892900561814. [DOI] [PubMed] [Google Scholar]
- Scott A, Courtney W, Wood D, de la Garza R, Lane S, King M, Calhoun VD. COINS: An Innovative Informatics and Neuroimaging Tool Suite Built for Large Heterogeneous Datasets. Front Neuroinform. 2011;5:33. doi: 10.3389/fninf.2011.00033. [DOI] [PMC free article] [PubMed] [Google Scholar]
- Smith EE, Jonides J, Koeppe RA. Dissociating verbal and spatial working memory using PET. Cereb Cortex. 1996;6(1):11–20. doi: 10.1093/cercor/6.1.11. [DOI] [PubMed] [Google Scholar]
- Sperry RW. The Neuroscience: Third Study Program. Cambridge: MIT Press; 1974. Lateral specialization in the surgically separated hemispheres; pp. 5–19. [Google Scholar]
- Stephan KE, Marshall JC, Friston KJ, Rowe JB, Ritzl A, Zilles K, Fink GR. Lateralized cognitive processes and lateralized task control in the human brain. Science. 2003;301(5631):384–386. doi: 10.1126/science.1086025. [DOI] [PubMed] [Google Scholar]
- Stevens MC, Calhoun VD, Kiehl KA. Hemispheric differences in hemodynamics elicited by auditory oddball stimuli. Neuroimage. 2005;26(3):782–792. doi: 10.1016/j.neuroimage.2005.02.044. [DOI] [PMC free article] [PubMed] [Google Scholar]
- Swanson N, Eichele T, Pearlson G, Kiehl K, Yu Q, Calhoun VD. Lateral differences in the default mode network in healthy controls and patients with schizophrenia. Hum Brain Mapp. 2011;32(4):654–664. doi: 10.1002/hbm.21055. [DOI] [PMC free article] [PubMed] [Google Scholar]
- Thomason ME, Race E, Burrows B, Whitfield-Gabrieli S, Glover GH, Gabrieli JD. Development of spatial and verbal working memory capacity in the human brain. J Cogn Neurosci. 2009;21(2):316–332. doi: 10.1162/jocn.2008.21028. [DOI] [PMC free article] [PubMed] [Google Scholar]
- Van Dijk KRA, Hedden T, Venkataraman A, Evans KC, Lazar SW, Buckner RL. Intrinsic Functional Connectivity As a Tool For Human Connectomics: Theory, Properties, and Optimization. Journal of Neurophysiology. 2010;103(1):297–321. doi: 10.1152/jn.00783.2009. [DOI] [PMC free article] [PubMed] [Google Scholar]
- Wernicke C. Der aphasische Symptomencomplex. Eine psychologische Studie auf anatomischer Basis; Breslau, M Crohn und Weigert 1874 [Google Scholar]
- Xiao Y, H Z, Xu X. Effects of Age of Acquisition and Word Frequency on the Processing Bias of the Middle/Inferior Frontal Gyrus. International Journal of Advances in Psychology. 2012;1:26–36. [Google Scholar]
- Yoon U, Fahim C, Perusse D, Evans AC. Lateralized genetic and environmental influences on human brain morphology of 8-year-old twins. Neuroimage. 2010;53(3):1117–1125. doi: 10.1016/j.neuroimage.2010.01.007. [DOI] [PMC free article] [PubMed] [Google Scholar]
- Zhu L, Fan Y, Zou Q, Wang J, Gao JH, Niu Z. Temporal reliability and lateralization of the resting-state language network. PLoS One. 2014;9(1):e85880. doi: 10.1371/journal.pone.0085880. [DOI] [PMC free article] [PubMed] [Google Scholar]
- Zuo XN, Ehmke R, Mennes M, Imperati D, Castellanos FX, Sporns O, Milham MP. Network centrality in the human functional connectome. Cereb Cortex. 2012;22(8):1862–1875. doi: 10.1093/cercor/bhr269. [DOI] [PubMed] [Google Scholar]
- Zuo XN, Kelly C, Di Martino A, Mennes M, Margulies DS, Bangaru S, Milham MP. Growing together and growing apart: regional and sex differences in the lifespan developmental trajectories of functional homotopy. Journal of Neuroscience. 2010;30(45):15034–15043. doi: 10.1523/JNEUROSCI.2612-10.2010. [DOI] [PMC free article] [PubMed] [Google Scholar]