

Abstract
Prenatal alcohol exposure can result in long-term cognitive and behavioral deficits. Fetal alcohol spectrum disorder (FASD) refers to a range of permanent birth defects caused by prenatal alcohol exposure, and is the most common neurodevelopmental disorder in the US. Studies by autopsy and conventional structural MRI indicate that the midline structures of the brain are particularly vulnerable to prenatal alcohol exposure. Diffusion tensor imaging (DTI) has shown that abnormalities in brain white matter especially the corpus callosum are very common in FASD. Quantitative susceptibility mapping (QSM) is a novel technique that measures tissue’s magnetic property. Such magnetic property is affected by tissue microstructure and molecular composition including that of myelin in the white matter. In this work, we studied three major white matter fiber bundles of a mouse model of FASD and compared it to control mice using both QSM and DTI. QSM revealed clear and significant abnormalities in anterior commissure, corpus callosum, and hippocampal commissure, which were likely due to reduced myelination. Our data also suggested that QSM may be even more sensitive than DTI for examining changes due to prenatal alcohol exposure. Although this is a preclinical study, the technique of QSM is readily translatable to human brain.
Keywords: Quantitative susceptibility mapping, Magnetic susceptibility anisotropy, FASD, DTI, White matter
Introduction
Fetal alcohol spectrum disorder (FASD) is an umbrella term used to describe the range of structural and functional defects that result from prenatal alcohol exposure. Included are long-term cognitive and behavioral abnormalities such as deficits in memory and attention (Streissguth et al., 1994), impairments in language ability (Steinhausen et al., 1982), fine motor dysfunction (Kyllerman et al., 1985), executive function deficits (Connor et al., 2000; Noland et al., 2003), and low intelligence (Alati et al., 2008). It is estimated that FASD occurs in as many as 2–5% of young school children in the US and Western Europe (May et al., 2007). Although FASD is a very common developmental disorder, our understanding of the associated brain abnormalities present within this spectrum remains incomplete.
Clinical and basic research has shown that prenatal alcohol exposure can affect multiple aspects of brain development including neurogenesis, gliogenesis, and myelination (Miller., 1988; Miller., 1993; Phillips, 1989). Conventional structural MRI has revealed both brain dysmorphology and volumetric changes (Lebel et al., 2011), with abnormalities involving median brain structures being frequently noted. In fetal alcohol syndrome (FAS), the syndrome that is at the severe end of the FASD spectrum, the corpus callosum is commonly affected (Swayze et al., 1997; Bookstein et al., 2002). Employing DTI to quantify abnormalities in the white matter fiber tracts of prenatal alcohol-exposed human brains, Ma et al (2005) reported lower fractional anisotropy and higher mean diffusivity (MD) in the genu and splenium of the corpus callosum than in controls. A number of more recent DTI studies have confirmed the vulnerability of the corpus callosum to prenatal alcohol-exposure-induced damage (Wozniak et al., 2006; Sowell et al., 2008; Lebel et al., 2008; Li et al., 2009; Wozniak et al., 2009). In addition, DTI analyses employing tract-based spatial statistics (TBSS) have found reduced FA values in other white matter regions including the cingulate (Sowell et al., 2008) and superior-frontal tracts connecting the occipital lobe with inferior frontal and parietal lobes (Fryer et al., 2009). The reduced FA and increased radial diffusivity (RD) (Li et al., 2009) have largely been attributed to reduced myelination.
Myelin may also be studied based on the magnetic susceptibility property of white matter quantitatively and at high spatial resolution. It has been suggested that susceptibility may be even more sensitive and specific to myelination in the white matter than diffusion metrics. Liu et al (2011) reported that loss of myelin sheath around axons in a transgenic dysmyelinating shiverer mice led to a near complete loss of phase and susceptibility contrasts between gray and white matter while FA and radial diffusivity were reduced by less than 20%. These results suggest that myelin is the predominant source of susceptibility difference between deep gray and white matter. In a recent study, Lodygensky et al (2012) evaluated phase contrast changes during early development of mouse brains. They showed that phase contrast correlated with myelin content assessed by histology, while the gray-white matter phase contrast remains unchanged after iron extraction. Lee et al also showed that frequency contrast is substantially reduced in mice with significant myelin loss induced by a cuprizone diet (Lee et al., 2012). In addition, magnetic susceptibility anisotropy of the white matter is thought to directly reflect the contents of myelin lipids (Li et al., 2012). Together, these studies indicated the potential value of magnetic susceptibility for imaging myelin.
In this study we quantitatively evaluated magnetic susceptibility of white matter in a mouse model of prenatal alcohol exposure (Godin et al., 2010). This mice model mimics human prenatal alcohol exposure occurred at the middle through the end of the third week of brain development, when the fetus brain undergoes its final growth spurt. Automatic ROI-based analysis was employed to assess quantitative susceptibility values of major midline fiber tracts in FASD and control groups using DTI and QSM, respectively. Furthermore, susceptibility anisotropy of major white matter fiber bundles was also evaluated and compared between the two groups. Volume changes of corresponding major white tracts were also measured. The study demonstrated that QSM can detect abnormalities in brain white matter in this FASD model and suggest that it may be even more sensitive than DTI.
Methods
Animal model
All procedures involving animals were approved by the Institutional Animal Care and Use Committee (IACUC) of at the University of North Carolina at Chapel Hill and Duke University. The procedures employed for prenatal ethanol exposure were the same as described by Godin et al (2010). Briefly, female C57BL/6J mice purchased from The Jackson Laboratory (Bar Harbor, ME) were housed in a temperature and humidity-controlled AAALAC-approved environment. Standard laboratory chow and water was available ad libitum. For breeding, 1–2 females were placed with one male for 2 hours. Detection of a copulation plug was defined as gestation day 0 (GD 0). On the beginning of GD 7, pregnant dams were randomly assigned to either an ethanol or control group, weighed, and administered either an intraperitoneal (ip) dose of 25% ethanol (2.9 g/kg) or an equivalent dose of Ringer’s solution. Four hours later a second ethanol or Ringer’s solution dose of equal volume and concentration was administered to each of the dams in the respective groups. This ethanol administration paradigm has previously been employed, yielding a mean peak blood ethanol concentration (BEC) of 440 mg/dl. This ethanol concentration is high enough to induce a range of CNS abnormalities without substantially increasing resorption with the objective of identifying even the most severe consequence of ethanol’s dysmorphogenic effects (Godin et al., 2010). Following ethanol or Ringer’s solution administration, dams were left undisturbed until birth.
The first day after birth was denoted as postnatal day 1 (PN1). All the litters were maintained in a central animal care facility with a 12-hour light/dark cycle and offered free access to water and food. On PN45, two group pups (7 with prenatal alcohol exposure and 7 with prenatal Ringer’s solution exposure) were selected randomly as the ethanol group and the control group, respectively.
Magnetic resonance imaging
Brains were perfused using a transcardial access with a 1:10 mixture of ProHance-buffered formalin. Specimens were immersed in buffered formalin for 24 hours and then moved to a 1:200 solution of ProHance/salin to shorten T1 and reduce scan time. Specimens were scanned at 9.4 T (Oxford 8.9-cm vertical bore; GE 12.5X EXCITE console) using a 3D spoiled-gradient-recalled (SPGR) sequence. The scan parameters were: matrix size = 512×256×256, FOV = 22×11×11 mm3, flip angle = 90°, TE = 4.432 ms, TR = 50 ms, scan time = 54.6 minutes. Diffusion tensor images (DTI) were acquired using a diffusion-weighted 3D spin-echo sequence (Jiang et al., 2010) with the same FOV and matrix size. The other parameters were: TE = 12 ms, TR = 100 ms. One image volume was acquired without diffusion weighting. Six diffusion-encoding directions were used at a b-value of 1500 s/mm2 to allow the calculation of diffusion tensor. The encoding directions were (1 0 1), (1 0 −1), (1 1 0), (1 −1 0), (0 1 1) and (0, 1 −1). Total scan time for DTI was 12 hours and 45 minutes.
Data analyses
Taking into consideration the limited sample size (n = 7 per group), all images were down-sampled to 60 micron isotropic spatial resolution from the native 43 micron resolution to ensure sufficient SNR (representing a 65% increase in the SNR of magnitude images). The diffusion-weighted images (DWI) from all directions were averaged to obtain an isotropic diffusion weighted image and used to extract the brain tissue by thresholding. Although the non-diffusion weighted image can also be used for brain extraction, we found that the isotropic weighted image was more convenient as it suppressed fluid and tissues outside the brain. All phase and susceptibility analysis were conducted in STI Suite (Duke University) (Li et al., 2014). Specifically, the phase of the SPGR data was unwrapped using a Laplacian-based phase unwrapping method (Li et al, 2011). The background phase was removed using the V-SHARP method, using the DWI-determined mask as an input (Li et al, 2011; Li et al, 2014; Wu et al, 2012). Magnetic susceptibility was then obtained from the local tissue phase by solving an inverse problem using the LSQR method (Li et al. 2011). DTI parameters including FA values, MD values and eigenvalues, eigenvectors were computed as previously defined (Basser et al, 1996). All computations were conducted in Matlab R2010a (Mathworks, Natick, MA).
The calculated quantitative susceptibility maps and DTI-derived parameters were then analyzed as outlined in Fig 1. Specifically, FMRIB’s Nonlinear Image Registration Tool (FNIRT) (Oxford University, UK) was used to spatially register the native images to a standard-space template in the Waxholm Space (Johnson et al, 2010) (step 1). The transformation matrix was optimized based on the registration performed on the magnitude images of the gradient echo data. Masks for regions of interest (ROI) in selected white matter fiber bundles were automatically segmented using a previously defined brain atlas (Ali et al., 2005; Badea et al., 2007). These ROI masks included anterior commissure, corpus callosum, and hippocampal commissure. Reverse transformation into each subject’s native space was carried out using invwarp (step 2). The extracted ROIs were also transformed back to the original images including susceptibility images and DTI images (step 3). The accuracy of the transformation was visually inspected for each map using the ITK-SNAP software (Yushkevich et al., 2006). ROIs that clearly exceeded the tissue boundary were revised accordingly (only one mouse in the ethanol group was manually revised for the ROI of hippocampal commissure). These analysis procedures were performed without knowledge of the group categories (ethanol or control). Volumes of ROIs including anterior commissure, corpus callosum, and hippocampal commissure were measured for each subject.
Fig. 1.

Image analysis pipeline for automatic ROI analysis. Step 1: Registration of native magnitude images to a standard-space template with FNIRT. Step 2: Selection of ROI based on predefined template. Step 3: Transformation of the extracted ROIs back to the native image space. A: An example of native magnitude image. B: The standard-space template. C: Average image (n=7) after registration. D, E, and F show anterior commissure, corpus callosum, and hippocampal commissure, respectively. G–I: ROIs (red mask) overlaid on native space of QSM and FA maps.
Magnetic susceptibility anisotropy of these fiber structures were analyzed following Eq. [1], which describes the relationship between susceptibility (χ) of white matter fiber bundles and the fibers angle (α) with respect to the main magnetic field. (Liu et al., 2012).
| [1] |
In Eq. [1], χ0 is a baseline isotropic susceptibility; Δχmax denotes the maximum susceptibility variations (or susceptibility anisotropy) for white matter fiber when imaged at different directions. Fiber angles were measured as the angle between the major eigenvector of the diffusion tensor and the B0 direction. By plotting magnetic susceptibility of different voxels within white matter fibers against sin2α, Δχmax was estimated with a least-square fitting.
Statistics
Statistical analysis for the correlation was performed with SPSS (16.0.2 SPSS Inc.) Data are presented as mean ± standard deviation (SD). Unpaired Student t-test was used for comparisons between the ethanol group and the control group. P value less than 0.05 was considered statistically significant, and P value less than 0.001 was considered statistically highly significant.
Results
Volume of major white matter tracts
The volumes of ROIs were measured and compared between the ethanol group and the control group. As described in Table 1, for the ethanol group, the volume of anterior commissure was found significantly reduced (P<0.05) by 23 % compared to the control group. However, there were no significant differences in the volumes of the corpus callosum and hippocampal commissure between the two groups.
Table 1.
Volume, FA, MD, RD, AD, susceptibility and Δχmax of brain regions in the ethanol group and the control group. AC – anterior commissure; CC – corpus callosum; HC – hippocampal commissure.
| AC | CC | HC | ||
|---|---|---|---|---|
| ETOH | 0.40±0.04 | 5.94±0.50 | 1.93±0.47 | |
| Volume | CTRL | 0.52±0.11 | 6.22±0.57 | 1.96±0.26 |
| (mm3) | P value | 0.01* | 0.20 | 0.45 |
| ETOH | 0.56±0.04 | 0.52±0.05 | 0.57±0.04 | |
| FA | CTRL | 0.58±0.11 | 0.53±0.06 | 0.58±0.06 |
| P value | 0.29 | 0.36 | 0.40 | |
| ETOH | 0.51±0.13 | 0.53±0.09 | 0.53±0.12 | |
| MD | CTRL | 0.46±0.11 | 0.53±0.11 | 0.51±0.09 |
| (10−3mm2/s) | P value | 0.27 | 0.50 | 0.34 |
| ETOH | 0.34±0.10 | 0.38±0.07 | 0.36±0.09 | |
| RD | CTRL | 0.30±0.13 | 0.37±0.11 | 0.35±0.11 |
| (10−3mm2/s) | P value | 0.33 | 0.46 | 0.47 |
| ETOH | 0.85±0.18 | 0.83±0.14 | 0.89±0.18 | |
| AD | CTRL | 0.78±0.46 | 0.84±0.44 | 0.82±0.35 |
| (10−3mm2/s) | P value | 0.37 | 0.48 | 0.34 |
| ETOH | −3.82±0.78 | −2.19±0.68 | −2.59±1.25 | |
| Susceptibility | CTRL | −6.83±1.77 | −3.00±0.81 | −4.36±1.82 |
| (10−2ppm) | P value | <0.001** | 0.03* | 0.03* |
| ETOH | −8.15±5.06 | −4.88±2.65 | −7.97±4.19 | |
| Δχmax | CTRL | −9.96±7.52 | −4.58±2.51 | −12.41±4.29 |
| (10−2) | P value | 0.32 | 0.42 | 0.05* |
Note: n=7. All the data are expressed as mean±SD.
P<0.001;
P≤0.05
Prenatal ethanol exposure significantly decreases susceptibility contrast between gray and white matter
Fig. 2 shows a representative set of susceptibility maps covering all three ROIs for the ethanol group and control group. Consistent with previous studies, white matter exhibits largely negative susceptibility (i.e. being diamagnetic) while gray matter exhibits largely positive susceptibility (i.e. being paramagnetic). This difference results in a strong susceptibility contrast between gray and white matter in the control mice. Overall, compared to the ethanol group, the control mice visually exhibit higher susceptibility contrast between gray matter and white matter. The ethanol group has clearly reduced susceptibility contrast in all three ROIs including anterior commissure (Fig. 2A&B), corpus callosum (Fig. 2C&D), and the hippocampal commissure (Fig. 2E&F). The reduced susceptibility contrast in the ethanol group is due to increased magnetic susceptibility of white matter. In other words, white matter in the ethanol group becomes less diamagnetic while gray matter remains paramagnetic, thus resulting in the reduced gray and white matter contrast. On average, the susceptibility values (mean ± standard deviation) changed from (−6.83±1.77)×10−2 ppm, (−3.00±0.81)×10−2 ppm, and (−4.36±1.82)×10−2 ppm in the control group to (−3.82±0.78)×10−2 ppm, (−2.19±0.68)×10−2 ppm, and (−2.59±1.25)×10−2 ppm in the ethanol group for the anterior commissure, the corpus callosum, and the hippocampal commissure, respectively (Table 1). These values represent an increase of magnetic susceptibility (or reduction of the amplitude of susceptibility values as they are negative) in the ethanol group by 44.1%, 27.1%, and 40.6% in the anterior commissure, corpus callosum, and hippocampal commissure respectively (Table 1). Significant differences (P<0.05) were observed in all three ROIs for susceptibility values between the two groups, with a particularly large difference (P<0.001) in the anterior commissure (Fig. 4A).
Fig. 2.

Comparison of QSM in three representative slices between the ethanol (ETOH) and the control (CTRL) group. Clear reduction of white matter and gray matter contrast are visible (arrows). (A–B) A slice covering the anterior commissure (AC), (C–D) the corpus callosum (CC) and (E–F) the hippocampal commissure (HC).
Fig. 4.

Statistical comparison of susceptibility values and FA values in three ROIs between the ethanol group and the control group (n = 7). (A) Significant differences were observed in all three ROIs between the two groups, in particular with a large difference in anterior commissure (AC). ** P <0.001; * P≤0.05. (B) No significant differences were observed for FA values in each ROI between the two groups.
Insignificant difference in DTI parameters
No significant visual distinction was identified on the FA maps for all three ROIs between the ethanol group and the control group (Fig. 3). Though the corpus callosum is vulnerable to prenatal alcohol exposure-induced damage, the FA maps of the ethanol group still showed a strong contrast between gray matter and white matter (Fig. 3C). The average FA values (mean ± standard deviation) in the control group were 0.58±0.11, 0.53±0.06, and 0.58±0.06 in the anterior commissure, the corpus callosum, and the hippocampal commissure, respectively (Table 1). In the ethanol group, the corresponding values were 0.56±0.04, 0.52±0.05, and 0.57±0.04. The differences are statistically insignificant (P>0.05) as illustrated in Fig. 4B.
Fig. 3.

Comparison of FA maps in three representative slices between the ethanol and control group. The differences in the FA maps are visually less obvious compared to QSM in Fig. 2.
Similarly, no statistical significant differences were found in the mean diffusivity in the anterior commissure, corpus callosum and hippocampal commissure between the two groups (Table 1). Likewise, no differences were observed in either radial or axial diffusivity (AD) between the two groups (P>0.05) (Table 1).
Changes in magnetic susceptibility anisotropy
Fig. 5 plots the magnetic susceptibility values as a function of the fiber angle for one representative pair of ethanol-exposed and control mice. For both the control and the ethanol group, magnetic susceptibility decreased monotonously as the fiber angle increased following a sine-squared relationship, as predicted by the theory (Liu et al., 2012). However, the rates of decrease (i.e. the magnetic susceptibility anisotropy) were generally higher in the control group. Fig. 6 compared the fitted maximum susceptibility variations (Δχmax), i.e. the susceptibility anisotropy, between the two groups. The absolute values of Δχmax were decreased in the ethanol group in both the anterior commissure and hippocampal commissure (Table 1). The difference was significant (p=0.05) in the hippocampal commissure between two groups (Fig. 6).
Fig. 5.

Comparison of susceptibility anisotropy between the ethanol and control group. Orientation dependence of magnetic susceptibility is plotted as a function of sin2α where α is the angle between the fiber and B0 field. Anisotropy is fitted for three ROIs: the anterior commissure, the corpus callosum and the hippocampal commissure of a representative ethanol-exposed mouse and a control mouse.
Fig. 6.
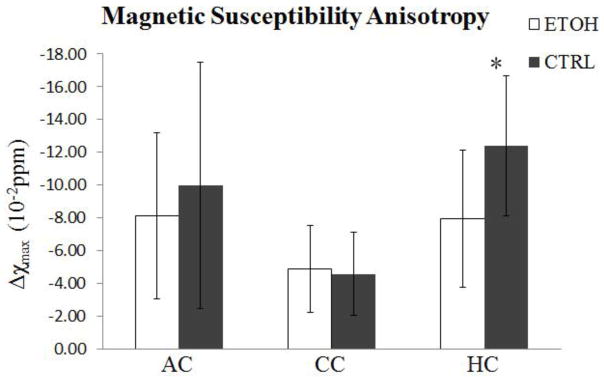
Statistical comparison of magnetic susceptibility anisotropy in three ROIs. A significant difference was observed in the hippocampal commissure between the two groups. Susceptibility anisotropy is reduced in the ethanol group. *P≤0.05.
Discussion
In this study, we showed that magnetic susceptibility is sensitive to white matter changes induced by prenatal alcohol exposure in a commonly used mouse model. Our study focused on midline structures that are known to be affected by prenatal alcohol exposure. We found significantly increased magnetic susceptibility in three major midline white matter structures including corpus callosum, anterior commissure and hippocampal commissure, resulting in reduced susceptibility contrast with surrounding gray matter. Susceptibility anisotropy was also significantly decreased in hippocampal commissure. In comparison, no statistically significant changes were observed in DTI parameters within our sample.
Volume reduction of anterior commissure in mice white matter with FASD
A variety of evidences suggest that white matter is a specific target of alcohol-induced damage in brain. Autopsy studies and conventional structural MRI reported the reduction of volumes in white matter in FASD (Clarren., 1981; Archibald et al., 2001; Lebel et al., 2011). In current study, we observed a significant reduction of volume in anterior commissure, which was consistent with previous studies on the morphological damage in white matter in prenatal alcohol exposed mice. Our analysis however did not evaluate potential changes in specific fiber tracts or segments of fiber tracts, nor the total volume of the entire white matter.
Insignificant differences in DTI parameters
DTI is a widely used technique for imaging white matter microstructure and connectivity, in both healthy brains and brains affected by various diseases and disorders. Previous studies have shown that DTI parameters are altered by prenatal alcohol exposure. For example, it has been generally reported that FA decreases in major white matter tracts in children (approximately 10 years of age) with FASD (Sowell et al., 2008; Lebel et al., 2008). The reported percentage changes are however generally very small, e.g. a 4–8% change of FA as reported in Lebel et al (2008). The mice imaged in this study were 45 (postnatal) days old, which is equivalent to an age of 10–12 years in humans. Within the group of mice (n=7) studied here, a slight decrease in FA and increase in RD was observed in the ethanol group for all three ROIs, though statistically insignificant (P>0.05). Prenatal alcohol exposure may result in reduction of myelinated axons in a mouse model and the humans (Poster., 1973; Alling et al., 1980; Parson and Sojitra., 1995). However, myelin is not the dominant contributing factor to FA and MD (Gulani et al., 2001;). Although RD is considered more specific to assess myelin in white matter than FA (Song et al., 2005), myelination still affects less than 20% of diffusion anisotropy. In addition, the current mouse model only evaluated the effect of a single exposure whereas human subjects are typically exposed to alcohol much more frequently. This may be another factor contributing to the insignificant differences in DTI parameters found in this study.
Significantly decreased magnetic susceptibility contrast and susceptibility anisotropy
We observed a significant increase of susceptibility (P<0.05) in all three ROIs that were examined (anterior commissure, corpus callosum, and hippocampal commissure) in the ethanol group compared to the control group, resulting in reduction of susceptibility contrast between these white regions and surrounding gray matter. The significance was especially high (P<0.001) in the anterior commissure. Magnetic susceptibility of brain tissues can be affected by many sources with iron and proteins as the leading endogenous sources (Duyn et al., 2007). Diamagnetic (i.e. negative) susceptibility of white matter is generally believed to be caused by myelination. Recently, Liu et al (2011) reported that, in the absence of myelin, the susceptibility contrast between gray and white matter nearly extinguished in the shiverer mouse model. The relationship between the diamagnetic susceptibility of white matter and myelin has also been verified by other studies, e.g. in cuprizone-induced demyelination (Lee et al., 2012) and in developing brains (Zhong et al., 2011; Lodygensky et al., 2012; Argyridis et al., 2014). These results indicated that the main source of susceptibility contrast in white matter is myelin and abnormalities associated with myelin such as demyelination or reduced myelin formation will affect the susceptibility contrast in deep white matter. Our findings of increased magnetic susceptibility in major white mater fiber bundles are thus consistent with previous reports of reduced demyelination in midline white matter in FASD.
In addition, decreased magnetic susceptibility anisotropy was also observed in the ethanol group in both the anterior commissure and hippocampal commissure. This was expected since susceptibility anisotropy is also induced by myelin. Magnetic susceptibility of white matter has been known to be anisotropic (Liu., 2010; Lee et al., 2010). This magnetic susceptibility anisotropy was explained by an anisotropic susceptibility of the lipid bilayers in the myelin sheath (Li et al., 2012). The observed reduced susceptibility anisotropy is thus consistent with the myelin explanation. However, the statistical significance observed in the susceptibility anisotropy differences is not as robust as that found in susceptibility maps. This reduced robustness is likely due to a couple of reasons. First, the anisotropy is a fitted slope of susceptibility vs. fiber orientation while orientation is measured based on DTI. Imperfect registration can adversely affect the reliability of the estimate. Second, the variation of myelination along a given fiber tract cannot be factored into the analysis due to the lack of multi-orientation susceptibility data. Nevertheless, both quantitative susceptibility and susceptibility anisotropy supports the idea of compromised myelination development in brains affected by prenatal alcohol exposure.
While the alteration of susceptibility and susceptibility anisotropy of the white matter in the ethanol group is consistent with the consequences of myelin reduction, such alteration may not be solely caused by the reduction of myelin. Other factors including iron deposit and axonal packing density may also contribute to susceptibility changes. While iron deposit will cause increase of susceptibility, it is unlikely to change susceptibility anisotropy. On the other hand, reduced axonal packing density can lead to both increased white matter susceptibility and decreased susceptibility anisotropy. In this scenario, while the myelin thickness per axon may not change, the average myelin density per imaging voxel is reduced. Our current data cannot clearly identify the exact mechanism of the apparently reduced total myelination, i.e. whether it’s due to the thinning of myelin sheath or the reduced axonal packing density.
QSM vs. DTI in FASD
A variety of methods including ROI analysis, voxel-based morphometry (VBM), and tractography have been performed to explore the microstructural abnormalities in FASD using DTI (Ma et al., 2005; Woziniak et al., 2006; Sowell et al., 2008; Li et al., 2009; Woziniak et al., 2009). Some studies showed poor white matter integrity in some fiber tracts due to prenatal alcohol exposure (Sowell et al., 2008; Fryer et al., 2009), while others reported no significant differences between FASD subjects and controls. For example, Wozniak et al (2006) studied 14 children with FASD and 13 healthy controls. They analyzed 6 ROIs in corpus callosum, and found no significant differences for FA in all the ROIs except increased MD in the isthmus of the corpus callosum in FASD. The relatively small number of subjects (14 FASD versus 13 controls) and a narrow age range (10–13years old) are possible limitations of that experiment. Another major limitation they referred to is the lack of specificity of the technique applied. Similarly, the study by Li et al (2009) also reported no significant differences for FA in corpus callosum between participants with mild alcohol exposure and controls using voxel-based morphometry (VBM) analysis; neither did they find group differences for MD, AD or RD.
In our study, we did not observe any statistically significant difference in FA or diffusivity values between the ethanol group and the control group. On the other hand, we observed significant reduction of susceptibility contrast in the ethanol group for all the three ROIs albeit with a limited number of subjects (n=7). This reduction is consistent with prior histological evidences of reduced myelination in FASD. The improved ability for susceptibility to detect reduced myelin content is not surprising as the study of shiverer mice has shown that magnetic susceptibility is more sensitive to loss of myelination than diffusion parameters (Liu et al., 2011). Besides the corpus callosum, susceptibility contrast is also reduced in the anterior commissure and the hippocampal commissure. The corpus callosum, the largest midline fiber tract in the brain, has been a major focus of interest in FASD imaging studies. While few DTI studies examining abnormalities in the anterior commissure and hippocampal commissure have been reported, our findings of reduced susceptibility contrast in these structures are consistent with previous gross, histological and MRI studies describing their partial or complete agenesis (Jones et al., 1973; Peiffer et al., 1979; Higashiyama et al., 2007; Johnson et al., 1996). Taken together, our results suggested that magnetic susceptibility maybe a more sensitive marker than DTI parameters for white matter abnormalities caused by prenatal alcohol exposure.
Limitations and Future Directions
While our analyses are based on ROIs, VBM is an alternative method that can be used to examine whole-brain differences on voxel-by-voxel basis. Because it performs voxel by voxel comparison, VBM puts more stringent requirement on the quality of registration (Smith et al., 2006). In addition, VBM is most robust when the lesion locations are identical between brains; however, it is highly likely that there are anatomical variations in the white matter that are affected by prenatal alcohol exposure. Due to the limited sample size, we have limited the analysis to selected ROIs which is less susceptible to the aforementioned factors. The anterior commissure, corpus callosum, and hippocampal commissure are large tracts whose fibers can be traced across many slices, thus allowing more reliable ROI selections. Prenatal alcohol exposure is likely to induce brain dysmorphologies that differ from the normal brains. We thus further used nonlinear registration to improve alignment with the brain template while quantitative parameters (DTI and QSM) were computed in the native space. These procedures avoided errors caused by interpolation and reduced partial volume effects. The main partial volume effect occurred at the ROI boundaries which was unavoidable due to limited image resolution, but nonetheless is consistent among all images, thus does not induce bias. This automatic ROI-based analysis effectively reduced user-dependent bias in manually outlining ROIs and the errors associated with registration or normalization in VBM. However, our analysis was restricted to the three large structures.
Because the mouse brains were perfused with Gadolinium-based contrast agents, the susceptibility values measured were influenced by the presence of Gadolinium. Gadolinium shortens T1 which allows high-resolution DTI scans to be conducted in a reasonable amount of time. A recent study has shown that introducing Gd enhances gray and white matter susceptibility contrast (Dibb et al., 2014). However, the sensitivity of magnetic susceptibility to demyelination has been demonstrated both ex vivo and in vivo in the absence of any contrast agents (Liu et al., 2011; Lee et al., 2012). Nevertheless, future histological studies, particularly myelin staining, are still needed to verify that the QSM findings are indeed related to myelin loss in this specific model of FASD. Such histological data unfortunately are not available in this current study due to the retrospective nature of the analysis. In addition, the sensitivity of QSM in detecting white matter abnormalities in FASD still needs to be verified in native tissues both in vivo and in human patients. Future studies are also needed to determine the time course of developmental-dependent myelin content reductions as our current study focused on only a single day of alcohol exposure. In addition, because of the improved sensitivity, the technique may be useful for detecting changes and plasticity associated with postnatal alcohol exposure.
Conclusions
We have demonstrated reduced susceptibility contrast and anisotropy in major midline white matter tracts of mouse brains resulting from prenatal alcohol exposure. This reduced susceptibility contrast suggests reduced myelin content during brain development. Our data further indicates that QSM may be even more sensitive than DTI in detecting abnormalities in brain white matter caused by prenatal alcohol exposure. However, further in vivo and human studies are needed to validate these findings.
Highlights.
Prenatal alcohol exposure significantly reduces susceptibility contrast of the brain
Prenatal alcohol exposure significantly reduces susceptibility anisotropy of white matter
Changes in magnetic susceptibility reflects reduced myelination due to alcohol exposure
Magnetic susceptibility may be more sensitive than DTI for detecting such changes
Acknowledgments
The study was supported in part by the National Institutes of Health (NIH) through grant P41EB015897, R01MH096979, U01-AA017124, U01-AA021651, and P60-AA011605 and the National Multiple Sclerosis Society through grant RG4723.
Footnotes
Publisher's Disclaimer: This is a PDF file of an unedited manuscript that has been accepted for publication. As a service to our customers we are providing this early version of the manuscript. The manuscript will undergo copyediting, typesetting, and review of the resulting proof before it is published in its final citable form. Please note that during the production process errors may be discovered which could affect the content, and all legal disclaimers that apply to the journal pertain.
References
- 1.Alati R, Clavarino A, Najman JM, O’Callaghan M, Bor W, Mamun AA, Williams GM. The developmental origin of adolescent alcohol use: Findings from the Mater University Study of Pregnancy and its outcomes. Drug Alcohol Depend. 2008;98:136–143. doi: 10.1016/j.drugalcdep.2008.05.011. [DOI] [PubMed] [Google Scholar]
- 2.Ali AA, Dale AM, Badea A, Johnsona GA. Automated segmentation of neuroanatomical structures in multispectral MR microscopy of the mouse brain. NeuroImage. 2005;27:425–435. doi: 10.1016/j.neuroimage.2005.04.017. [DOI] [PubMed] [Google Scholar]
- 3.Alling C, Bostrom K. Demyelination of the mamillary bodies in alcoholism. A combined morphological and biochemical study. Acta Neuropathol. 1980;50:77–80. doi: 10.1007/BF00688539. [DOI] [PubMed] [Google Scholar]
- 4.Argyridis I, Li W, Johnson GA, Liu C. Quantitative magnetic susceptibility of the developing mouse brain reveals microstructural changes in the white matter. NeuroImage. 2014;88:134–142. doi: 10.1016/j.neuroimage.2013.11.026. [DOI] [PMC free article] [PubMed] [Google Scholar]
- 5.Archibald SL, Fennema-Notestine C, Gamst A, Riley EP, Mattson SN, Jernigan TL. Brain dysmorphology in individuals with severe prenatal alcohol exposure. Dev Med Child Neurol. 2001;43(3):148–154. [PubMed] [Google Scholar]
- 6.Badea A, Ali-Sharief AA, Johnson GA. Morphometric analysis of the C57BL/6J mouse brain. NeuroImage. 2007;37(3):683–693. doi: 10.1016/j.neuroimage.2007.05.046. [DOI] [PMC free article] [PubMed] [Google Scholar]
- 7.Basser PJ, Pierpaoli C. Microstructural and physiological features of tissues elucidated by quantitative-diffusion-tensor MRI. J Magn Reson B. 1996;111:209–219. doi: 10.1006/jmrb.1996.0086. [DOI] [PubMed] [Google Scholar]
- 8.Bookstein FL, Sampson PD, Connor PD, Streissguth AP. Midline corpus callosum is a neuroanatomical focus of fetal alcohol damage. Anat Rec. 2002;269:162–174. doi: 10.1002/ar.10110. [DOI] [PubMed] [Google Scholar]
- 9.Clarren SK. Recognition of Fetal Alcohol Syndrome. Journal of the American Medical Association. 1981;245(23):2436–2439. [PubMed] [Google Scholar]
- 10.Connor P, Sampson P, Bookstein F, Barr H, Streissguth A. Direct and indirect effects of prenatal alcohol damage on executive function. Dev Neuropsychol. 2000;18:331–354. doi: 10.1207/S1532694204Connor. [DOI] [PubMed] [Google Scholar]
- 11.Dibb R, Li W, Cofer G, Liu C. Microstructural origins of gadolinium-enhanced susceptibility contrast and anisotropy. Magn Reson Med 2014. 2014 Jan 17; doi: 10.1002/mrm.25082. Epub ahead of print. [DOI] [PMC free article] [PubMed] [Google Scholar]
- 12.Duyn JH, van Gelderen P, Li TQ, de Zwart JA, Koretsky AP, Fukunaga M. High-field MRI of brain cortical substructure based on signal phase. Proc Natl Acad Sci USA. 2007;104:11796–11801. doi: 10.1073/pnas.0610821104. [DOI] [PMC free article] [PubMed] [Google Scholar]
- 13.Fryer SL, Schweinsburg BC, Bjorkquist OA, Frank LR, Mattson SN, Spadoni AD, Riley EP. Characterization of white matter microstructure in fetal alcohol spectrum disorders. Alcohol Clin Exp Res. 2009;33(3):514–521. doi: 10.1111/j.1530-0277.2008.00864.x. [DOI] [PMC free article] [PubMed] [Google Scholar]
- 14.Godin EA, O’Leary-Moore SK, Khan A, Parnell SE, Ament JJ, Dehart DB, Johnson BW, Johnson GA, Styner MA, Sulik KK. Magnetic Resonance Microscopy Defines Ethanol-Induced Brain Abnormalities in Prenatal Mice: Effects of Acute Insult on Gestational Day 7. Alcohol Clin Exp Res. 2010;34(1):98–111. doi: 10.1111/j.1530-0277.2009.01071.x. [DOI] [PMC free article] [PubMed] [Google Scholar]
- 15.Gulani V, Webb AG, Duncan ID, Lauterbur PC. Apparent diffusion tensor measurements in myelin-deficient rat spinal cords. Magn Reson Med. 2001;45(2):191–195. doi: 10.1002/1522-2594(200102)45:2<191::aid-mrm1025>3.0.co;2-9. [DOI] [PubMed] [Google Scholar]
- 16.Higashiyama D, Saitsu H, Komada M, Takigawa T, Ishibashi M, Shiota K. Sequential Developmental Changes in Holoprosencephalic Mouse Embryos Exposed to Ethanol during the Gastrulation Period. Birth Defects Res A Clin Mol Teratol. 2007;79:513–523. doi: 10.1002/bdra.20367. [DOI] [PubMed] [Google Scholar]
- 17.Jiang Y, Johnson GA. Microscopic Diffusion Tensor Imaging of the Mouse Brain. NeuroImage. 2010;50:465–471. doi: 10.1016/j.neuroimage.2009.12.057. [DOI] [PMC free article] [PubMed] [Google Scholar]
- 18.Johnson GA, Badea A, Brandenburg J, Cofer G, Fubara B, Liu S, Nissanov J. Waxholm space: an image-based reference for coordinating mouse brain research. NeuroImage. 2010;53:365–372. doi: 10.1016/j.neuroimage.2010.06.067. [DOI] [PMC free article] [PubMed] [Google Scholar]
- 19.Johnson VP, Swayze VW, Sato Y, Andreasen NC. Fetal alcohol syndrome: craniofacial and central nervous system manifestations. Am J Med Genet. 1996;61(4):329–339. doi: 10.1002/(SICI)1096-8628(19960202)61:4<329::AID-AJMG6>3.0.CO;2-P. [DOI] [PubMed] [Google Scholar]
- 20.Jones KL, Smith DW, Ulleland CN, Streissguth AP. Pattern of malformation in offspring of chronic alcoholic mothers. Lancet. 1973;1:1267–1271. doi: 10.1016/s0140-6736(73)91291-9. [DOI] [PubMed] [Google Scholar]
- 21.Kyllerman M, Aronson M, Sabel KG, Karlberg E, Sandin B, Olegird R. Children of alcoholic mothers: Growth and motor performance compared to matched controls. Acta Paediatr Scand. 1985;74:20–26. doi: 10.1111/j.1651-2227.1985.tb10915.x. [DOI] [PubMed] [Google Scholar]
- 22.Lebel C, Rasmussen C, Wyper K, Walker L, Andrew G, Yager J, Beaulieu C. Brain diffusion abnormalities in children with fetal alcohol spectrum disorder. Alcohol Clin Exp Res. 2008;23(10):1732–1740. doi: 10.1111/j.1530-0277.2008.00750.x. [DOI] [PubMed] [Google Scholar]
- 23.Lebel C, Roussotte F, Sowell ER. Imaging the Impact of Prenatal Alcohol Exposure on the Structure of the Developing Human Brain. Neuropsychol Rev. 2011;21:102–118. doi: 10.1007/s11065-011-9163-0. [DOI] [PMC free article] [PubMed] [Google Scholar]
- 24.Lee J, Shmueli K, Fukunaga M, van Gelderen P, Merkle H, Silva AC, Duyn JH. Sensitivity of MRI resonance frequency to the orientation of brain tissue microstructure. Proc Natl Acad Sci USA. 2010;107:5130–5135. doi: 10.1073/pnas.0910222107. [DOI] [PMC free article] [PubMed] [Google Scholar]
- 25.Lee J, Shmueli K, Kang BT, Yao B, Fukunaga M, van Gelderen P, Palumbo S, Bosetti F, Silva AC, Duyn JH. The contribution of myelin to magnetic susceptibility-weighted contrasts in high-field MRI of the brain. NeuroImage. 2012;59:3967–3975. doi: 10.1016/j.neuroimage.2011.10.076. [DOI] [PMC free article] [PubMed] [Google Scholar]
- 26.Li L, Coles CD, Lynch ME, Hu X. Voxelwise and skeleton-based region of interest analysis of fetal alcohol syndrome and fetal alcohol spectrum disorders in young adults. Hum Brain Mapp. 2009;30(10):3265–3274. doi: 10.1002/hbm.20747. [DOI] [PMC free article] [PubMed] [Google Scholar]
- 27.Li W, Avram AV, Wu B, Xiao X, Liu C. Integrated Laplacian-based phase unwrapping and background phase removal for quantitative susceptibility mapping. NMR Biomed. 2014;27:219–27. doi: 10.1002/nbm.3056. [DOI] [PMC free article] [PubMed] [Google Scholar]
- 28.Li W, Wu B, Avram A, Liu C. Magnetic susceptibility anisotropy of human brain in vivo and its molecular underpinnings. NeuroImage. 2012;59:2088–2097. doi: 10.1016/j.neuroimage.2011.10.038. [DOI] [PMC free article] [PubMed] [Google Scholar]
- 29.Li W, Wu B, Liu C. Quantitative susceptibility mapping of human brain reflects spatial variation in tissue composition. NeuroImage. 2011;55 (4):1645–1656. doi: 10.1016/j.neuroimage.2010.11.088. [DOI] [PMC free article] [PubMed] [Google Scholar]
- 30.Liu C. Susceptibility Tensor Imaging. Magn Reson Med. 2010;63:1471–1477. doi: 10.1002/mrm.22482. [DOI] [PMC free article] [PubMed] [Google Scholar]
- 31.Liu C, Li W, Johnson GA, Wu B. High-field (9.4 T) MRI of brain dysmyelination by quantitative mapping of magnetic susceptibility. NeuroImage. 2011;56:930–938. doi: 10.1016/j.neuroimage.2011.02.024. [DOI] [PMC free article] [PubMed] [Google Scholar]
- 32.Liu C, Li W, Wu B, Jiang Y, Johnson GA. 3D fiber tractography with susceptibility tensor imaging. NeuroImage. 2012;59:1290–1298. doi: 10.1016/j.neuroimage.2011.07.096. [DOI] [PMC free article] [PubMed] [Google Scholar]
- 33.Lodygensky GA, Marques JP, Maddage R, Perroud E, Sizonenko SV, Hüppi PS, Gruetter R. In vivo assessment of myelination by phase imaging at high magnetic field. NeuroImage. 2012;59:1979–1987. doi: 10.1016/j.neuroimage.2011.09.057. [DOI] [PubMed] [Google Scholar]
- 34.Ma X, Coles CD, Lynch ME, Laconte SM, Zurkiya O, Wang D, Hu X. Evaluation of corpus callosum anisotropy in young adults with fetal alcohol syndrome according to diffusion tensor imaging. Alcohol Clin Exp Res. 2005;29(7):1214–1222. doi: 10.1097/01.alc.0000171934.22755.6d. [DOI] [PubMed] [Google Scholar]
- 35.May PA, Gossage JP, Marais AS, Adnams CM, Hoyme HE, Jones KL, Robinson LK, Khaole N, Snell C, Kalberg WO, Hendricks L, Brooke L, Stellavato C, Viljoen DL. The epidemiology of fetal alcohol syndrome and partial FAS in a South African community. Drug Alcohol Depend. 2007;88:259–271. doi: 10.1016/j.drugalcdep.2006.11.007. [DOI] [PMC free article] [PubMed] [Google Scholar]
- 36.Miller MW. Effect of prenatal exposure to ethanol on the development of cerebral cortex: I. Neuronal generation. Alcohol Clin Exp Res. 1988;12:440–449. doi: 10.1111/j.1530-0277.1988.tb00223.x. [DOI] [PubMed] [Google Scholar]
- 37.Miller MW. Migration of cortical neurons is altered by gestational exposure to ethanol. Alcohol Clin Exp Res. 1993;17:304–314. doi: 10.1111/j.1530-0277.1993.tb00768.x. [DOI] [PubMed] [Google Scholar]
- 38.Noland JS, Singer LT, Arendt RE, Minnes S, Short EJ, Bearer CF. Executive functioning in preschool-age children prenatally exposed to alcohol, cocaine, and marijuana. Alcohol Clin Exp Res. 2003;27:647–656. doi: 10.1097/01.ALC.0000060525.10536.F6. [DOI] [PMC free article] [PubMed] [Google Scholar]
- 39.Parson SH, Sojitra NM. Loss of myelinated axons is specific to the central nervous system in a mouse model of the fetal alcohol syndrome. J Anat. 1995;187:739–748. [PMC free article] [PubMed] [Google Scholar]
- 40.Peiffer J, Majewski F, Fischbach H, Bierich JR, Volk B. Alcohol embryo- and fetopathy. Neuropathology of 3 children and 3 fetuses. J Neurol Sci. 1979;41:125–137. doi: 10.1016/0022-510x(79)90033-9. [DOI] [PubMed] [Google Scholar]
- 41.Phillips DE. Effects of limited postnatal ethanol exposure on the development of myelin and nerve fibers in rat optic nerve. Exp Neurol. 1989;107:90–97. doi: 10.1016/0014-4886(89)90190-8. [DOI] [PubMed] [Google Scholar]
- 42.Poser CM. Demyelination in the central nervous system in chronic alcoholism: Central pontine myelinolysis and marchiafava-bignami’s disease. Ann N Y Acad Sci. 1973;215:373–381. doi: 10.1111/j.1749-6632.1973.tb28293.x. [DOI] [PubMed] [Google Scholar]
- 43.Sampson PD, Streissguth AP, Bookstein FL, Little RE, Clarren SK, Dehaene P, Hanson JM, Graham JM., JR Incidence of fetal alcohol syndrome and prevalence of alcohol-related neurodevelopmental disorder. Teratology. 1997;56:317–326. doi: 10.1002/(SICI)1096-9926(199711)56:5<317::AID-TERA5>3.0.CO;2-U. [DOI] [PubMed] [Google Scholar]
- 44.Smith SM, Jenkinson M, Johansen-Berg H, Rueckert D, Nichols TE, Mackay CE, Watkins KE, Ciccarelli O, Cader MZ, Matthews PM, Behrens TEJ. Tract-based spatial statistics: Voxelwise analysis of multi-subject diffusion data. NeuroImage. 2006;31:1487–1505. doi: 10.1016/j.neuroimage.2006.02.024. [DOI] [PubMed] [Google Scholar]
- 45.Song SK, Yoshino J, Le TQ, Lin SJ, Sun SW, Cross AH, Armstrong RC. Demyelination increases radial diffusivity in corpus callosum of mouse brain. NeuroImage. 2005;26:132–140. doi: 10.1016/j.neuroimage.2005.01.028. [DOI] [PubMed] [Google Scholar]
- 46.Sowell ER, Johnson A, Kan E, Lu LH, Van Horn JD, Toga AW, O’Connor MJ, Bookheimer SY. Mapping white matter integrity and neurobehavioral correlates in children with fetal alcohol spectrum disorders. J Neurosci. 2008;28(6):1313–1319. doi: 10.1523/JNEUROSCI.5067-07.2008. [DOI] [PMC free article] [PubMed] [Google Scholar]
- 47.Steinhausen HC, Nestler V, Spohr HL. Development and psychopathology of children with the fetal alcohol syndrome. J Dev Behav Pediatr. 1982;3:49–54. [PubMed] [Google Scholar]
- 48.Streissguth A, Sampson P, Olson H, Bookstein F, Barr H, Scott M, Feldman J, Mirsky A. Maternal drinking during pregnancy: attention and short-term memory in 14-year-old offspring–a longitudinal prospective study. Alcohol Clin Exp Res. 1994;18:202–218. doi: 10.1111/j.1530-0277.1994.tb00904.x. [DOI] [PubMed] [Google Scholar]
- 49.Swayze VW, Johnson VP, Hanson JW, Piven J, Sato Y, Giedd JN, Mosnik D, Andreasen NC. Magnetic resonance imaging of brain anomalies in fetal alcohol syndrome. Pediatrics. 1997;99:232–240. doi: 10.1542/peds.99.2.232. [DOI] [PubMed] [Google Scholar]
- 50.Wozniak JR, Mueller BA, Chang P, Muetzel RL, Caros L, Lim KO. Diffusion tensor imaging in children with fetal alcohol spectrum disorders. Alcohol Clin Exp Res. 2006;30:1799–1806. doi: 10.1111/j.1530-0277.2006.00213.x. [DOI] [PMC free article] [PubMed] [Google Scholar]
- 51.Wozniak JR, Muetzel RL, Mueller BA, McGee CL, Freerks MA, Ward EE, Nelson ML, Chang PN, Lim KO. Microstructural corpus callosum anomalies in children with prenatal alcohol exposure: an extension of previous diffusion tensor imaging findings. Alcohol Clin Exp Res. 2009;33(10):1825–1835. doi: 10.1111/j.1530-0277.2009.01021.x. [DOI] [PMC free article] [PubMed] [Google Scholar]
- 52.Wu B, Li W, Guidon A, Liu C. Whole Brain Susceptibility Mapping Using Compressed Sensing. Magn Reson Med. 2012;67:137–147. doi: 10.1002/mrm.23000. [DOI] [PMC free article] [PubMed] [Google Scholar]
- 53.Yushkevich PA, Piven J, Hazlett HC, Smith RG, Ho S, Gee JC, Gerig G. User- guided 3D active contour segmentation of anatomical structures: significantly improved efficiency and reliability. NeuroImage. 2006;31:1116–1128. doi: 10.1016/j.neuroimage.2006.01.015. [DOI] [PubMed] [Google Scholar]
- 54.Zhong K, Ernst T, Buchthal S, Speck O, Anderson L, Chang L. Phase contrast imaging in neonates. NeuroImage. 2011;55:1068–1072. doi: 10.1016/j.neuroimage.2010.11.086. [DOI] [PMC free article] [PubMed] [Google Scholar]