

Abstract
The bottlenecks of current chemotherapy in the treatment of colorectal cancer lie in the ineffectiveness of the existing anti-cancer small molecule drugs as well as the dose-limiting toxicity caused by the nonselective action on normal tissues by such drugs. To address these problems, we introduce a novel therapeutic strategy based on tumor targeting using a non-internalizing anti-carcinoembryonic antigen (CEA) monoclonal antibody (mAb) and intracellular delivery of the extremely potent yet cell-impermeable protein toxin gelonin via the aid of a cell-penetrating peptide (also termed as protein transduction domain; PTD). A chimeric TAT-gelonin fusion protein was genetically engineered, and it displayed remarkably enhanced anti-cancer activity against human colorectal cancer cells, with IC50 values being several orders of magnitude lower than the unmodified gelonin. On the other hand, a chemically synthesized conjugate of heparin and a murine anti-CEA mAb, T84.66 (termed T84.66-Hep) was found able to bind highly specifically to CEA over-expressing LS174T colorectal cancer cells. When mixing together, TAT-gelonin and T84.66-Hep could associate tightly and automatically through an electrostatic interaction between the cationic TAT and anionic heparin. In preliminary in vivo studies using LS174T s.c. xenograft tumor bearing mouse, selective and significantly augmented (58-fold) delivery of TAT-gelonin to the tumor target was observed, when compared with administration of TAT-gelonin alone. More importantly, efficacy studies also revealed that only the TAT-gelonin/T84.66-Hep complex yielded a significant inhibition of tumor growth (46%) without causing gelonin-induced systemic toxicity. Overall, this study suggested a generic strategy to effectively yet safely deliver potent PTD-modified protein toxins to the tumor.
Keywords: Gelonin, Protein transduction domain, Anti-CEA monoclonal antibody, Heparin, Cancer
1. Introduction
In the United States, colorectal cancer is the third most commonly diagnosed cancer (estimate of 140,000 new cases in 2014), as well as the second leading cause of cancer related deaths (estimate of 50,000 deaths in 2014) for both men and women [1]. Despite of certain successes in improving the survival rates of patients by early cancer detection and appropriate surgical intervention (average 67%), cure is yet elusive specifically for metastasized cancers which are unable to be removed by surgery (survival rate: 13 %) [1]. The difficulty to treat those metastasized cancers with currently approved small anticancer drugs mainly lies in the lack of targeting and low therapeutic efficacy of the drugs, as well as the toxic effects caused by the non-selective drug action on normal tissues [2, 3]. For example, 5-FU (or fluorouracil) is a pyrimidine analogue drug that has been prescribed for colorectal cancer therapy over 40 years [4]. Although 5-FU still remains the primary choice for treatment, its therapeutic effect is strictly limited (10 – 15% response rate and at most 6 – 8 months extension of life-span) [4, 5]. Thus, to overcome the low efficacy, 5-FU has frequently been used in combination with 1 or 2 other drugs. Although this combination therapy is more effective than treatment by 5-FU alone, its therapeutic outcome (20 month of extension of life span) is yet far from ideal and, further, the combination therapy frequently induces more severe toxicity [5, 6].
To overcome the therapeutic limitation of currently existing small anti-cancer drugs, there has been a rising interest on the use of macromolecular drugs, such as proteins and genes, which possess unmatched therapeutic efficiencies as well as repetitive reaction mechanisms [7-9]. A typical example of such macromolecular drugs is the plant-derived protein toxin, gelonin, which is a 30 kDa size glycoprotein first derived from the seeds of Gelonium multiflorum. Gelonin is a member of N-glycosidase family, and it inhibits protein synthesis via the cleavage of a single adenine residue (A4324) in the 28S ribosomal RNA [10]. The potency of gelonin to inhibit protein translation is so high that even a single gelonin molecule, assuming to be able to access the target ribosomes, can kill one tumor cell [11]. Nevertheless, despite of the exceptional potency of gelonin, its clinical translation yet remains a formidable challenge due to its poor cellular uptake [11, 12].
The discovery of potent protein transduction domains (PTD) has shed light of finally overcoming the challenge of the cell membrane barrier [13]. Taking TAT as an example, it is an 11-mer basic peptide derived from an HIV viral protein and has been demonstrated both in vitro and in vivo for its ability to translocate attached cargos (e.g., proteins, genes, nanoparticles, etc.) into almost all types of organ cells including the brain [14, 15]. However, this potent cell-penetrating ability of PTD has also been related as a double-edged sword, because of the nonselective nature of PTD-mediated cell transduction. Without proper regulation, unwanted toxic side effects will inadvertently occur, due to internalization of the PTD-drug into normal tissues [13, 16].
To date, various approaches based on different drug carriers (e.g., antibodies, nanoparticles, tumor homing peptides or small molecule ligands) have been attempted in the pursuit of a safer way to direct PTD-modified drugs to only the diseased cells [13, 16]. Specifically when it comes to cancer therapy, monoclonal antibodies (mAb) have been recognized as one of the most attractive targeting vehicles, due to their selective binding affinity to specific antigens that are over-expressed on certain tumor cell surfaces [17, 18]. A typical example of those tumor associated antigens is the carcinoembryonic antigen (CEA) which is a GPI-linked highly glycosylated cell surface protein (MW: ~ 200 kDa) first isolated from human colon cancer extracts. The CEA was reported to be over-expressed in various human adenocarcinomas including colon, ovarian, lung, breast and pancreatic cancers [19, 20], while it was minimally expressed in normal tissues (e.g., columnar epithelial cells and goblet cells in the colon) [20]. Due to this distinctive expression profile, CEA has been recognized as a highly attractive target for drug delivery [21-23].
In this research, we proposed a novel strategy to achieve effective yet safe colorectal cancer therapy by linking a PTD-modified gelonin toxin to a heparin-conjugated anti-CEA mAb (i.e. T84.66) via reversible electrostatic interaction (Fig. 1). Here, we reported the successful synthesis of a recombinant PTD-fused chimeric toxin, TAT-gelonin, and a heparin-conjugated T84.66 anti-CEA mAb (i.e. T84.66-Hep). In vitro characterization displayed a high retention of the anti-cancer activity of TAT-gelonin as well as the CEA binding affinity of T84.66-Hep. Preliminary and proof-of-concept animal studies were conducted using a relevant LS174T s.c. xenograft tumor mouse model to demonstrate the feasibility, utility, efficacy and the systemic toxicity of this delivery system in treating colorectal cancer.
Figure 1.
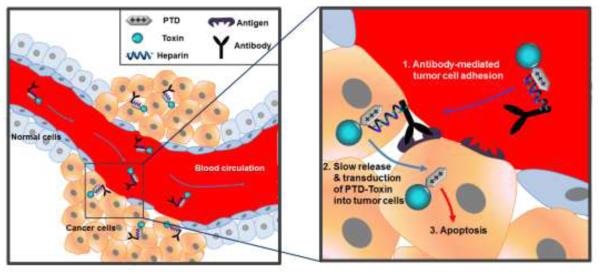
Scheme of the antibody-based targeting strategy for selective delivery of PTD-modified toxins to tumor cells. When antibody-heparin conjugate and PTD-modified toxin are mixed together, they automatically form a strong yet reversible complex via electrostatic interaction between anionic heparin and cationic PTD. Following administration to the blood circulation, the complexes are targeted to tumor mediated by the antibody that specifically binds to antigens overexpressed on the tumor cells. Once targeted, slowly released PTD-modified toxins from the antibody-heparin conjugate counterpart internalizes into tumor cells via PTD-mediated transduction, which eventually results in apoptosis of the tumor cells.
2. Materials and methods
2.1. Materials
Carbenicillin and isopropyl-β-thiogalactopyranoside (IPTG) were purchased from Fisher Scientific (Pittsburg, PA). Heparin sulfate and rhodamine B isothiocyanate (TRITC), Traut’s reagent (2-iminothiolane), MES (2-(N-morpholino) ethanesulfonic acid), EDC (1-Ethyl-3-[3-dimethylaminopropyl] carbodiimide Hydrochloride), goat anti-mouse-IgG (Fc specific)-alkaline phosphatase, rat plasma and nonspecific murine IgG were purchased from Sigma-Aldrich (St. Louis, MO). Competent Escherichia Coli (E. coli) strains (BL21star (DE3)), AcTEV™ protease, PBS (pH 7.4), Dulbecco’s Modified Eagle Medium (DMEM), Hybridoma serum free medium (SFM), fetal bovine serum albumin (FBS) were purchased from Invitrogen (Carlsbad, CA). One-step PNPP, Dylight 679-C5 and Dylight 775-B4 were purchased from Thermo Scientific (Rockford, IL). Polyethylene glycol (NH2-PEG-MAL; 3.5 kDa) was purchased from JenKem Technology USA Inc. (Allen, TX). Recombinant CEA (rCEA) was purchased from R&D SYSTEMS (Minneapolis, MN). Restriction endonucleases (BamHI & XhoI) were purchased from New England Biolabs (Ipswich, MA). The pET28a-Gel vector for the expression of recombinant gelonin was a kindly gift from Dr. Wolfgang. E. Trommer (TU Kaiserslautern, Germany) [24].
2.2. Synthesis of chimeric TAT-gelonin fusion protein
2.2.1. Construction of TAT-gelonin expression vector (pET-TAT-Gel)
Full length of TAT-gelonin gene (810 bp) was constructed by PCR using pET-Gel vector (pET28a-Gel) as the template. The PCR primers (NT-forward & NT-backward) are shown in Table S1 (see online supporting information). After reaction, the PCR product was purified by 1% agarose gel electrophoresis and inserted into a pEXP-5-NT/TOPO vector using the vendor’s protocol (Invitrogen, Carlsbad, CA). The pET-TAT-Gel vector (pET21a-TRX-TAT-Gel) designed for co-expression of TAT-gelonin with a thioredoxin-6×His tag (i.e., TRX-TAT-gelonin) was prepared via 3-step sequential PCR reactions using the prepared pEXP-5-NT/TOPO-Gel vector as the initial template. All the primers (pET-forward 1-3 and pET-backward 1-3) used for these PCR reactions are also summarized in Table S1. The final PCR product (5′-BamHI-6×His-TEVp-TAT-gelonin-XhoI-3′) encompassing the codons that sequentially encode a BamHI cleavage site, a 6×His tag, a TEV protease cleavable peptide (TEVp), TAT-gelonin, and an XhoI cleavage site was double digested (BamHI & XhoI), purified by 1% agarose gel electrophoresis, and then inserted into a pET21a-TRX vector (ProMab Biotechnologies, Inc., Richmond, CA) containing thioredoxin (TRX) gene. The constructed pET-TAT-Gel vector was submitted for DNA sequencing analysis.
2.2.2. Expression and purification of TAT-gelonin
For production of TAT-gelonin, a single colony of BL21 (DE3) E. coli transformed with pET-TAT-Gel was picked and inoculated into 40 mL of LB medium. The starter culture was incubated for overnight at 37°C with shaking at 250 rpm and then diluted to 1 L fresh LB medium. The large (1L) culture was incubated under the same condition as above, until the optical density at 600 nm reached 1. The expression of TAT-gelonin was induced by addition of IPTG (to final 0.5 mM). The culture was further incubated under the same condition for 6 h, and then E. coli cells were harvested by centrifugation at 4000 rpm for 20 min. The cells were re-dispersed in 20 mM PBS (300 mM NaCl, pH 7), lysed by sonication (4 × 30 s with 50% output on ice) and, after centrifugation at 15,000 rpm for 30 min, the supernatant fraction which contained the soluble TRX-TAT-gelonin was collected and loaded onto Ni-NTA resins (HisPure® Ni-NTA resin, Bio-Rad Laboratories, Hercules, CA). After incubation for 2 h at 4°C, the resins were washed with 20 mM PBS (300 mM NaCl, pH 7), and TRX-TAT-gelonin was eluted with the elution buffer (20 mM PBS, 300 mM NaCl, 400 mM imidazole, pH 7). For removal of the fusion tag (thioredoxin-6×His), TRX-TAT-gelonin was incubated with TEV protease (AcTEV™ protease), and TAT-gelonin was acquired after heparin column purification (HiTrap Heparin HP, GE Healthcare Bio-Sciences, Pittsburgh, PA) by salt gradient elution (0 to 2 M NaCl at a rate of 0.02M/min, flow rate: 1 mL/min). The final TAT-gelonin product was kept at −80°C until further use. Recombinant gelonin was expressed from BL21 (DE3) E. coli strain transformed with pET-Gel and purified following the identical procedures described by Shin et al [12].
2.2.3. Protein Assays
Expression of soluble TRX-TAT-gelonin was examined by SDS-PAGE and western blot analysis of the supernatants of pET-TAT-Gel transformed E. coli cell lysates, and further purification steps of TAT-gelonin were monitored by SDS-PAGE on 10% Tris-HCl gel. The quantity of final TAT-gelonin product was determined by BCA assay, and the purity was assessed by densitometry analysis of the observed band relevant to the TAT-gelonin (31 kDa) from the SDS-PAGE results using imageJ software (National Institutes of Health, Bethesda, MD).
2.3. Chemical conjugation and purification of T84.66-heparin (T84.66-Hep)
T84.66, a murine anti-CEA monoclonal antibody (mAb), was produced from hybridoma cells (American Type Culture Collection (ATCC) # HB-8747, Manassas, VA) cultured in serum free media (Hybridoma SFM, Invitrogen), and purified by using protein G resins (Protein G Sepharose™ 4 Fast Flow, GE Healthcare Biosciences, Pittsburg, PA) following the procedures described by Urva et al [25]. The prepared T84.66 was conjugated with heparin via a thioether bond utilizing a heterobifunctional polyethylene glycol (NH2-PEG-MAL, 3.5 kDa) as the cross-linker. The conjugation scheme is depicted in Fig. 2. T84.66 was derivatized with thiol groups by mixing the T84.66 (10 mg/mL in 50 mM HEPES buffer, 5 mM EDTA, pH 8) with 10-fold molar excess of Traut’s reagent and incubating for 1 h at room temperature (RT). The unreacted Traut’s reagent was removed by ultrafiltration using a centrifugal filtration device (molecular weight cut off: 10 kDa, Amicon® Centricon® Centrifugal Filter Devices, Millipore Corporation, Billerica, MA), and the generated thiol groups were quantified by Ellman’s assay [26]. To introduce thiol reactive maleimide groups to heparin, heparin (40 mg/mL in 0.1 M MES buffer 1 mL, pH 5) was mixed with 5-fold molar excess of NH2-PEG-MAL (40 mg/mL in 0.1 M MES buffer 1 mL) and EDC (40 mg/mL in 0.1 M MES buffer 0.5 mL) and then incubated for 2 h at RT. After incubation, the reactant was loaded onto an anion exchange column (Bio-Scale™ Mini UNOsphere™ Q Cartridge, Bio-Rad Laboratories, Hercules, CA) connected to HPLC (Alltech 526 HPLC pump, Deerfield, IL), and the heparin-PEG-MAL was eluted with salt gradient (0 to 2 M NaCl at a rate of 0.02M/min, flow rate: 1 mL/min). The amounts of heparin and PEG contained in the eluent were quantified by azure A [27] and barium iodide assay [28], respectively. The prepared heparin-PEG-MAL was slowly added to thiol-activated T84.66 (T84.66-SH) solution, and the conjugation reaction was carried out at RT for overnight. After reaction, T84.66-Hep was purified from unreacted T84.66-SH on the anion exchange column with elution by a salt gradient (0 to 2 M NaCl at a rate of 0.02M/min, flow rate: 1 mL/min, detection: 280 nm). Separated peak fractions were collected and loaded onto a 10% SDS-PAGE gel for identification. In addition, the amounts of both T84.66 and heparin contained in each peak fraction were quantified by measuring the optical density at 280 nm (OD280) and azure A assay [27], respectively. Any unreacted heparin and heparin-PEG-MAL were further removed from T84.66-Hep by ultrafiltration (molecular weight cut off: 100 kDa). Nonspecific mouse IgG-heparin conjugate (nIgG-Hep) was also prepared using the identical method described for synthesis of T84.66-Hep.
Figure 2.
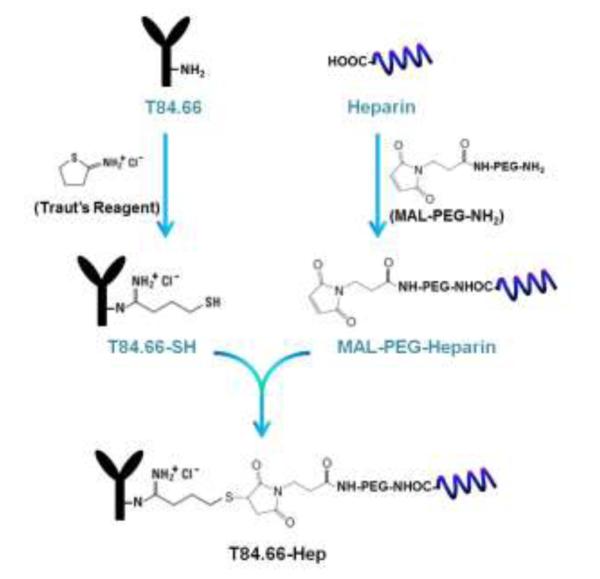
Scheme of the chemical synthesis of T84.66-Hep using a heterobifunctional PEG as the cross-linker. (T84.66-Hep: T84.66-heparin conjugate)
2.4. Synthesis of T84.66-gelonin chemical conjugate
T84.66-gelonin conjugate was synthesized via a disulfide bond utilizing a PEG (NHS-PEG-OPSS, 2 kDa) cross-linker. T84.66 was conjugated with the PEG by mixing T84.66 (10 mg/mL in 20 mM PBS, pH 7) with 5-fold molar excess of NHS-PEG-OPSS and incubation for 3 h at RT. The unreacted PEG was removed by ultrafiltration (MWCO: 10 kDa), and the OPSS groups were quantified by P2T assay. To introduce thiol groups to gelonin, gelonin (5 mg/mL in 20 mM PBS buffer, 50 mM triethanolamine, 5 mM EDTA, pH 8.5) was mixed with 5-fold molar excess of Traut’s reagent (2-Iminothiolane) and incubated for 1 h at RT. After incubation, unreacted excessive Traut’s reagent was removed by ultrafiltration (MWCO: 10 kDa), and the thiol groups generated on gelonin were quantified by Ellman’s assay. The prepared T84.66-PEG-OPSS and thiol-activated gelonin (gelonin-SH) were mixed together by a 1:5 molar ratio and incubated for 4 h at 4°C. After incubation, the T84.66-gelonin was purified from unreacted T84.66-PEG-OPSS by using a cation exchange column (HiTrap CM-FF, GE Healthcare Bio-Sciences, Pittsburgh, PA) with elution by a salt gradient (0 to 2 M NaCl at a rate of 0.02 M/min, flow rate: 1 mL/min, detection: 280 nm). Any unreacted gelonin-SH contained in the T84.66-gelonin peak fraction was further removed from T84.66-gelonin by ultrafiltration (MWCO: 100 kDa).
2.5. Cell culture
LS174T and HCT116 human adenocarcinoma cells, MDCK (Madin-Darby canine kidney) and 293 HEK (human embryonic kidney) cells were purchased from American Type Culture Collection (ATCC) (Manassas, VA). The cells were cultured in DMEM with 2 mM L-glutamine, high glucose, 1% (v/v) penicillin-streptomycin, and 10% FBS, and maintained in a humidified atmosphere of 5% CO2 at 37°C.
2.6. Cytocidal activity of TAT-gelonin
LS174T, HCT116, MDCK and 293 HEK cells were separately seeded onto 96 well plates (5×10³ cells/well) and incubated for overnight in complete medium containing 10% FBS. When the cells were attached to the bottom of the plates, they were treated with varied concentrations of either gelonin or TAT-gelonin (10−5 – 10−11 M) and incubated for 72 h at 37°C in a humidified atmosphere with 5% CO2. After incubation, the cells were washed three times with PBS and the relative cell viability was measured by using XTT assay following the vendor’s protocol (Roche Applied Science, Indianapolis, IN).
2.7. In vitro characterization of T84.66-Hep
2.7.1. Specific cell binding
Specific binding of T84.66-Hep to CEA overexpressed cancer cells (e.g. LS174T) was examined by using fluorescence microscopy. For imaging, T84.66-Hep was labeled with a fluorescence dye, rhodamine isothiocyanate (TRITC), by mixing T84.66-Hep (5 mg/mL in 50 mM sodium bicarbonate buffer, pH 9.3) with 5-fold molar excess of TRITC and incubation at RT for 2 h. The unreacted TRITC was removed by using dye removal resins (Bio-Rad Laboratories, Hercules, CA).
CEA high expression (LS174T) and low expression (HCT116) cells were seeded onto 24-well plates (5×10⁴ cells/well) and incubated for overnight in complete medium with 10% FBS. When the cells were attached to the bottom of the plates, TRITC-labeled T84.66-Hep (final concentration of 5 μM) was incubated with the cells for 1 h at 37°C in a humidified atmosphere with 5% CO2. In addition, a separate group of LS174T cells were first incubated with 10-fold molar excess of unlabeled T84.66 for 1 h and then incubated with the TRITC-labeled T84.66-Hep for 1 h. After incubation, cells were washed with PBS, and the images of the cells were acquired by Nikon TE2000S epifluorescence microscope with a 20× objective (Nikon Instruments Inc., Melville, NY) and analyzed by Metamorph software (Molecular Devices Corporation, Sunnyvale, CA).
2.7.2. ELISA (Enzyme-linked immunosorbent assay)
The relative binding affinity of T84.66-Hep to CEA compared with that of unmodified T84.66 was examined by ELISA following the procedures described by Urva et al. with modification [25]. Briefly, 96-well plates (96 well EIA/RIA clear flat bottom polystyrene high bind microplate, Corning Inc., Tewksbury, MA) were coated with recombinant CEA (rCEA, 400 ng/mL in 20 mM phosphate buffer, 250 μL/well) by incubation at 4°C for overnight. After incubation, the unbound rCEA was removed, and the wells were washed three times with PB-Tween (20 mM phosphate buffer with 0.05% Tween 20) and twice with MQ water (EMD Millipore, Billerica, MA). After wash, varied concentrations (0, 10, 25, 50, 75 and 100 ng/mL) of T84.66 and T84.66-Hep were added to the wells (200 μL/well) and incubated for 2 h at RT. The wells were then washed, and goat anti-mouse-IgG (Fc specific)-alkaline phosphatase (1:1000 in PB-Tween, 100 μL/well, Sigma-Aldrich) was added to the wells and incubated for 2 h at RT. After wash, 100 μL of p-nitrophenyl phosphate (1-step PNPP, Thermo Scientific, Rockford, IL) was added to the wells and the change in absorbance at 405 nm was monitored by a microplate reader (BioTek Synergy, BioTek co., Winooski, VT) using a kinetic mode. The absorbance values of the wells were measured every minute for total 6 minutes, and the initial rates (slope; dA/dt) were calculated by linear regression using Prism software (Prism version 5.0, GraphPad, San Diego, CA).
2.8. Physical Characterization of TAT-gelonin/T84.66-Hep complex
Physical characteristics of the TAT-gelonin/T84.66-Hep complex were examined by dynamic light scattering (DLS) and binding/release studies. The hydrodynamic size and zeta potential of the complex were measured by using a Nano ZS90 particle-sizer (Malvern, Worcestershire, UK), and the size stability of the complex was assessed by measuring the hydrodynamic size of the complex along a time course (0, 1, 4, 8, 24, 48 and 72 h) during incubation in plasma. To assess the capacity and efficiency of TAT-gelonin binding with T84.66-Hep, T84.66-Hep was biotinylated and immobilized to neutravidin-coated resins (avg. 1 mg of biotinylated T84.66-Hep/500 μL of resins), and then incubated with different amounts of Dylight 679-C5 (a.k.a. C5)-labeled TAT-gelonin (100, 200, 300, 500, 750, 1000 and 1250 mg). After incubation for 1 h at RT, the resins were centrifuged, and the fluorescence intensities of the supernatants were measured and used to quantify the unbound TAT-gelonin-C5 content. The binding TAT-gelonin content was calculated by subtracting the unbound TAT-gelonin-C5 content from the fed amount, and the binding efficiency (%) was by dividing the binding TAT-gelonin content by the fed amount and then multiplying it by 100. The plasma release of TAT-gelonin from T84.66-Hep was examined by incubation of the TAT-gelonin-C5/T84.66-Hep-bound neutravidin resins with rat plasma and quantification of the released TAT-gelonin-C5 along the time. At intended time points (0, 2, 6, 12, 24, 48 and 72 h), the complex-bound resins were centrifuged (1000 rpm for 3 min), and the fluorescence intensities of the supernatants were measured to quantify the released TAT-gelonin-C5 content. The bound TAT-gelonin-C5 was calculated by subtracting the amount of released TAT-gelonin-C5 from the total loaded TAT-gelonin-C5 onto the resins.
2.9. Analysis of the cellular behavior of TAT-gelonin/T84.66-Hep complex
LS174T cells were seeded onto Nunc™ Lab-Tek™ Chambered Coverglass (Thermo Scientific) at a density of 104 cells per well and incubated at 37°C. When the cells were attached to the bottom of the chambers, TRITC-labeled gelonin, TRITC labeled-TAT-gelonin, TRITC labeled-T84.66-gelonin conjugate and TRITC labeled-TAT-gelonin/Dylight 488 labeled-T84.66-Hep complex (prepared by 2:1 molar ratio) were separately added to the wells and then incubated at 37°C. Gelonin and TAT-gelonin were incubated with cells for 4 h, and T84.66-gelonin conjugate and TAT-gelonin/T84.66-Hep complex were incubated with cells up to 48 h. After incubation, the cells were washed with PBS, and the images of the live cells were acquired by a Nikon A1 confocal laser microscope (Nikon Instruments Inc., Melville, NY) with a Plan Apo 60× 1.4 NA oil immersion lens and a diode based laser system under two fluorescent channels (excitation/emission wavelength for the green channel: 488 nm/525 ± 50 nm, the red channel: 561 nm/596 ± 50 nm). Images were analyzed with the NIS-Elements 3.2 confocal software (Nikon Instruments Inc., Melville, NY).
2.10. Animal studies
Animal experiments were conducted according to the protocol approved by the University of Michigan Committee on Use and Care of Animals (UCUCA; protocol No. 08945-3).
2.10.1. Determination of maximum tolerable dose (MTD)
The MTD of TAT-gelonin and TAT-gelonin/T84.66-Hep complex were tested on C57BL/6 mice (body weight: 26 - 29 g, 6 weeks old, Charles Rivers Laboratories). The MTD was defined as the maximum drug dose administered once bolus to non-tumor bearing mice without causing mortality within 24 h period of post drug administration. Mice were administered with escalating dose of either TAT-gelonin (dose: 9 mg/kg, 18 mg/kg, 36 mg/kg or 72 mg/kg) or TAT-gelonin/T84.66-Hep complex (dose: TAT-gelonin 9 mg/kg /T84.66-Hep 20 mg/kg, TAT-gelonin 18 mg/kg/T84.66-Hep 40 mg/kg or TAT-gelonin 36 mg/kg/T84.66-Hep 80 mg/kg) via tail vein injection (N = 3), and the mortality of mice was monitored. TAT-gelonin/T84.66-Hep complex was prepared by mixing TAT-gelonin with T84.66-Hep and incubation at RT for 30 min.
2.10.2. LS174T s.c. xenograft tumor mouse model
Male athymic nude mice (body weight: 21 - 25 g; Charles Rivers Laboratories, Raleigh, NC) were housed in sterile animal facilities and fed by standard chow diet. At day 0 (three days after arrival), LS174T cells (5×10⁶ cells/mouse) were injected (s.c.) into the left flank of mice. Specifically for the mice used for live animal imaging, after tumor implantation, they were fed by special alfalfa-free diet (AIN-76A rodent diet, gamma-irradiated, Research Diets, Inc, New Brunswick, NJ) to reduce the background autofluorescence [29]. Tumor size was measured using a vernier caliper, and the volume was calculated by using the formula of V (mm3) = (w2 × l) / 2, where V is the volume, w is the width and l is the length of the tumor.
2.10.3. Live animal imaging
T84.66-Hep-mediated tumor targeting of TAT-gelonin was examined using live animal imaging technique. For simultaneous monitoring of the behavior of both the components in a same mouse, TAT-gelonin and T84.66-Hep were labeled with different near infrared (NIR) dyes, Dylight 775-B4 (abbreviated B4) and Dylight 679-C5 (abbreviated C5), respectively, following the vendor’s protocol (Thermo Scientific, Rockford, IL).
When the average tumor size reached 200 mm3, LS174T s.c. xenograft tumor bearing mice were randomly divided into 4 groups (N = 5) and administered with either: 1) PBS, 2) TAT-gelonin-B4 (135 μg of B4-labeled TAT-gelonin), 3) TAT-gelonin-B4/nIgG-Hep complex (135 μg of TAT-gelonin-B4/400 μg of nIgG-Hep) or 4) TAT-gelonin-B4/T84.66-Hep-C5 complex (135 μg of TAT-gelonin-B4/400 μg of T84.66-Hep-C5). Both the TAT-gelonin-B4/nIgG-Hep and TAT-gelonin-B4/T84.66-Hep-C5 complexes were prepared by mixing the two components and incubation at 4°C for 1 h. The test compounds were administered via tail vein injection, and the fluorescent images of mice were acquired at 5 min, 30 min, 1h, 2 h, 6 h, 24 h, 48 h, 72 h, 96 h and 120 h after injection of the test compounds by using IVIS® spectrum imaging system (Xenogen, Alameda, CA). Apart from the live imaging, representative images of the tumors dissected from mice euthanized 6 h after administration of the test compounds were also acquired by the IVIS® spectrum imaging system.
2.10.4. Biodistribution
LS174T s.c. xenograft tumor bearing mice were administered with either TAT-gelonin-B4 (135 μg), TAT-gelonin-B4/nIgG-Hep (135 μg/400 μg) or TAT-gelonin-B4/T84.66-Hep (135 μg/400 μg) via tail vein injection, when the average tumor size reached 500 mm3. At 2 h and 24 h post-administration, the mice were euthanized, and the major organs (e.g., tumor, heart, liver, spleen and kidney) were harvested. The fluorescence intensities of the organs were acquired by using IVIS® spectrum imaging system (Xenogen, Alameda, CA).
2.10.5. Imaging analysis
Mice images were collected using ICG filter (Ex/Em: 745 nm/800 nm; for detection of TAT-gelonin-B4) and Cy5.5 filter (Ex/Em: 675 nm/720 nm; for detection of T84.66-Hep-C5) with identical illumination settings, such as exposure time (1 s), binning (8), f/stop (2 for TAT-gelonin-B4 and 4 for T84.66-Hep-C5) and fields of view (25 cm × 25 cm). The images were analyzed with Living Image 2.5 software (Xenogen, Alameda, CA), and signals were normalized to photon per second per centimeter squared per steradian (p/s/cm2/sr). For the live animal imaging analysis, tumors were designated as the regions of interest (ROIs), and the mean fluorescence intensities (M.F.I.s) were quantified by measuring the fluorescence intensities of ROIs and subtracting the fluorescence intensity of the corresponding ROI on the control blank mice. The M.F.I.s that correspond to the amounts of TAT-gelonin-B4 in the tumors were plotted as a function of time, and the area under the curve (AUC) for each plot was calculated using Prism software (Prism version 5.0, GraphPad, San Diego, CA). For the biodistribution analysis, the M.F.I.s of the dissected major organs were calculated by designating the organs as the ROIs and subtracting the fluorescence intensities of the corresponding ROIs on the control blank mouse. The M.F.I.s were further normalized by the weight of the organs.
2.10.6. Efficacy and systemic toxicity
Three days after tumor implantation (at day 3) when average tumor size reached 40 mm3, LS174T s.c. xenograft tumor mice were randomly divided into 5 groups and administered with either: 1) PBS, 2) T84.66-Hep (21 mg/kg), 3) TAT-gelonin (7 mg/kg), 4) T84.66-gelonin conjugate (7 mg/kg as gelonin) or 5) TAT-gelonin/T84.66-Hep complex (7 mg/kg TAT-gelonin/21 mg/kg T84.66-Hep). The mice were treated three times with the above recipe at day 3, 6 and 9 via tail vein injection. The tumor size and body weight of the mice were monitored daily.
2.11. Statistical analysis
All data were expressed as mean ± standard deviation (mean ± SD). Statistical significant differences among groups were compared by using either 1-way ANOVA (with Tukey’s multiple comparison test as post hoc test) or Student’s t-test (Prism version 5.0, GraphPad, San Diego, CA). Results yielding p < 0.05 were considered statistically significant.
3. Results
3.1. Expression and purification of chimieric TAT-gelonin fusion protein
Thioredoxin-6×His tagged TAT-gelonin (a.k.a. TRX-TAT-gelonin) was successfully expressed as a soluble protein from E. coli. As shown in Fig. 3, the TRX-TAT-gelonin purified by Ni-NTA chromatography was identified from the SDS-PAGE gel by the presence of an intense band at 44 kDa, and further confirmed by specific recognition of the band by an anti-His antibody (data not shown). TAT-gelonin was acquired after removal of the thioredoxin-6×His tag by incubation with TEV protease (AcTEV™ protease, Invitrogen) and subsequent purification using a heparin column. The final TAT-gelonin product, confirmed by SDS-PAGE analysis (Fig. 3), had a yield of 2.7 mg per L culture, and a purity measured by densitometry analysis using the imageJ software of over 95%.
Figure 3.
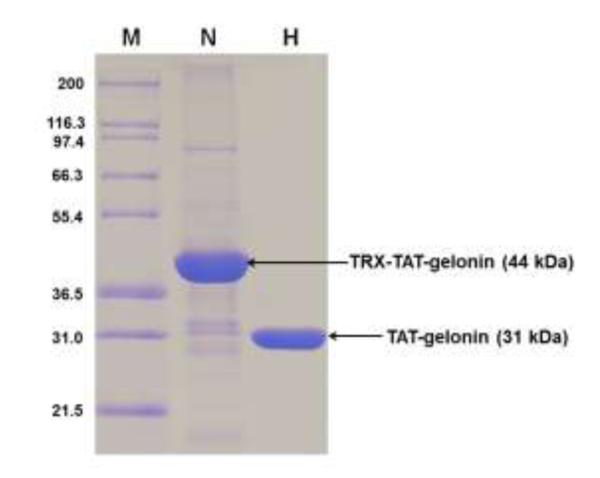
SDS-PAGE results for TRX-TAT-gelonin and TAT-gelonin. Lane M is a marker of the protein molecular weight standard (Invitrogen), Lane N is the purified TRX-TAT-gelonin by using the Ni-NTA chromatography, and Lane H is the final TAT-gelonin product after removal of the thioredoxin-6×His tag from TRX-TAT-gelonin and subsequent purification with heparin chromatography. (TRX-TAT-gelonin: thioredoxin-6×His tagged TAT-gelonin)
3.2. Preparation and purification of T84.66-heparin conjugate (T84.66-Hep)
T84.66 was successfully expressed and purified by using protein G resins. The average yield of T84.66 based on measuring the optical density at 280 nm (OD280) was 2 mg per L culture and the purity based on densitometry analysis using imageJ software was over 95% (Fig. S1; see online supporting information). The prepared T84.66 was conjugated to heparin via a thioether bond using a heterobifunctional PEG (NH2-PEG-MAL, 3.5 kDa) as the cross-linker (Fig. 2). Briefly, T84.66 was first derivatized with Traut’s reagent, resulting in the introduction of approximately 5 thiols per antibody based on the Ellman’s assay. At the same time, a thiol-active maleimide group was introduced to the heparin molecule via conjugation of NH2-PEG MAL using EDC chemistry. The heparin-PEG-MAL conjugates were purified from unreacted PEG by anion exchange chromatography. The average heparin-to-PEG molar ratio was determined to be 1:0.4, based on the Azure A (for quantification of heparin) and barium iodide (for quantification of PEG) assay results. After preparation, T84.66-SH and heparin-PEG-MAL were mixed together and incubated at RT for overnight. The T84.66-Hep product was then purified from unreacted T84.66-SH by anion exchange chromatography using a NaCl salt gradient. As shown in Fig. 4, three peaks (F#1; retention time: 3 min, F#2; retention time: 28 min, F#3; retention time: 50 min) were observed and found to elute at no salt, 0.36 – 0.5 M NaCl and 0.8 – 1.8 M NaCl, respectively. Based on the quantification of the amounts of T84.66 and heparin in these peaks, F#1 was confirmed to contain unreacted T84.66-SH only; as evidenced by the absence of heparin, while F#2 and F#3 consisted of a mixture of T84.66-Hep, unreacted heparin, and heparin-PEG-MAL. The presence of T84.66-Hep conjugates in F#2 & F#3 were further confirmed by SDS-PAGE analysis (data not shown). The elution of T84.66-Hep from the anion exchange column as broad and even separate (F#2 & F#3) peaks are likely explained by the heterogeneity in the size of the commercial heparin (Sigma Aldrich) as well as the conjugation ratios between T84.66 and heparin, resulting in synthesis of T84.66-Hep conjugates with varied binding affinity to anion exchange resins. Given the favorable stronger binding affinity of T84.66-Hep contained in F#3 to anion exchange resins compared with that in F#2, T84.66-Hep in F#3 was chosen for further studies and purified from both the unreacted heparin and heparin-PEG-MAL by ultrafiltration. The final T84.66-Hep product had a yield of 25% and a T84.66-to-heparin molar ratio of 1:3.
Figure 4.
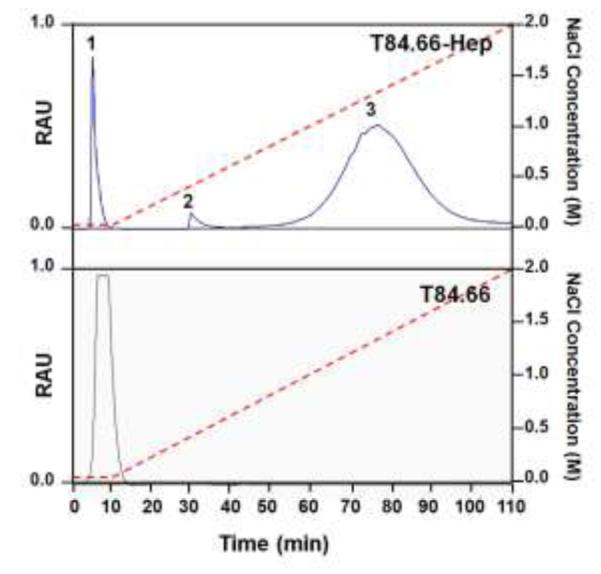
Elution profiles of T84.66-Hep and T84.66 from anion exchange column. While a single peak (eluted at 0 M NaCl with retention time of 2 min) was observed when T84.66 was loaded to the anion exchange column and a NaCl salt gradient was applied from 0 to 2 M (red dotted line), when the reactants of T84.66 and heparin conjugation were loaded onto anion exchange column, three major fractions labeled as Peaks 1 - 3 eluted at 0, 0.36 - 0.5 M and 0.8 –1.8 M NaCl (with retention times of 2, 28 and 50 min, respectively). (RAU: relative arbitrary unit indicating relative intensity of the absorbance at 280 nm, T84.66-Hep: T84.66-heparin conjugate)
3.3. Synthesis of T84.66-gelonin chemical conjugate
T84.66 and gelonin were successfully conjugated via a disulfide bond. For the conjugation reaction, T84.66 was conjugated to a heterobifunctional PEG (NHS-PEG-OPSS; 2 kDa), and gelonin was thiol-activated by using Traut’s reagent. According to the P2T assay results, each T84.66 molecule was conjugated with average of 3 PEGs in the purified T84.66-PEG-OPSS, and approximately 5 thiol groups were introduced to gelonin based on Ellman’s assay. The conjugation reaction was carried out by mixing T84.66-PEG-OPSS with thiol activated-gelonin (gelonin-SH) by 1:5 molar ratio and incubation for 4 h at 4°C. The T84.66-gelonin was purified from unreacted T84.66-PEG-OPSS by cation exchange chromatography with a NaCl salt gradient, and the unreacted gelonin-SH was further removed by ultrafiltration (MWCO: 100 kDa). The final T84.66-gelonin product had a yield of 17% (1.7 mg conjugated T84.66 from initially 10 mg T84.66) and a T84.66-to-gelonin molar ratio of 1:1.3 determined by SDS-PAGE (data not shown).
3.4. Cytocidal activity of TAT-gelonin
Cytocidal activity of TAT-gelonin was assessed against human colon cancer cells (LS174T and HCT116) and noncancerous cells (MDCK and 293 HEK) by using the XTT assay. As shown in Fig. 5 and also Table 1, in all cell lines tested, gelonin displayed cytotoxicity only at above micro-molar concentrations; presumably by internalization via fluid phase pinocytosis [30]. However, in sharp contrast, TAT-gelonin yielded significantly augmented cytotoxicity (229-fold for LS174T; 391-fold for HCT116; 93-fold for MDCK and 108-fold for 293 HEK) than gelonin, apparently due to indiscriminative and efficient TAT-mediated cell transduction and uptake. These results demonstrated the utility of PTD in improving the anti-cancer activity of the otherwise poorly internalizing protein toxins, shedding light of the potential of these protein drugs for clinical applications.
Figure 5.

Cytocidal activities of gelonin and TAT-gelonin against (A) LS174T (B) HCT116, (C) 293 HEK and (D) MDCK cell lines. Cells were plated onto 96 well plates (5 ×10³ cells/well) and the relative cytotoxicity was measured by using the XTT assay (N = 3). TAT-gelonin displayed significantly higher cytotoxicity against all of the tested cell lines than gelonin, . confirming the utility of PTD in improving the anti-cancer activity, while also demonstrating the toxicity related concerns for its clinical applications.
Table 1.
Summary for the cytotoxicity study results (IC50, nM) of gelonin and TAT-gelonin
| Cell Types |
LS174T a | HCT116 a | MDCK a | 293 HEK a |
|---|---|---|---|---|
| Gelonin | 5250 ± 754 | 5160 ± 1060 | 4190 ± 834 | 4610± 800 |
| TAT-gelonin | 22.9 ± 8.0*** | 13.2 ± 5.7** | 44.9 ± 13.2** | 42.7 ± 15.6*** |
IC50 values are displayed as nM. For all experiments, N = 3.
P < 0.01,
P < 0.001 by Student’s t-test. (TAT-gelonin: Chimeric TAT-gelonin fusion protein)
3.5. Specific binding of T84.66-Hep to carcinoembryonic antigen (CEA)
To examine the binding specificity and affinity of T84.66-Hep to CEA, we performed a cell binding assay and also the ELISA measurement. The cell binding assay was conducted with TRITC-labeled T84.66-Hep on human colon cancer cell lines with high CEA expression (LS174T) and low expression (HCT116). Fluorescence images of these cells are shown in Fig. 6A. As seen, selective binding of T84.66-Hep to LS174T cells as opposed to HCT116 cells was clearly observed; as strong fluorescence signal was visible only from the LS174T cells, but not the HCT116 cells. Under competitive condition, when the LS174T cells were incubated with 10-fold molar excess of unlabeled T84.66 (for 1 h) prior to their incubation with TRITC-labeled T84.66-Hep, only minimal fluorescence signal was observed; suggesting a complete blockage on the binding of TRITC-labeled T84.66-Hep to CEA through the action of T84.66. These results confirmed that selective binding of T84.66-Hep to the CEA-overexpressed LS174T cells is specifically mediated by interaction with CEA. The relative binding affinity of T84.66-Hep to CEA was evaluated via ELISA and compared with unmodified T84.66. As shown in Fig. 6B, at various T84.66 concentrations of 10, 25, 50, 75 and 100 ng/mL, the binding affinities of T84.66-Hep were about 72.9%, 68.8%, 64%, 68.6% and 71.5%, respectively, of those of intact T84.66, with an overall average of approximately 69.2% (± 3.4) of that of native T84.66. Overall, both the cell binding assay and ELISA results demonstrated that, after conjugation with heparin, T84.66 still maintained its specificity and affinity toward CEA, thus being capable of targeting CEA over-expressed cancer cells.
Figure 6.
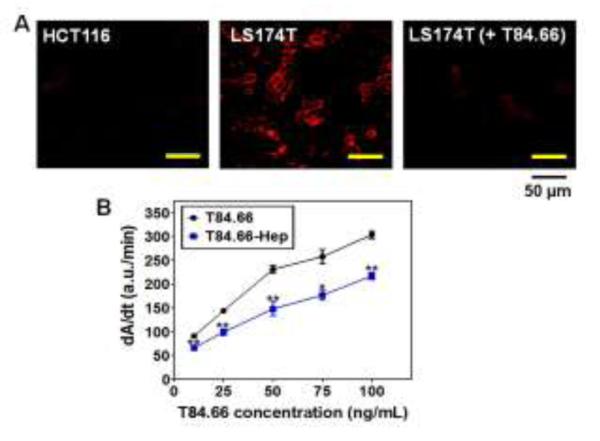
In vitro characterization of T84.66-Hep. (A) Fluorescent microscopic images of HCT116 (CEA low expression cell line; left) and LS174T (high expression cell line; middle) cells treated with TRITC-labeled T84.66-Hep, as well as LS174T cells (right) incubated with TRITC-labeled T84.66-Hep after pre-incubation with 10-fold molar excess of unlabeled T84.66. After incubation, cells were washed with PBS, and then the live cell images were acquired by a Nikon A1R-A1 confocal laser microscope with a 20×objective (Nikon). (B) ELISA results of T84.66 and T84.66-Hep against . 96-well plates were coated with recombinant CEA (rCEA). and after wash, incubated with varied concentrations (0, 25, 50, 75 and 100 μg/mL) of T84.66 and T84.66-Hep. After incubation, the wells were washed and then incubated with goat anti-mouse-IgG (Fc specific)-alkaline phosphatase. After washing, p-nitrophenyl phosphate was added to the wells and the change in absorbance at 405 nm was monitored, and the initial rates (dA/dt) for the antibodies were plotted. The statistical significant differences of the initial rates of T84.66 and those of T84.66-Hep were compared by Student’s t-test. *P < 0.05, **P < 0.01. (T84.66-Hep: T84.66-heparin chemical conjugate)
3.6. Physical characteristics of TAT-gelonin/T84.66-Hep complex
After synthesis and characterization of both TAT-gelonin and T84.66-Hep, TAT-gelonin/T84.66-Hep complex was prepared by a 2:1 molar ratio, and the physical properties were characterized in vitro. The average hydrodynamic size of the complex measured by dynamic light scattering (DLS) was 87.2 ± 9.5 nm, and the zeta potential was – 6.2 ± 4.3 mV. As shown in Fig. 7A, when this complex was incubated in rat plasma up to 72 h, no apparent aggregation was observed, and the size of the complex did not significantly change over time.
Figure 7.

Physical characterization of TAT-gelonin/T84.66-Hep complex. (A) Size stability in plasma. (B) TAT-gelonin’s binding capacity and efficiency to neutravidin resin-immobilized T84.66-Hep. (C) Release of TAT-gelonin from the immobilized T84.66-Hep. (T84.66-Hep: T84.66-heparin chemical conjugate)
To assess the binding capacity and efficiency of TAT-gelonin and T84.66-Hep, when biotinylated T84.66-Hep was immobilized to neutravidin-coated resins and incubated with different amounts of Dylight 679-C5 labeled-TAT-gelonin, the binding TAT-gelonin content increased up to 536 μg/mg T84.66-Hep with increasing fed amounts of TAT-gelonin and reached a plateau, while the binding efficiency was inversely decreased (Fig. 7B). Based on the results, it appeared that one molecule of T84.66-Hep could bind with maximum of 3.5 TAT-gelonin. As shown in Fig. 7C, when the TAT-gelonin-C5/T84.66-Hep loaded-resins were incubated with rat plasma, slow but steady release of TAT-gelonin-C5 was observed. After 72 h of incubation, 41% of the loaded TAT-gelonin-C5 was dissociated from the T84.66-Hep.
3.7. Analysis of cellular behavior of TAT-gelonin/T84.66-Hep complex
Cellular behavior of TAT-gelonin/T84.66-Hep was examined with LS174T cells by confocal microscopy. As shown in Fig. 8, after 4 h incubation, while gelonin (Fig. 8A) was little, if any detected from the cells, strong fluorescence signal was observed inside the cells incubated with TAT-gelonin (Fig. 8B); indicating rapid and efficient transduction of TAT-gelonin mediated by TAT. When compared with TAT-gelonin, T84.66-gelonin conjugate (Fig. 8C) was mainly observed from the cell membrane even after 48 h of incubation, and only a small portion of the conjugate appeared to internalize cells. In a sharp contrast, from the cells incubated with TAT-gelonin/T84.66-Hep complex, a significant enhance in the uptake of TAT-gelonin was observed with increasing incubation time (from 4 h to 24 and 48 h) (Fig. 8G, 8H and 8I, respectively). While TAT-gelonin slowly internalized, however, T84.66-Hep remained on the cell surface (Fig, 8D, 8E and 8F).
Figure 8.
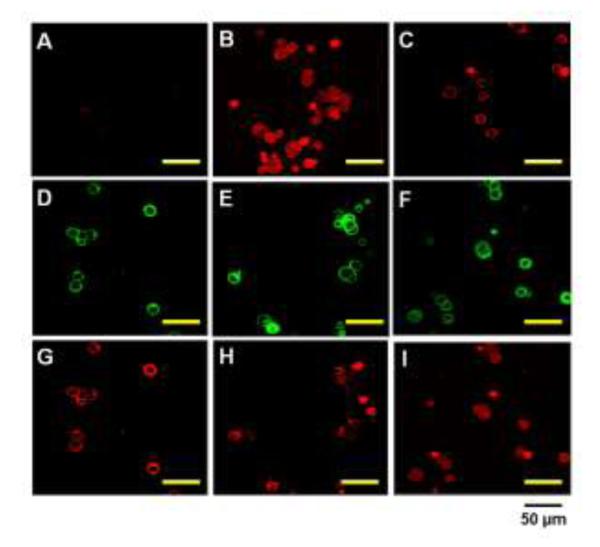
Confocal microscopic images of live LS174T cells after incubation with (A) TRITC-labeled gelonin, (B) TRITC-labeled TAT-gelonin, (C) TRITC-labeled T84.66-gelonin conjugate or (D - I) TRITC-labeled TAT-gelonin/Dylight 488-labeled T84.66-Hep complex. For the complex treated cells, images of both the T84.66-Hep and TAT-gelonin were simultaneously acquired after 4 h (D and G), 24 h (E and H) and 48 h (F and I) of incubation. While T84.66-Hep mainly remained on the cell surface (D – F), TAT-gelonin gradually internalized the cells (G – I).
3.8. Maximum tolerable dose (MTD)
The MTD, defined as the maximum drug dose administered to the non-tumor bearing mice as a bolus dose without causing death of the animal within 24 h period of post drug administration, was determined for both the TAT-gelonin and TAT-gelonin/T84.66-Hep complex using healthy C57BL/6 mice. The MTD for TAT-gelonin was estimated to be 9 mg/kg; as there was no death of the mice at doses lower than 9 mg/kg, but complete death of all mice being tested when the dose was raised to above 18 mg/kg (N = 3). In case of TAT-gelonin/T84.66-Hep, the MTD was left undetermined after no death was observed in mice when the dose was raised to as high as 36 mg/kg of TAT-gelonin (complexed with 80 mg/kg of T84.66-Hep). These safe doses determined for TAT-gelonin (36 mg/kg) and T84.66-Hep (80 mg/kg), albeit not being the precise MTDs, appeared already quite high when comparing with the doses reported in the literatures [31-33].
3.9. Targeting of TAT-gelonin/T84.-66-Hep complex in LS174T s.c. xenograft tumor bearing mice
To evaluate the feasibility of T84.66-mediated tumor targeting of the TAT-gelonin/T84.66-Hep complex, in vivo imaging study was conducted using LS174T s.c. xenograft tumor mouse model. TAT-gelonin and T84.66-Hep were first labeled with different near infrared (NIR) dyes, Dylight 775-B4 (B4) and Dylight 679-C5 (C5), respectively (B4/TAT-gelonin: 3 and C5/T84.66-Hep: 3.3). The fluorescence signals overlaid with bright-field images of the mice are displayed in Fig. 9, whereas data concerning the mean fluorescence intensities (M.F.I.) along the time course and their area under the curve (AUCtumor) profiles corresponding to TAT-gelonin-B4 measured from the tumors as well as the fluorescence images of tumors dissected 6 h after drug administration are depicted in Fig. 10A, 10B and 10C, respectively.
Figure 9.

Representative fluorescence images of LS174T s.c. xenograft tumor bearing nude mice after i.v. administration of (A) TAT-gelonin-B4, (B) TAT-gelonin-B4/nIgG-Hep or (C) TAT-gelonin-B4/T84.66-Hep-C5. Tumors in the mice images are indicated by red circles and arrows. Specifically, after administration of TAT-gelonin-B4/T84.66-Hep-C5 complex, the in vivo behaviors of TAT-gelonin-B4 (left image of C) and T84.66-Hep-C5 (right image of C) were simultaneously monitored from the same mice along the time. (TAT-gelonin-B4: Dylight 775-B4 labeled chimeric TAT-gelonin fusion protein, nIgG-Hep: nonspecific IgG-heparin conjugate, T84.66-Hep-C5: Dylight 679-C5 labeled T84.66-heparin conjugate)
Figure 10.

Tumor accumulation profiles of TAT-gelonin-B4 after administration of LS174T s.c. xenograft tumor bearing nude mice with TAT-gelonin-B4, TAT-gelonin-B4/nIgG-Hep or TAT-gelonin-B4/T84.66-Hep-C5. (A) Relative mean fluorescence intensities (M.F.I.s) corresponding to TAT-gelonin-B4 in the tumors as a function of time. (B) Comparison of area under the curves (AUCtumor) of the tumor M.F.I. vs. time curves, corresponding to the tumor exposures of TAT-gelonin-B4. The tumor exposure of TAT-gelonin-B4 was significantly enhanced (58.4-fold) by administration of TAT-gelonin-B4/T84.66-Hep-C5, when compared with administration of TAT-gelonin-B4 alone. Statistical significant difference of the AUCtumor among the groups was compared by 1-way ANOVA with Tukey’s multiple comparison test as the post hoc test using Prism software (GraphPad). **P < 0.01, ***P < 0.001. (C) Tumor images dissected 6 h after administration of the test compounds. (D) Biodistribution profiles at 2 h and 24 h post-administration. In agreement of the observations in Fig. 8A and 8B, remarkably enhanced accumulation of TAT-gelonin-B4 was observed in the tumor dissected from the mouse administered with TAT-gelonin-B4/T84.66-Hep-C5, compared with injection of TAT-gelonin-B4 alone. 1-way ANOVA with Tukey’s multiple comparison test as the post hoc test using Prism software (GraphPad). *P < 0.05, **P < 0.01, ***P < 0.001. (TAT-gelonin-B4: Dylight 775-B4 labeled chimeric TAT-gelonin fusion protein, nIgG-Hep: nonspecific IgG-heparin conjugate, T84.66-Hep-C5: Dylight 679-C5 labeled T84.66-heparin conjugate)
As can be seen, when being administered alone (Fig. 9A), TAT-gelonin-B4 was observed from the mouse body within a period of 24 h, and displayed a low accumulation on the tumor target (see Fig. 10 also). On the other hand, after injection of the TAT-gelonin-B4/nIgG-Hep complex (Fig. 9B), TAT-gelonin-B4 was apparently visible in the animal body for a prolonged period of greater than 48 h, and displayed a significantly higher accumulation at the tumor target (see Fig. 10 also). Despite of the fact that nIgG-Hep possessed no specificity towards LS174T cells, a 7.8-fold increase (n.s. (not significant), p > 0.05 by 1-way ANOVA and Tukey’s multiple comparison test; ** p < 0.01 by Student’s t test) in tumor exposure (AUCtumor) of TAT-gelonin-B4 was observed following the injection of TAT-gelonin-B4/nIgG-Hep, when comparing the AUCtumor results with those obtained from mice administered with TAT-gelonin-B4 only. These findings suggested that, even without the aid of active targeting, complexation with an antibody-heparin conjugate could yield an enhanced tumor accumulation of TAT-gelonin-B4; presumably due to an augmented EPR (enhanced permeation and retention) effect via prolonged residence in circulation. However, the most significant enhancement in tumor accumulation of TAT-gelonin-B4 was observed when mice were administered with TAT-gelonin-B4/T84.66-Hep-C5 (Fig. 9C). As agreed by results in Fig. 9, not only enhanced but also localized delivery of TAT-gelonin-B4 was observed in the tumor and, remarkably, a 58.4-fold increase (***p < 0.001 by 1-way ANOVA and Tukey’s multiple comparison test) of AUCtumor was accomplished by the injection of TAT-gelonin-B4/T84.66-Hep-C5. When the in vivo behavior of TAT-gelonin-B4 (Fig. 9C-left) was compared with that of T84.66-Hep-C5 (Fig. 9C-right) in the same mouse administered with TAT-gelonin-B4/T84.66-Hep-C5, T84.66-Hep-C5 showed a tumor accumulation profile closely resembled to that of TAT-gelonin-B4; suggesting an active targeting of TAT-gelonin-B4 mediated by the noncovalently linked T84.66-Hep-C5.
3.10. Biodistribution
The biodistribution profiles of TAT-gelonin were examined with LS174T xenograft tumor bearing mice. After administration of TAT-gelonin-B4, TAT-gelonin/nIgG-Hep and TAT-gelonin-B4/T84.66-Hep via tail vein injection, major organs (e.g., tumor, heart, liver, spleen and kidney) were dissected at 2 h and 24 h post-administration, and the weight normalized M.F.I.s of the organs were acquired. As shown in Fig. 10D, when administered alone, TAT-gelonin was mainly observed from kidney, liver, spleen and tumor at 2 h post-injection, and found only in kidney and liver after 24 h of injection. The M.F.I. profiles of the heart which reflect the blood concentrations of TAT-gelonin indicated rapid tissue distribution and elimination (< 2 h). In a sharp contrast, when TAT-gelonin was administered as a complex with either nIgG-Hep or T84.66-Hep, prolonged blood residence was observed; as evidenced by the traceable M.F.I. of heart at even 24 h post-administration. With a good agreement to the live animal imaging results (Fig.9 and 10A), higher tumor accumulation of TAT-gelonin-B4 was accomplished by administration of TAT-gelonin-B4/nIgG-Hep and TAT-gelonin-B4/T84.66-Hep. Specifically, the mice treated with TAT-gelonin/T84.66-Hep showed the most significant targeting effect (tumor/heart weight normalized M.F.I. ratio of 7.55 at 24 h post-administration, p < 0.001*** by 1-way ANOVA and Tukey’s multiple comparison test), when compared with administration of TAT-gelonin (0.96) and TAT-gelonin/nIgG-Hep (1.42).
3.11. Therapeutic Efficacy
To verify the efficacy of T84.66-Hep-based tumor targeting of TAT-gelonin, we treated LS174T s.c. xenograft tumor bearing mice with either PBS, T84.66-Hep, TAT-gelonin, T84.66-gelonin conjugate or TAT-gelonin/T84.66-Hep complex. During the experiment, tumor sizes and body weight changes of the mice were monitored along the time course. As shown in Fig. 11A, mice treated with T84.66-Hep (without TAT-gelonin) and T84.66-gelonin did not exhibit any therapeutic effect (tumor size: 993 ± 414 mm3, 985 ± 320 mm3, respectively). Similarly the tumor size of mice treated with TAT-gelonin also continued to grow exponentially, with no apparent inhibition on the tumor growth even after administered of a high dose of 7 mg/kg (slightly lower than MTD) for three times. At day 31, the tumor size of TAT-gelonin treated mice reached 969.4 ± 280 mm3 (12.3% inhibition) which was not significantly different from that (1110.8 ± 203 mm3) of the control mice with PBS injection. In sharp contrast, mice treated with the TAT-gelonin/T84.66-Hep complex yielded a significant inhibition (46%) on the tumor growth (602 ± 194 mm3 at day 31, p < 0.05* by 1-way ANOVA and Tukey’s multiple comparison test).
Figure 11.

In vivo evaluation of the therapeutic efficacy of T84.66-Hep-based tumor targeting of TAT-gelonin using LS174T s.c. xenograft tumor mouse model. (A) Tumor volume profiles. When the average tumor size reached 40 mm3 (at day 3; 3 days after tumor implantation at day 0), LS174T s.c. xenograft tumor mice were randomly divided into 4 5 groups and administered three times with either: 1) PBS (circle), 2) T84.66-Hep (reverse triangle), 3) TAT-gelonin (triangle), 4) T84.66-gelonin conjugate (diamond) or 45) TAT-gelonin/T84.66-Hep complex (square), . The mice were treated three times with the above recipe at day 3, 6 and 9 via tail vein injection. For each treatment, TAT-gelonin/T84.66-Hep complex was freshly prepared by mixing T84.66-Hep with TAT-gelonin and incubation at 4°C for 30 min. At day 31, when the average tumor volume of PBS-treated mice reached 1000 mm3, the a statistically significant difference was observed in the tumor volumes between the mice treated with TAT-gelonin/T84.66-Hep and PBS. in the tumor volumes among the groups was compared by 1-way ANOVA with Tukey’s multiple comparison test as the post hoc test. *P < 0.05. (B) Body weight changes of the mice. While mice treated with either PBS (circle) or , T84.66-Hep (reverse triangle), T84.66-gelonin (diamond) or TAT-gelonin/T84.66-Hep (square) continued to gain weight during the course of study, in sharp contrast, a transient but significant body weight loss was observed from the mice administered with TAT-gelonin (triangle). Statistical significant difference in the body weight changes among the groups was compared by 1-way ANOVA with Tukey’s multiple comparison test as the post hoc test. *P < 0.05, **P < 0.01, ***P < 0.001. (T84.66-Hep: T84.66-heparin conjugate)
During the efficacy study, the average body weight of all of the mice gradually increased by an average of 20.3%; from 25 ± 0.4 g at day 1 to 29.3 ± 0.5 g at day 31 (Fig. 11B). However, while mice treated with PBS, T84.66-Hep, T84.66-gelonin and TAT-gelonin/T84.66-Hep continued to gain weight during the course of study, in sharp contrast, a transient but significant body weight loss was observed from mice administered with TAT-gelonin. Specifically one day after the last, 3rd drug treatment (at day 10) with TAT-gelonin, there was a dramatic weight loss (−15.4%, at day 10, p < 0.001*** by 1-way ANOVA and Tukey’s multiple comparison test as the post hoc test) in the test animals, as opposed to a weight gain in mice administered with PBS (10%), T84.66-Hep (5.7%), T84.66-gelonin (6.5%) and TAT-gelonin/T84.66-Hep (3%).
4. Discussion
With the unparalleled reaction efficiency and repetitive reaction mechanism, protein toxins have drawn significant attention as potential therapeutic agents. [34, 35]. Yet, clinical application of these drugs in cancer therapy has been limited by two major challenges: one is the inefficiency to internalize cancer cells, resulting in suboptimal concentration in the cytosol which is the primary site of action, and the other is the manifestation of toxic, in some cases life-threatening, side effects caused by lack of selectivity between target and normal cells. One promising strategy to overcome the cell membrane barrier (1st challenge) is to utilize the protein transduction domains (PTDs) such as the TAT peptide. In general, PTD offers a number of distinctive merits: 1) they are toxic at only high concentrations (no toxicity below 50 μM) [36, 37], 2) can be easily conjugated to a protein drug via either chemical or genetic engineering method without significantly affecting their intrinsic activity [12] and 3) exceptionally efficient in delivering attached cargos into almost all types of cells [38]. Indeed, this PTD-mediated cell uptake has been shown to be so effective and overwhelming that it cannot be matched by any existing cell entry method including the receptor-mediated endocytosis. Gelonin, a member of type 1 ribosome inactivating protein (RIP) family, is a plant derived toxin and represents a typical example of the potential anti-cancer protein therapeutics. Despite of the extraordinary potency on inhibiting protein synthesis, clinical translation of gelonin has been severely hindered due to its poor cell uptake. [10, 39] To this regard, we engineered a chimeric fusion protein of TAT and gelonin (i.e. TAT-gelonin) from the E. coli expression system (Fig. 3). The synthesized TAT-gelonin displayed a significantly augmented cytotoxic activity against both LS174T and HCT116 human colon cancer cells, when comparing with unmodified gelonin (Table 1), suggesting the plausibility of our PTD-based gelonin delivery
Despite of the unparalleled potency of PTD in transducing any type of compound (small, large, hydrophobic or hydrophilic) across almost all types of cell membranes, the lack of selectivity of PTD on its mediated cell internalization unfortunately renders this method unacceptable in clinical practice, due to concerns of causing drug-associated toxic side effects. Specifically, if a toxin drug is attached to PTD, the extremely potent yet indiscriminative cell-killing ability towards both cancer and normal tissues would lead to severe drug-induced systemic toxicity. Indeed, our cytotoxicity studies showed that TAT-gelonin yielded a significant degree of cell death not only to cancerous cells (LS174T and HCT116), but also to noncancerous normal cells (MDCK and 293 HEK) (Fig. 5). To curb the “wild” behavior of PTD and direct its translocating activity specifically to only diseased cells, various approaches have been attempted. Among them, reversibly masking the PTD using an anionic counterpart that is releasable near the tumor target appeared to be an appealing strategy, as it can provide a direct and complete blockage of unwanted interaction between PTD and the non-diseased cells. In the present work, to provide an effective “masking” and, moreover, “tumor targeting” of TAT-gelonin, we developed a novel delivery strategy comprising of TAT-gelonin linked with a heparin conjugated monoclonal antibody (mAb). Heparin, a clinically used anticoagulant drug [40], possesses exceptionally high negative charge density that enables it to bind strongly with cationic compounds via reversible electrostatic interaction [41, 42]. Previously, Yang and co-workers reported that the binding affinity of heparin with low molecular weight protamine (LMWP; VSRRRRRRGGRRRR), a cationic PTD, was stronger than that with antithrombin III (ATIII), which is known to be the strongest heparin-binding proteins in the circulation [43]. Given the similarity in their peptide structures between LMWP and TAT (YGRKKRRQRRR), we hypothesized that, mediated via the avid interaction between heparin and TAT, T84.66-Hep would be able to form a tight complex with TAT-gelonin, thereby yielding a proper masking of TAT and also serving as an effective loading platform for the drug. For the targeting moiety, an anti-CEA monoclonal antibody, T84.66, was selected based on two crucial advantages. First, T84.66 was reported to possess the highest specificity and binding affinity (2.6 × 10¹⁰ M−1) towards CEA [44], thus providing an exceptional tumor targeting efficiency towards CEA overexpressed tumors including colorectal cancer [23]. The other merit of T84.66 is being not an endocytosable antibody, thereby allowing sufficient time for TAT-gelonin to dissociate from T84.66-Hep and internalize tumor cells following targeting [45, 46].
T84.66-heparin conjugate (a.k.a. T84.66-Hep) was prepared by chemical conjugation using a heterobifunctional PEG (NH2-PEG-MAL, 3.5 kDa) as the cross-linker. Due to the relatively long and flexible nature of the polymer chain, PEG could reduce aggregation during the conjugation process. In addition, PEG could prevent interference between the components of the conjugate. Therefore, PEG has been used extensively as a cross-linker for preparation of various chemical conjugates [12, 47]. Indeed, in this study, by utilizing the PEG, T84.66-Hep could be successfully synthesized without the occurrence of any aggregation. More importantly, after heparin conjugation, T84.66 still retained a high CEA binding specificity; as demonstrated by the results from the binding assay (Fig. 6A). ELISA assay also confirmed that the binding affinity of T84.66-Hep to CEA was largely retained (avg. 69.2 %), when comparing to that of unmodified T84.66 (Fig. 6B). These results implicated that conjugation of heparin probably occurred primarily outside the antigen binding site of T84.66, rendering the targeting ability of T84.66 effective following conjugation.
Simply mixing of TAT-gelonin and T84.66-Hep (at 2:1 molar ratios) resulted in the formation of a nanocomplex (binding efficiency: 85%) which possessed good size stability in plasma (up to 72 h) (Fig. 7A and 7B). Despite strong binding between TAT-gelonin and T84.66-Hep, yet this complex could be reversibly dissociated; as evidenced by the release study results using immobilized TAT-gelonin/T84.66-Hep (Fig. 7C). This finding from the release study was further confirmed by the cell uptake study results (Fig. 8). When LS174T cells were incubated with TAT-gelonin/T84.66-Hep complex, TAT-gelonin was observed slowly internalizing (Fig. 8G, 8H and 8I), while T84.66-Hep continuously remained on the cell membranes (Fig. 8D, 8E and 8F); implicating release of TAT-gelonin from the T84.66-Hep counterpart and its subsequent cell transduction. The advantage of the complex nature of our DDS was apparent when compared the images of the cells treated with T84.66-gelonin conjugate and TAT-gelonin/T84.66-Hep complex (Fig. 8C and 8I); as a significantly higher cell uptake of gelonin was achieved by incubation with TAT-gelonin/T84.66-Hep complex, than T84.66-gelonin conjugate.
The feasibility of T84.66-Hep-mediated tumor targeting of TAT-gelonin was examined by live animal imaging and biodistribution studies. Live imaging technique was particularly useful in proving our hypothesis, as it provided “real-time” and “simultaneous” information of the behavior of both Dylight 775-B4-labeled TAT-gelonin (i.e. TAT-gelonin-B4) and Dylight 679-C5-labeled T84.66-Hep (i.e. T84.66-Hep-C5) within the same mouse and under the time course of the experiment. From the mice images, tumor targeting was clearly identified; as markedly enhanced and localized accumulation (58.4-fold) of TAT-gelonin-B4 was observed in the LS174T tumor after administration of the TAT-gelonin-B4/T84.66-Hep-C5 complex (Fig. 9C and 10); when compared to that by administration of TAT-gelonin-B4 alone (Fig. 9A and 10). Convincingly, this tumor targeting of TAT-gelonin-B4 was confirmed to be mediated by T84.66-Hep; as reflected by the closely resembled tumor accumulation profiles of TAT-gelonin-B4 (Fig. 9C-left) and T84.66-Hep-C5 (Fig. 9C-right). Overall, the imaging results provided strong support to the conclusion that TAT-gelonin-B4 and T84.66-Hep-C5 were targeted to tumor as one complex body. Another important finding from the imaging study was that, although nonspecific IgG-heparin conjugate (i.e. nIgG-Hep) did not possess binding specificity to LS174T tumor cells, higher tumor accumulation of TAT-gelonin-B4 (7.8-fold) was observed by the administration of TAT-gelonin-B4/nIgG-Hep (Fig. 9B and 10); when compared to the results by administration of TAT-gelonin-B4 only. A possible explanation might be that complexation with antibody-heparin conjugates significantly prolonged the blood residence time of TAT-gelonin-B4, and eventually provided a higher chance to be distributed into the tumor tissue via the EPR (enhanced permeation and retention) effect. As reported, gelonin possess a poor pharmacokinetic (PK) profile with a plasma half-life of only 3.5 min (in mice after i.v. injection); which is likely to be an insufficient time for a considerable amount of gelonin to accumulate at the tumor target. It was also in the literatures that the short plasma residence time of toxins such as gelonin could be significantly increased via conjugation with an antibody that generally had a relatively long plasma half-life (e.g., several days to weeks). Indeed, as seen in Fig. 9, the solely administered TAT-gelonin-B4 exhibited only a short time period of images (less than 24 h; peaked at 1 h-post administration), while, in a sharp contrast, TAT-gelonin-B4 complexed with either T84.66-Hep-C5 or nIgG-Hep was visible for much longer time periods (over 96 h (peaked at 6 h)) when complexed with T84.66-Hep-C5 and for 48 h (peaked at 24 h) with nIgG-Hep, respectively). Those findings from the live animal imaging were further confirmed by the biodistribution study results (Fig. 10D). When compared with administration of TAT-gelonin alone, prolonged blood circulation of TAT-gelonin was observed from the mice administered with TAT-gelonin/T84.66-Hep and TAT-gelonin/nIgG-Hep. Furthermore, the most prominent tumor targeting was achieved by administration of TAT-gelonin/T84.66-Hep.
Encouraged by the targeting results, the therapeutic benefits of the proposed strategy were further evaluated in an LS174T s.c. xenograft tumor mouse model. As can be seen in Fig. 11A, administration of TAT-gelonin/T84.66-Hep complex was able to considerably inhibit the tumor growth by 46% (at day 31), while TAT-gelonin alone could not provide any significant effect on the tumor growth, even when the dose (7 mg/kg) was increased close to the maximum tolerable dose (MTD; 9 mg/kg). These results suggested that TAT-gelonin was able to be gradually and slowly detached from its T84.66-Hep counterpart, once the TAT-gelonin/T84.66-Hep complexes were accumulated at the tumor target. Jiang et al. reported that the electrostatic interaction between a nona-arginine residue (R9) and a nona-glutamate residue (E9) could be stable when these two species were linked covalently with a matrix metalloprotease (MMP) cleavable linker [48]. However, once the linker was cleaved by MMP on the tumor surface, the R9/E9 would be slowly detached, rendering a sustained release of R9 and its subsequent internalization into tumor cells [48]. Based on the identical nature of the bond (i.e., electrostatic interaction) between R9/E9 and TAT/heparin, TAT-gelonin was presumably detached from T84.66-Hep during the time course of the animal study. Also, shown from the results of the release study, the TAT-gelonin/T84.66-Hep complexes seemed to retain their intact structures and mostly remain during the early stage of their administration (i.e. within 6 h), and were then gradually dissociated over the entire time course of the animal study (Fig. 7C); therefore providing sufficient time for the complexes to achieve specific tumor targeting. Asides from the advanced therapeutic efficacy, there were more important advantages offered by the presented drug delivery strategy. As shown in Fig. 11B, while TAT-gelonin caused a significant toxicity to the animals (15.4 % body weight loss at day 10) during the three cycles of treatment, TAT-gelonin/T84.66-Hep showed insignificant body weight loss as opposed to that seen in the control animal group with PBS injection. These results were in good accordance to the enhanced MTD value for TAT-gelonin/T84.66-Hep over that for TAT-gelonin. Such a reduced toxicity may be accounted for in terms of the modified PK profiles and delayed exposure of TAT-gelonin to the main eliminating organ such as kidney, which is the organ most likely to show severe toxicity [49]. To fully understand the reduced toxic effects of this gelonin delivery system, extensive and detailed animal studies for the PK profiles and tissue distribution of both TAT-gelonin and TAT-gelonin/T84.66-Hep are warranted and, indeed, those studies are currently underway in our own laboratories.
5. Conclusion
In this research, a heparin conjugated murine anti-CEA monoclonal antibody, T84.66-Hep, was synthesized to aid in the delivery of a PTD-modified gelonin toxin, TAT-gelonin. The T84.66-Hep, prepared by chemical conjugation using a heterobifunctional PEG as the cross-linker, was shown capable of forming a tight complex with TAT-gelonin, both in vitro and in vivo. Furthermore, via specific binding to CEA expressed on the tumor cells, T84.66-Hep was able to selectively deliver TAT-gelonin to the tumor target. By administration of the TAT-gelonin/T84.66-Hep complex, significantly enhanced tumor exposure of TAT-gelonin (58.4-fold) over that by injection of TAT-gelonin alone was observed. By the combination of T84.66-Hep induced tumor targeting and TAT-mediated intracellular delivery of gelonin, significant therapeutic efficacy on the treatment of CEA-expressed colorectal tumor was achieved. More importantly, the toxic side effects resulting from the non-selective action of TAT-gelonin on normal tissues were significantly reduced. Overall, this study demonstrated a novel and efficient strategy to deliver highly potent toxins selectively to tumor for effective colorectal cancer therapy.
Supplementary Material
Acknowledgements
This work was partially supported by the NSFC 2013 A3 Foresight Program (81361140344) and National Key Basic Research Program of China (2013CB932502). In addition, this work was also supported in part by National Institutes of Health R01 Grants CA114612. The authors thank Dr. Wolfgang E. Trommer (University of Kaiserslautern, Germany) for gelonin expression vector (pET28a-Gel).
Footnotes
Publisher's Disclaimer: This is a PDF file of an unedited manuscript that has been accepted for publication. As a service to our customers we are providing this early version of the manuscript. The manuscript will undergo copyediting, typesetting, and review of the resulting proof before it is published in its final citable form. Please note that during the production process errors may be discovered which could affect the content, and all legal disclaimers that apply to the journal pertain.
References
- [1].Siegel R, Ma J, Zou Z, Jemal A. Cancer statistics. CA Cancer J Clin. 2014;64:9–29. doi: 10.3322/caac.21208. 2014. [DOI] [PubMed] [Google Scholar]
- [2].Giacchetti S, Itzhaki M, Gruia G, Adam R, Zidani R, Kunstlinger F, Brienza S, Alafaci E, Bertheault-Cvitkovic F, Jasmin C, Reynes M, Bismuth H, Misset JL, Levi F. Long-term survival of patients with unresectable colorectal cancer liver metastases following infusional chemotherapy with 5-fluorouracil, leucovorin, oxaliplatin and surgery. Ann Oncol. 1999;10:663–669. doi: 10.1023/a:1008347829017. [DOI] [PubMed] [Google Scholar]
- [3].Schroeder A, Heller DA, Winslow MM, Dahlman JE, Pratt GW, Langer R, Jacks T, Anderson DG. Treating metastatic cancer with nanotechnology. Nat Rev Cancer. 2012;12:39–50. doi: 10.1038/nrc3180. [DOI] [PubMed] [Google Scholar]
- [4].Longley DB, Harkin DP, Johnston PG. 5-fluorouracil: mechanisms of action and clinical strategies. Nat Rev Cancer. 2003;3:330–338. doi: 10.1038/nrc1074. [DOI] [PubMed] [Google Scholar]
- [5].Grothey A, Sargent D, Goldberg RM, Schmoll HJ. Survival of patients with advanced colorectal cancer improves with the availability of fluorouracil-leucovorin, irinotecan, and oxaliplatin in the course of treatment. J Clin Oncol. 2004;22:1209–1214. doi: 10.1200/JCO.2004.11.037. [DOI] [PubMed] [Google Scholar]
- [6].Kelly H, Goldberg RM. Systemic therapy for metastatic colorectal cancer: current options, current evidence. J Clin Oncol. 2005;23:4553–4560. doi: 10.1200/JCO.2005.17.749. [DOI] [PubMed] [Google Scholar]
- [7].Puri M, Kaur I, Perugini MA, Gupta RC. Ribosome-inactivating proteins: current status and biomedical applications. Drug Discov Today. 2012;17:774–783. doi: 10.1016/j.drudis.2012.03.007. [DOI] [PubMed] [Google Scholar]
- [8].Davidson BL, McCray PB., Jr. Current prospects for RNA interference-based therapies. Nat Rev Genet. 2011;12:329–340. doi: 10.1038/nrg2968. [DOI] [PMC free article] [PubMed] [Google Scholar]
- [9].Kay MA. State-of-the-art gene-based therapies: the road ahead. Nat Rev Genet. 2011;12:316–328. doi: 10.1038/nrg2971. [DOI] [PubMed] [Google Scholar]
- [10].Stirpe F, Olsnes S, Pihl A. Gelonin, a new inhibitor of protein synthesis, nontoxic to intact cells. Isolation, characterization, and preparation of cytotoxic complexes with concanavalin A. J Biol Chem. 1980;255:6947–6953. [PubMed] [Google Scholar]
- [11].Atkinson SF, Bettinger T, Seymour LW, Behr JP, Ward CM. Conjugation of folate via gelonin carbohydrate residues retains ribosomal-inactivating properties of the toxin and permits targeting to folate receptor positive cells. J Biol Chem. 2001;276:27930–27935. doi: 10.1074/jbc.M102825200. [DOI] [PubMed] [Google Scholar]
- [12].Shin MC, Zhang J, David AE, Trommer WE, Kwon YM, Min KA, Kim JH, Yang VC. Chemically and biologically synthesized CPP-modified gelonin for enhanced anti-tumor activity. J Control Release. 2013;172:169–178. doi: 10.1016/j.jconrel.2013.08.016. [DOI] [PMC free article] [PubMed] [Google Scholar]
- [13].Shin MC, Zhang J, Min KA, Lee K, Byun Y, David AE, He H, Yang VC. Cell-penetrating peptides: achievements and challenges in application for cancer treatment. J Biomed Mater Res. 2014;102:575–587. doi: 10.1002/jbm.a.34859. [DOI] [PMC free article] [PubMed] [Google Scholar]
- [14].Brooks H, Lebleu B, Vives E. Tat peptide-mediated cellular delivery: back to basics. Adv Drug Deliv Rev. 2005;57:559–577. doi: 10.1016/j.addr.2004.12.001. [DOI] [PubMed] [Google Scholar]
- [15].Wadia JS, Dowdy SF. Transmembrane delivery of protein and peptide drugs by TAT-mediated transduction in the treatment of cancer. Adv Drug Deliv Rev. 2005;57:579–596. doi: 10.1016/j.addr.2004.10.005. [DOI] [PubMed] [Google Scholar]
- [16].Huang Y, Jiang Y, Wang H, Wang J, Shin MC, Byun Y, He H, Liang Y, Yang VC. Curb challenges of the “Trojan Horse” approach: smart strategies in achieving effective yet safe cell-penetrating peptide-based drug delivery. Adv Drug Deliv Rev. 2013;65:1299–1315. doi: 10.1016/j.addr.2012.11.007. [DOI] [PMC free article] [PubMed] [Google Scholar]
- [17].Wu AM, Senter PD. Arming antibodies: prospects and challenges for immunoconjugates. Nat Biotechnol. 2005;23:1137–1146. doi: 10.1038/nbt1141. [DOI] [PubMed] [Google Scholar]
- [18].Adams GP, Weiner LM. Monoclonal antibody therapy of cancer. Nat Biotechnol. 2005;23:1147–1157. doi: 10.1038/nbt1137. [DOI] [PubMed] [Google Scholar]
- [19].Gold P, Freedman SO. Specific carcinoembryonic antigens of the human digestive system. J Exp Med. 1965;122:467–481. doi: 10.1084/jem.122.3.467. [DOI] [PMC free article] [PubMed] [Google Scholar]
- [20].Hammarstrom S. The carcinoembryonic antigen (CEA) family: structures, suggested functions and expression in normal and malignant tissues. Semin Cancer Biol. 1999;9:67–81. doi: 10.1006/scbi.1998.0119. [DOI] [PubMed] [Google Scholar]
- [21].Meyer T, Gaya AM, Dancey G, Stratford MR, Othman S, Sharma SK, Wellsted D, Taylor NJ, Stirling JJ, Poupard L, Folkes LK, Chan PS, Pedley RB, Chester KA, Owen K, Violet JA, Malaroda A, Green AJ, Buscombe J, Padhani AR, Rustin GJ, Begent RH. A phase I trial of radioimmunotherapy with 131I-A5B7 anti-CEA antibody in combination with combretastatin-A4-phosphate in advanced gastrointestinal carcinomas. Clin Cancer Res. 2009;15:4484–4492. doi: 10.1158/1078-0432.CCR-09-0035. [DOI] [PubMed] [Google Scholar]
- [22].Shibata S, Raubitschek A, Leong L, Koczywas M, Williams L, Zhan J, Wong JY. A phase I study of a combination of yttrium-90-labeled anti-carcinoembryonic antigen (CEA) antibody and gemcitabine in patients with CEA-producing advanced malignancies. Clin Cancer Res. 2009;15:2935–2941. doi: 10.1158/1078-0432.CCR-08-2213. [DOI] [PMC free article] [PubMed] [Google Scholar]
- [23].Urva SR, Balthasar JP. Target mediated disposition of T84.66, a monoclonal anti-CEA antibody: application in the detection of colorectal cancer xenografts. MAbs. 2010;2:67–72. doi: 10.4161/mabs.2.1.10781. [DOI] [PMC free article] [PubMed] [Google Scholar]
- [24].Hossann M, Li Z, Shi Y, Kreilinger U, Buttner J, Vogel PD, Yuan J, Wise JG, Trommer WE. Novel immunotoxin: a fusion protein consisting of gelonin and an acetylcholine receptor fragment as a potential immunotherapeutic agent for the treatment of Myasthenia gravis. Protein Expr Purif. 2006;46:73–84. doi: 10.1016/j.pep.2005.08.029. [DOI] [PubMed] [Google Scholar]
- [25].Urva SR, Yang VC, Balthasar JP. An ELISA for quantification of T84.66, a monoclonal anti-CEA antibody, in mouse plasma. J Immunoassay Immunochem. 2010;31:1–9. doi: 10.1080/15321810903404772. [DOI] [PubMed] [Google Scholar]
- [26].Ellman GL. Tissue sulfhydryl groups. Arch Biochem Biophys. 1959;82:70–77. doi: 10.1016/0003-9861(59)90090-6. [DOI] [PubMed] [Google Scholar]
- [27].Jaques LB, Wollin A. A modified method for the colorimetric determination of heparin. Can J Physiol Pharmacol. 1967;45:787–794. doi: 10.1139/y67-093. [DOI] [PubMed] [Google Scholar]
- [28].Cole AJ, David AE, Wang J, Galban CJ, Hill HL, Yang VC. Polyethylene glycol modified, cross-linked starch-coated iron oxide nanoparticles for enhanced magnetic tumor targeting. Biomaterials. 2011;32:2183–2193. doi: 10.1016/j.biomaterials.2010.11.040. [DOI] [PMC free article] [PubMed] [Google Scholar]
- [29].Billinton N, Knight AW. Seeing the wood through the trees: a review of techniques for distinguishing green fluorescent protein from endogenous autofluorescence. Anal Biochem. 2001;291:175–197. doi: 10.1006/abio.2000.5006. [DOI] [PubMed] [Google Scholar]
- [30].Madan S, Ghosh PC. Interaction of gelonin with macrophages: effect of lysosomotropic amines. Exp Cell Res. 1992;198:52–58. doi: 10.1016/0014-4827(92)90148-2. [DOI] [PubMed] [Google Scholar]
- [31].Zhou X, Qiu J, Wang Z, Huang N, Li X, Li Q, Zhang Y, Zhao C, Luo C, Zhang N, Teng X, Chen Z, Liu X, Yu X, Wu W, Wei YQ, Li J. In vitro and in vivo anti-tumor activities of anti-EGFR single-chain variable fragment fused with recombinant gelonin toxin. J Cancer Res Clin Oncol. 2012;138:1081–1090. doi: 10.1007/s00432-012-1181-7. [DOI] [PMC free article] [PubMed] [Google Scholar]
- [32].Cao Y, Marks JW, Liu Z, Cheung LH, Hittelman WN, Rosenblum MG. Design optimization and characterization of Her2/neu-targeted immunotoxins: comparative in vitro and in vivo efficacy studies. Oncogene. 2014;33:429–439. doi: 10.1038/onc.2012.612. [DOI] [PMC free article] [PubMed] [Google Scholar]
- [33].Zhou H, Hittelman WN, Yagita H, Cheung LH, Martin SS, Winkles JA, Rosenblum MG. Antitumor activity of a humanized, bivalent immunotoxin targeting fn14-positive solid tumors. Cancer Res. 2013;73:4439–4450. doi: 10.1158/0008-5472.CAN-13-0187. [DOI] [PMC free article] [PubMed] [Google Scholar]
- [34].Stirpe F, Battelli MG. Ribosome-inactivating proteins: progress and problems. Cell Mol Life Sci. 2006;63:1850–1866. doi: 10.1007/s00018-006-6078-7. [DOI] [PMC free article] [PubMed] [Google Scholar]
- [35].Devi GR. siRNA-based approaches in cancer therapy. Cancer Gene Therapy. 2006;13:819–829. doi: 10.1038/sj.cgt.7700931. [DOI] [PubMed] [Google Scholar]
- [36].El-Andaloussi S, Jarver P, Johansson HJ, Langel U. Cargo-dependent cytotoxicity and delivery efficacy of cell-penetrating peptides: a comparative study. Biochem J. 2007;407:285–292. doi: 10.1042/BJ20070507. [DOI] [PMC free article] [PubMed] [Google Scholar]
- [37].Vives E, Schmidt J, Pelegrin A. Cell-penetrating and cell-targeting peptides in drug delivery. Biochim Biophys Acta. 2008;1786:126–138. doi: 10.1016/j.bbcan.2008.03.001. [DOI] [PubMed] [Google Scholar]
- [38].Schwarze SR, Ho A, Vocero-Akbani A, Dowdy SF. In vivo protein transduction: delivery of a biologically active protein into the mouse. Science. 1999;285:1569–1572. doi: 10.1126/science.285.5433.1569. [DOI] [PubMed] [Google Scholar]
- [39].Stirpe F, Barbieri L, Battelli MG, Soria M, Lappi DA. Ribosome-inactivating proteins from plants: present status and future prospects. Nat Biotech. 1992;10:405–412. doi: 10.1038/nbt0492-405. [DOI] [PubMed] [Google Scholar]
- [40].Agnelli G, Piovella F, Buoncristiani P, Severi P, Pini M, D’Angelo A, Beltrametti C, Damiani M, Andrioli GC, Pugliese R, Iorio A, Brambilla G. Enoxaparin plus compression stockings compared with compression stockings alone in the prevention of venous thromboembolism after elective neurosurgery. N Engl J Med. 1998;339:80–85. doi: 10.1056/NEJM199807093390204. [DOI] [PubMed] [Google Scholar]
- [41].Absar S, Choi S, Yang VC, Kwon YM. Heparin-triggered release of camouflaged tissue plasminogen activator for targeted thrombolysis. J Control Release. 2012;157:46–54. doi: 10.1016/j.jconrel.2011.09.060. [DOI] [PubMed] [Google Scholar]
- [42].Chertok B, David AE, Yang VC. Magnetically-enabled and MR-monitored selective brain tumor protein delivery in rats via magnetic nanocarriers. Biomaterials. 2011;32:6245–6253. doi: 10.1016/j.biomaterials.2011.05.004. [DOI] [PMC free article] [PubMed] [Google Scholar]
- [43].Chang LC, Lee HF, Yang Z, Yang VC. Low molecular weight protamine (LMWP) as nontoxic heparin/low molecular weight heparin antidote (I): preparation and characterization. AAPS PharmSci. 2001;3:E17. doi: 10.1208/ps030317. [DOI] [PMC free article] [PubMed] [Google Scholar]
- [44].Neumaier M, Shively L, Chen FS, Gaida FJ, Ilgen C, Paxton RJ, Shively JE, Riggs AD. Cloning of the genes for T84.66, an antibody that has a high specificity and affinity for carcinoembryonic antigen, and expression of chimeric human/mouse T84.66 genes in myeloma and Chinese hamster ovary cells. Cancer Res. 1990;50:2128–2134. [PubMed] [Google Scholar]
- [45].Boudousq V, Bobyk L, Busson M, Garambois V, Jarlier M, Charalambatou P, Pelegrin A, Paillas S, Chouin N, Quenet F, Maquaire P, Torgue J, Navarro-Teulon I, Pouget JP. Comparison between internalizing anti-HER2 mAbs and non-internalizing anti-CEA mAbs in alpha-radioimmunotherapy of small volume peritoneal carcinomatosis using 212Pb. PloS One. 2013;8:e69613. doi: 10.1371/journal.pone.0069613. [DOI] [PMC free article] [PubMed] [Google Scholar]
- [46].Bryan JN, Jia F, Mohsin H, Sivaguru G, Miller WH, Anderson CJ, Henry CJ, Lewis MR. Comparative uptakes and biodistributions of internalizing vs. noninternalizing copper-64 radioimmunoconjugates in cell and animal models of colon cancer. Nucl Med Biol. 2005;32:851–858. doi: 10.1016/j.nucmedbio.2005.05.006. [DOI] [PubMed] [Google Scholar]
- [47].He H, Sheng J, David AE, Kwon YM, Zhang J, Huang Y, Wang J, Yang VC. The use of low molecular weight protamine chemical chimera to enhance monomeric insulin intestinal absorption. Biomaterials. 2013;34:7733–7743. doi: 10.1016/j.biomaterials.2013.06.047. [DOI] [PMC free article] [PubMed] [Google Scholar]
- [48].Jiang T, Olson ES, Nguyen QT, Roy M, Jennings PA, Tsien RY. Tumor imaging by means of proteolytic activation of cell-penetrating peptides. Proc Natl Acad Sci U S A. 2004;101:17867–17872. doi: 10.1073/pnas.0408191101. [DOI] [PMC free article] [PubMed] [Google Scholar]
- [49].Battelli MG. Cytotoxicity and toxicity to animals and humans of ribosome-inactivating proteins. Mini Rev Med Chem. 2004;4:513–521. doi: 10.2174/1389557043403819. [DOI] [PubMed] [Google Scholar]
Associated Data
This section collects any data citations, data availability statements, or supplementary materials included in this article.