

Abstract
Objectives
To investigate normative developmental BMI trajectories and associations of physical growth indicators (ie, height, weight, head circumference [HC], body mass index [BMI]) with non-verbal intelligence in an understudied population of children from Sub-Saharan Africa.
Study design
A sample of 3981 students (50.8% male), grades 3 to 7, with a mean age of 12.75 years was recruited from 34 rural Zambian schools. Children with low scores on vision and hearing screenings were excluded. Height, weight and HC were measured, and non-verbal intelligence was assessed using UNIT-symbolic memory and KABC-II-triangles.
Results
Results showed that students in higher grades have a higher BMI over and above the effect of age. Girls showed a marginally higher BMI, although that for both boys and girls was approximately 1 SD below the international CDC and WHO norms. Controlling for the effect of age, non-verbal intelligence showed small but significant positive relationships with HC (r = .17) and BMI (r = .11). HC and BMI accounted for 1.9% of the variance in non-verbal intelligence, over and above the contribution of grade and sex.
Conclusions
BMI-for-age growth curves of Zambian children follow observed worldwide developmental trajectories. The positive relationships between BMI and intelligence underscore the importance of providing adequate nutritional and physical growth opportunities for children worldwide and in sub-Saharan Africa in particular. Directions for future studies are discussed with regard to maximizing the cognitive potential of all rural African children.
Keywords: Body Mass Index—BMI, head circumference, children & adolescents, low and middle income countries, cognitive function
Physical health indicators such as height, weight, body mass index (BMI), and head circumference (HC) have been linked to intellectual development (1–5). Correlations of height and intelligence have been found across broad age ranges, with mean intellectual performance increasing with height (6, 7) and smaller children scoring lower on academic achievement tests than their taller counterparts (8). Higher BMI has been linked to lower performance IQ (9) and lower non-verbal reasoning (7). In contrast, BMI for 5-year-old boys was positively related to fluid intelligence, whereas it showed a negative relationship with crystallized intelligence (10). HC is one of the most important anthropometric indicators (i.e., nutrition and brain volume index) associated with intellectual performance (2–4, 11), notwithstanding the associations of developmental disorders and micro- and macro-cephaly (12).
Most of the research on developmental indices is from high-income countries. Comparatively less is known about these indicators in low-income countries. Reports from both suggest that inadequate physical growth represents a constant source of childhood underachievement. The greatest percentage (ie, 54.3% of children under five) of young children in poverty, a factor tied to underachievement and undergrowth, is in sub-Saharan Africa (6). A recent report describes BMI trends of over nine million people in nearly 200 countries (13). Despite BMI and obesity increases being the most pervasive global trends, parts of Africa evidence decreases in BMI or low BMI, suggesting that many people are underweight. As in much of the relevant literature, African countries were underrepresented in this research (13). In particular, Zambia was not included. Few studies of child nutrition have been completed in Zambia. Available results indicate that children have worse nutritional statuses than adults (8) and that there are more underweight children in underprivileged communities (14). Here, we describe the connections between health and cognition in a large cross-sectional rural sample of students. The results are a descriptive statement that emphasizes indicators of general health and explores their relationships with nonverbal intelligence.
Method
A total of 4609 children were approached for participation in the Bala Bbala Project (bala bbala means ‘read the word’ in Chitonga), a large-scale IRB-approved (UNZA BREC # 003-08-09) study of the manifestation, prevalence, and etiology of specific reading disabilities (SRD) in rural Zambia (15). After screening and enrollment, for this analysis children were excluded: (1) if they had missing data for BMI, intelligence, or head circumference; (2) based on hearing and vision screening; (3) if they were older than 19 (ie, the upper age limit of the CDC and WHO BMI norms). Children were excluded if they had vision poorer than 20/30 in both eyes or hearing loss of more than 40db for one or more of the assessed frequencies (ie, 1000, 2000, and 4000 hertz) in both ears. A total of 628 children were excluded based on these criteria (Figure 1; available at www.jpeds.com). Table I (available at www.jpeds.com) contains characteristics for the initial, excluded and final samples. The final sample comprises 3981 students (50.8% male), grades 3 to 7 of 34 schools, with a mean age of 12.75 years (SD = 2.03). The large age range (7.40 to 18.78, mode = 14, median = 12.71) is expected in rural Zambia because students here often miss years of schooling due to financial problems or household responsibilities, or repeat grades due to absenteeism (16).
Figure 1.
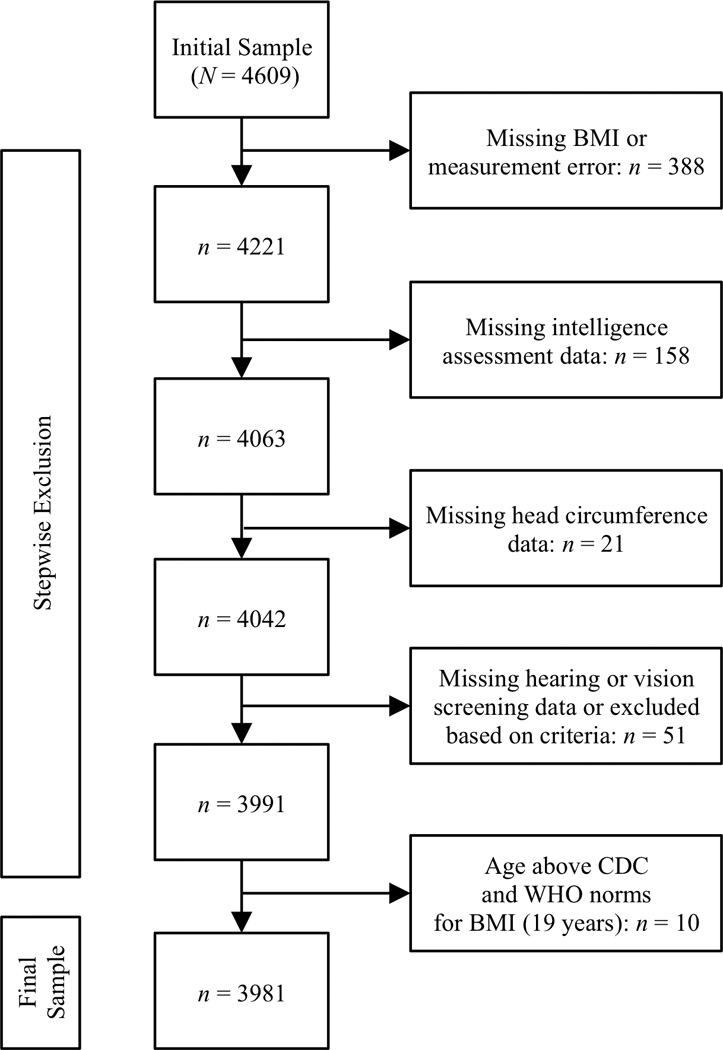
Flow chart showing stepwise exclusion criteria and sample selection.
Table 1.
Characteristics of the initial sample and comparison between excluded and final sample
| Initial (N = 4609) | Excluded (n = 628) | Final (n = 3981) | ||||||||||||
|---|---|---|---|---|---|---|---|---|---|---|---|---|---|---|
| n | % | M | SD | n | % | M | SD | n | % | M | SD | Difference | p | |
| Male | 2341 | 50.8 | 318 | 50.6 | 2023 | 50.8 | ||||||||
| Female | 2268 | 49.2 | 310 | 49 .4 | 1958 | 49.2 | χ2(1) = 0.01 | .933 | ||||||
| Grade | ||||||||||||||
| 3 | 943 | 20.5 | 150 | 23.9 | 793 | 19.9 | ||||||||
| 4 | 991 | 21.5 | 114 | 18.2 | 877 | 22.0 | ||||||||
| 5 | 931 | 20.2 | 143 | 22.8 | 788 | 19.8 | ||||||||
| 6 | 927 | 20.1 | 116 | 18.5 | 811 | 20.4 | ||||||||
| 7 | 817 | 17.7 | 105 | 16.7 | 712 | 17.9 | χ2(4) = 11.73 | .019 | ||||||
| Age | 12.75 | 2.07 | 12.72 | 2.35 | 12.75 | 2.03 | t(764.71) = −0.27 | .786 | ||||||
| HC | 52.73 | 1.88 | 52.60 | 1.70 | 52.75 | 1.90 | t(726.73) = −1.95 | .052 | ||||||
| Height | 144.39 | 11.06 | 144.38 | 12.10 | 144.39 | 11.00 | t(266.97) = −0.003 | .998 | ||||||
| Weight | 34.23 | 8.33 | 35.26 | 9.13 | 34.17 | 8.27 | t(4243) = 2.07 | .038 | ||||||
| BMI | 16.22 | 2.33 | 16.77 | 2.71 | 16.18 | 2.30 | t(260.23) = 3.25 | .001 | ||||||
Percentages reflect within-group proportions. Descriptive statistics for non-verbal intelligence are not shown because all children with missing data were excluded, resulting in the final sample of 3981 children for whom standardized scores (ie, M = 0, SD = 1) were derived. Difference = independent-samples t-tests for continuous variables and χ2-tests for dichotomous variables to examine differences between the excluded and the final sample. p = p-value for χ2 and t-test statistics (Bonferroni adjusted alpha is 0.05/5 = 0.01). Although BMI was higher in the excluded sample compared with the final sample, this difference indicates a small effect (Cohen d = 0.23); more importantly, BMI was comparable between the intial and the final sample (Cohen d = 0.02).
Age, grade and sex were collected from school records. Universal Non-verbal Intelligence Test, Symbolic Memory (UNIT-SM) (17) and Kaufman Assessment Battery for Children, Second Edition, Triangles (KABC-II-T) (18) were administered to assess nonverbal intelligence (ie, memory and simultaneous visual processing, respectively). They were selected because they use manipulative materials thought to be as engaging as possible for children not familiar with Western testing modes. UNIT-SM uses non-verbal instructions and has 30 items (Cronbach’s α = .82) that require students to reproduce an array of one to six images of people from memory. KABC-II-T has 27 items (Cronbach α = .86) that require students to use physical foam and plastic shapes, mainly triangles, to reproduce images. Sum scores were computed, and were submitted to a principal components analysis (oblimin rotation) to extract factor scores from a one-component solution (65.48% of variance explained) for further analyses. A stadiometer, scale and measuring tape were used to measure height, weight and HC of barefoot uniformed children. BMI was calculated (weight/height squared).
After obtaining written informed consent from a parent or guardian, trained research assistants individually administered assessments and were monitored during data collection. The data collectors were not informed about study hypotheses, group status (ie, at risk/not at risk for SRD) or results. Assessments were in the local language, Chitonga.
Results
Zambian age expectations are based on school entry age (first grade = 7 years). In this sample, the exact norm (e.g., 9 or 10 in gr. 3) was achieved by approximately 50% of students in each grade (gr. 3: 63.3%; gr. 4: 52.5%; gr. 5: 50.4%; gr. 6: 51.1%; gr. 7: 44.8%). The mean ages were 10.49 (gr. 3), 11.76 (gr. 4), 12.86 (gr. 5), 13.95 (gr. 6), and 15.02 (gr. 7). The age-grade correlation was relatively high (Spearman rank-order correlation coefficient, ρ = .79, p < .001).
Table I contains descriptive statistics for the main study variables. Boys had larger HC (Mboys = 52.87, SD = 1.82, Mgirls = 52.62, SD = 1.98, t(3979) = 4.13, p < .001), whereas girls had higher weight (Mboys = 33.81, SD = 7.83, Mgirls = 34.53, SD = 8.69, t(3979) = −2.73, p < .01) and marginally higher BMI (Mboys = 16.09, SD = 2.07, Mgirls = 16.28, SD = 2.51, t(3979) = −2.51, p < .05). There was no significant height difference by sex. To show the BMI value distribution, we utilized R to fit a generalized additive model for location scale and shape (GAMLSS) (19, 20) to the data with age as an explanatory variable and assuming a Box-cox-t distribution (Figure 2). As expected, these curves follow worldwide developmental trajectories, at least in the range of −2 to +2 SD below and above the mean. However, boys and girls showed comparatively lower BMI. For instance, BMI up to the age of 16 for girls is approximately 1 SD below global norms.
Figure 2.

Centile curves for BMI by sex. The top two figures show centile curves according to the specifications provided by the Center for Disease Control and Prevention (41). The bottom four paneils depict predicted standardized centile curves for −3 to +3 SD for boys and girls. WHO 2007 BMI-for-age z-scores are plotted as reference in two separate graphs (42). The average BMI growth curve is plotted in black (labeled “0”).
Correlates of general health indicators
Pearson product-moment correlations (Pearson’s r) were conducted. Partial correlations were computed to control for the effect of age. The four health indicators were significantly related to age (r = .29 for HC, .42 for BMI, .69 for height and weight) and grade (r = .25 for HC, .23 for BMI, .29 for height, .32 for weight). Although the magnitude of association decreases when controlling for age, grade remained positively related to BMI (r = .12), indicating that more schooling is related to higher BMI beyond biological maturation. Moreover, girls show marginally higher BMI, attributable to higher weight. Given these BMI correlates, a multivariate model was specified to examine differential effects of grade by sex. Sex, grade and the interaction between them were independent variables in an analysis of covariance (ANCOVA), with age as a covariate. This model explained a significant proportion of variance in HC (adj. R2 = .11), height (adj. R2 = .53), weight (adj. R2 = .53), and BMI (adj. R2 = .21). Similar to the correlational analysis, results showed significant main effects of grade on the health indicators. However, significant interactions between sex and grade indicate that HC (FInteraction = 9.40, p < .001, part. η2 = .009), weight (FInteraction = 8.94, p < .001, part. η2 = .009), and BMI (FInteraction = 15.68, p < .001, part. η2 = .016) increased differently by sex across grades.
Figure 3 displays age-adjusted means for health indicators as a function of grade and sex. Post-hoc tests (p-value adjustment using Holm method) of differences in interaction means showed that girls in grades 3 and 4 had smaller HC than boys (F = 25.97, for gr. 3, and F = 21.38, for gr. 4, ps < .001). However, the difference narrows after grade 5. Girls weighed significantly (ps < .001) more than boys in grades 5 (F = 17.33), 6 (F = 35.71), and 7 (F = 39.50). However, weight for boys and girls did not differ in grades 3 and 4. The strongest effect size was found for BMI, with about 1.6% of variance accounted for by the sex-grade interaction. The pattern of age-adjusted means (Table II) showed higher BMI in grade 3 boys than girls. However, grade 4 and 5 boys did not differ from girls. The driving factor is the reverse pattern of BMI differences of grades 6 and 7. BMI increases for boys after grade 5, but the increase is more pronounced for girls. There were moderate BMI differences in grade 6 and larger ones in grade 7.
Figure 3.

Age-adjusted means of head circumference, BMI, height, weight and nonverbal intelligence as a function of grade and sex, plotted separately for males (bold lines) and females (dashed lines) across grade. Estimates were derived from an analysis of covariance using sex, grade, and the interaction term between sex and grade as independent variables, and age as covariate.
Table 2.
Post-hoc analysis of the sex-by-grade interaction effect on BMI and non-verbal intelligence (N = 3981)
| Grade 3 | Grade 4 | Grade 5 | Grade 6 | Grade 7 | ||||||
|---|---|---|---|---|---|---|---|---|---|---|
| Boys | Girls | Boys | Girls | Boys | Girls | Boys | Girls | Boys | Girls | |
| n | 395 | 398 | 455 | 422 | 407 | 381 | 410 | 401 | 356 | 356 |
| BMI | ||||||||||
| MAdj (SE) | 16.16 (0.12) | 15.64 (0.12) | 15.65 (0.10) | 15.79 (0.10) | 16.02 (0.10) | 16.30 (0.11) | 16.07 (0.11) | 16.75 (0.11) | 16.34 (0.13) | 17.38 (0.12) |
| F (1, 3970) | 12.57, p = .001 | 1.06, p = .303 | 3.58, p = .117 | 22.35, p < .001 | 45.25, p < .001 | |||||
| d [95%-CI] | 0.23 [0.10, 0.36] | 0.06 [−0.06, 0.18] | 0.12 [0, 0.25] | 0.30 [0.18, 0.43] | 0.46 [0.32, 0.59] | |||||
| Nonverbal intelligenc | ||||||||||
| MAdj (SE) | −0.59 (0.05) | −0.57 (0.05) | −0.28 (0.04) | −0.31 (0.05) | 0.06 (0.05) | −0.02 (0.05) | 0.44 (0.05) | 0.18 (0.05) | 0.65 (0.06) | 0.60 (0.05) |
| F (1, 3970) | 0.07, p = 1.00 | 0.22, p = 1.00 | 1.64, p = .805 | 16.67, p < .001 | 0.50, p = 1.00 | |||||
| d [95%-CI] | 0.02 [−0.11, 0.15] | 0.03 [−0.10, 0.15] | 0.09 [−0.05, 0.22] | 0.27 [0.14, 0.40] | 0.05 [−0.09, 0.19] | |||||
MAdj = adjusted values of the interaction controlling for age. F = F-test for sex comparison in each grade. p = adjusted p-value (Holm method).
Predictors of non-verbal intelligence
Boys showed slightly higher nonverbal intelligence scores (Mboys = 0.04, SD = 1.03, Mgirls = − 0.04, SD = 0.97, t(3979) = 2.52, p < .05). For comparison, scaled scores (possible range: 1 to 19) were derived from published US norms for UNIT-SM and KABC-II-T. For UNIT-SM, scaled scores ranged from 1 to 15 (M = 3.07, SD = 2.44, median = 2), mode of 1 (42% of the sample). For KABC-II-T, scaled scores were 1 to 12 (M = 1.63, SD = 1.38, median = 1), mode of 1 (72.3% of the sample). Both indicate low average performance compared with US norms.
Nonverbal intelligence showed small but consistent positive relationships with health indicators after controlling for age. HC showed the highest correlations with nonverbal intelligence (r = .17); grade was positively related to nonverbal intelligence (r = .28), as was BMI (r = .11). An ANCOVA (age as a covariate) examined whether the test score increase over grades is consistent across sex. A significant interaction indicated that the difference between boys and girls was not consistent across grades (FInteraction = 2.83, p = .02, part. η2 = .003). Figure 3 displays the age-adjusted means for nonverbal intelligence as a function of grade and sex. Posthoc analyses (Table II) revealed that boys scored higher than girls only in grade 6. Given the considerable correlations between nonverbal intelligence and HC and BMI, we examined whether they explain a significant proportion of nonverbal intelligence variance beyond sex and grade. A hierarchical linear regression was conducted with the nonverbal intelligence factor score as the dependent variable. Grade and sex were entered in block 1. HC and BMI were entered in block 2. Age was not a covariate to avoid multicollinearity and because ANCOVAs showed no main age effect (F = 0.10) with grade as an independent variable in the same model. Grade and sex explained 18.2% of variance (F(2) = 443.08, p < .001). HC and BMI explained an additional 1.9% of nonverbal intelligence variance, beyond grade and sex (F(4) = 250.74, p < .001, adj. R2 = .201; ΔR2 = .019; F for ΔR2 = 47.95, p < .001). HC was a stronger predictor (B = 0.07, SE B = .01, β = .13, p < .001, 95%-CI = [0.51, 0.82]) than BMI (B = 0.02, SE B = .01, β = .05, p = .002, 95%-CI = [0.08, 0.35]), which indicates that with grade and sex constant, for each unit HC and BMI increase, non-verbal intelligence increases .07 and .02 units, respectively.
The importance of adequate physical health is underscored by the finding that students with BMI between 1–2 SD below average (derived from the standardized centiles; Figure 2) differed significantly in nonverbal intelligence from those with BMI at/above average (t(2549) = 3.60, p < .001, Cohen d = 0.18). This difference is even more pronounced when BMI is 2–3 SD below average compared with when it is at or above average (t(2138) = 3.17, p = .002, Cohen’s d = 0.37).
Discussion
We investigated the relationships between physical growth indicators and non-verbal intelligence in Zambia, a lower-middle-income country (21), one of the fifty least developed globally (22), where most people live in poverty (23). Rural Zambian home life centers on agriculture. Maize and other cereals account for most food consumption with fruits and vegetables, but rarely meat, added as available (24). Schools, at least in the study area, do not have cafeterias and cannot provide nutritious food. Factors such as underprivileged environments and inadequate diets are suggested factors for the high prevalence of underweight children (14). The findings in this report complement the limited information available from Zambia.
The developmental BMI-for-age trajectories followed the anticipated patterns. However, the Zambian context is also one with unexpected differences. BMI was lowest for boys in grade 4 and then increases in grades 5–7. In upper grades BMI was higher for girls than boys. Although unexpected, these results have cultural explanations. First, starting around 10–14 (the age range closest to grade 4), students have more household responsibilities that require more physical activity (e.g., on family farms). Parents capitalize on emerging physical and cognitive capacities and assign more chores, requiring more time away from studies. It is believed that in some families, there is reason to keep more physically able–stronger, weightier–boys at home and to send less physically able–smaller, leaner–boys to school (25). The decrease in grade 4 could be due to heavier boys leaving school between grades 3–4. Second, around 10–15 girls are expected to have higher BMI due to entering puberty (26).
The magnitude of associations between physical and cognitive indicators resembles coefficients observed in high-income countries (4). Specifically, the age-adjusted relationship of HC and intelligence (r ~ 0.17), and height, weight and intelligence (r ~ 0.13) are comparable with reported correlations (4, 5, 27). Unlike other studies that used normed BMI-for-age z-scores (28), we derived norms specific for this study. Although this procedure is appropriate to explore associations between physical growth and nonverbal intelligence, it precludes the direct comparison with other studies that use international references. An increasing number of reports have attempted to calculate national IQs and examine their correlates (29–31). On a country-level, IQ has been found to be highly associated with educational achievement (30, 32) and real Gross Domestic Product (30, 31, 33). Countries of sub-Saharan Africa have been found to be about two standard deviations lower than other countries, mostly for fluid intelligence (30). Yet, for high-income countries substantial gains in national IQ over time have been observed— referred to as Flynn effect (34)—and attributed to improved nutrition (35). Similarly, the Raven’s matrices performance gains in rural Kenyan children were attributed to improved nutrition and health (36). In light of these findings, the associations between physical growth and non-verbal intelligence found here underscore the importance of adequate nutrition, which contributes to physical growth globally.
Two factors limit the explanatory power of these results. We assessed non-verbal indicators of intelligence. Other (verbal) measures of acquired cultural knowledge (crystallized intelligence) might relate differently with grade (schooling) and physical growth, especially in the context of low BMI with different patterns for boys and girls across grades. Further, only children in school were assessed. Given that children in sub-Saharan African often lack school opportunities (16, 37) and given that schooling has new demands for subsistence-farming families (38), it remains to be examined if the associations reported here generalize to out-of-school children.
Yet, although with some limitations, this study makes what we think an essential contribution to understanding both the presence and the magnitude of the associations between the physical-growth (BMI and HC) and cognitive (non-verbal intelligence) characteristics in lower middle income countries. Although the accentuation of global initiatives has been systematically shifting towards the improvement of access to and quality of education in low and lower middle income countries, it is still critically important to continue the support of international anti-hunger initiatives, as a foundation for compulsory and improved schooling. This research provides data on an understudied population—sub-Saharan children, about whom little is known and for whom there is no clear understanding of developmental trajectories. Yet, given the large size of the rural sub-Saharan population (62.7% of the total population of sub- Saharan Africa in 2010) (39) and the projected high population growth, urbanization and youth surge formation (40) in the near future, understanding the commonalities and specifics of their development compared with world peers is important. Beyond their underrepresentation in the world developmental literature, it is important to predict these children’s contribution to the global labor market and economy within the changing demography of the world (6, 40).
Acknowledgments
Supported by the National Institutes of Health (R01 TW008274).
Abbreviations
- ANCOVA
analysis of covariance
- BMI
body mass index
- HC
head circumference
- IQ
intelligence quotient
- KABC-II-T
Kaufman Assessment Battery for Children, Second Edition, Triangles subtest
- UNIT-SM
Universal Non-verbal Intelligence Test, Symbolic Memory subtest
Footnotes
Publisher's Disclaimer: This is a PDF file of an unedited manuscript that has been accepted for publication. As a service to our customers we are providing this early version of the manuscript. The manuscript will undergo copyediting, typesetting, and review of the resulting proof before it is published in its final citable form. Please note that during the production process errors may be discovered which could affect the content, and all legal disclaimers that apply to the journal pertain.
The authors declare no conflicts of interest.
References
- 1.Rushton JP, Ankney CD. Whole brain size and general mental ability: a review. Int J Neurosci. 2009;119(5):691–731. doi: 10.1080/00207450802325843. [DOI] [PMC free article] [PubMed] [Google Scholar]
- 2.Ivanovic DM, Leiva BP, Perez HT, Olivares MG, Diaz NS, Urrutia MS, et al. Head size and intelligence, learning, nutritional status and brain development. Head, IQ, learning, nutrition and brain. Neuropsychologia. 2004;42(8):1118–1131. doi: 10.1016/j.neuropsychologia.2003.11.022. [DOI] [PubMed] [Google Scholar]
- 3.Ivanovic R, Forno H, Castro CG, Ivanovic D. Intellectual ability and nutritional status assessed through anthropometric measurements of Chilean school-age children from different socioeconomic status. Ecology of Food and Nutrition. 2000;39:1–25. [Google Scholar]
- 4.Jensen AR, Johnson FW. Race and sex differences in head size and IQ. Intelligence. 1994;18:309–333. [Google Scholar]
- 5.Jensen AR, Sinha SN. Biological factors and psychometric intelligence. In: Vernon PA, editor. Biological approaches to research on human intelligence. Norwood, NJ: Ablex; 1993. pp. 139–242. [Google Scholar]
- 6.Grantham-McGregor S, Cheung YB, Cueto S, Glewwe P, Richter L, Strupp B. Developmental potential in the first 5 years for children in developing countries. The Lancet. 2007;369(9555):60–70. doi: 10.1016/S0140-6736(07)60032-4. [DOI] [PMC free article] [PubMed] [Google Scholar]
- 7.Lawlor DA, Najman JM, Batty GD, O’Callaghan MJ, Williams GM, Bor W. Early life predictors of childhood intelligence: findings from the Mater-University study of pregnancy and its outcomes. Paediatric and Perinatal Epidemiology. 2006;20:148–162. doi: 10.1111/j.1365-3016.2006.00704.x. [DOI] [PubMed] [Google Scholar]
- 8.Yamauchi T. Growth and nutritional status of children and adults living in contrasting ecological zones in the southern provice of Zambia. Hokkaido: Hokkaido University; 2010. [Google Scholar]
- 9.Parisi P, Verrotti A, Paolino MC, Miano S, Urbano A, Bernabucci M, et al. Cognitive profile, parental education and BMI in children: reflections on common neuroendocrinobiological roots. Journal of Pediatric Endocrinology & Metabolism. 2010;23:1133–1141. doi: 10.1515/jpem.2010.178. [DOI] [PubMed] [Google Scholar]
- 10.Azurmendi A, Braza F, Sorozabal A, Garcia A, Braza P, Carreras MR, et al. Cognitive abilities, androgen levels, and body mass index in 5-year-old children. Horm Behav. 2005 Aug;48(2):187–195. doi: 10.1016/j.yhbeh.2005.03.003. [DOI] [PubMed] [Google Scholar]
- 11.Rushton JP, Ankney CD. Brain size and cognitive ability: correlations with age, sex, social class, and race. Psychometric Bulletin & Review. 1996;3:21–36. doi: 10.3758/BF03210739. [DOI] [PubMed] [Google Scholar]
- 12.Watemberg N, Silver S, Harel S, Lerman-Sagie T. Significance of Microcephaly Among Children With Developmental Disabilities. Journal of Child Neurology. 2002;17(2):117–122. doi: 10.1177/088307380201700205. [DOI] [PubMed] [Google Scholar]
- 13.Finucane MM, Stevens GA, Cowan M, Danaei G, Lin JK, Paciorek CJ, et al. National, regional, and global trends in body-mass index since 1980: systematic analysis of health examination surveys and epidemiological studies with 960 country-years and 9.1 million participants. The Lancet. 2011;377:557–567. doi: 10.1016/S0140-6736(10)62037-5. [DOI] [PMC free article] [PubMed] [Google Scholar]
- 14.Hautvast JLA, Tolboom JJM, Luneta AK, van Staveren WA. Nutritional status and feeding patterns of rural preschool Zambian children living in different ecological areas. Ecology of Food and Nutrition. 1999;38(3):255–274. [Google Scholar]
- 15.Reich J, Tan M, Hart L, Thurma P, Grigorenko EL. Reading comprehension and its component skills in a resource-limited and liguistically complex setting: Learning to read in Zambia. ILearning Disabilities: From Prevailing Theories to Validated Practices. 2013;10(2):67–88. [Google Scholar]
- 16.Mumba EC. 2nd Pan-Commonwealth Forum on Open Learning. Durban, South Africa: 2002. Jul-Aug. Education for all: Increasing access to education for girls in Zambia. [Google Scholar]
- 17.Bracken BA, McCallum RS. Universal Nonverbal Intelligence Test. Itasca, IL: Riverside; 1998. [Google Scholar]
- 18.Kaufman AS. Manual for the Kaufman Assessment Battery for Children–Second Edition (KABC-II), Comprehensive Form. Circle Pines, MN: American Guidance Service; 2004. [Google Scholar]
- 19.Stasinopoulos DM, Rigby RA. Generalized additive models for location scale and shape (GAMLSS) in R. Journal of Statistical Software. 2007;23(7):1–46. [Google Scholar]
- 20.Rigby RA, Stasinopoulos DM. Generalized additive models for location, scale and shape. Applied Statistics. 2005;54(3):507–554. [Google Scholar]
- 21.The World Bank. Country and lending groups. [cited 2013 October 24];2013 Available from: http://data.worldbank.org/about/country-classifications/country-and-lending-groups-Low_income. [Google Scholar]
- 22.United Nations Office of the High Representative for the Least Developed Countries. [cited 2013 October 13];Landlocked Developing Countries and Small Island Developing States. 2013 Available from: http://www.unohrlls.org/en/ldc/. [Google Scholar]
- 23.International Fund for Agricultural Development. [cited 2013 November 4];Rural poverty in Zambia. 2013 Available from: http://www.ruralpovertyportal.org/country/home/tags/zambia. [Google Scholar]
- 24.Food and Agriculture Organization of the United Nations. [cited 2013 November 4];Nutrition country profiles, Republic of Zambia. 2013 Available from: http://www.fao.org/ag/agn/nutrition/Zmb_en.stm. [Google Scholar]
- 25.The Economist. No Swots, Please, We're Masai. 2002 Mar 21; Available from: http://www.economist.com/node/1048686. [Google Scholar]
- 26.Bini V, Celi F, Berioli MG, Bacosi ML, Stella P, Giglio P, et al. Body mass index in children and adolescence according to age and pubertal stage. European Journal of Clinical Nutrition. 2000;54(3):214–218. doi: 10.1038/sj.ejcn.1600922. [DOI] [PubMed] [Google Scholar]
- 27.Arija V, Esparó G, Fernández-Ballart J, Murphy MM, Biarnés E, Canals J. Nutritional status and performance in test of verbal and non-verbal intelligence in 6 year old children. Intelligence. 2006;34(2):141–149. [Google Scholar]
- 28.Yu ZB, Han SP, Cao XG, Guo XR. Intelligence in relation to obesity: a systematic review and meta-analysis. Obes Rev. 2010 Sep;11(9):656–670. doi: 10.1111/j.1467-789X.2009.00656.x. [DOI] [PubMed] [Google Scholar]
- 29.Rindermann H. The big g-factor of national cognitive ability. European Journal of Personality. 2007;21(5):767–787. [Google Scholar]
- 30.Lynn R, Meisenberg G. National IQs calculated and validated for 108 nations. Intelligence. 2010;38(4):353–360. [Google Scholar]
- 31.Lynn R, Mikk J. National differences in intelligence and educational attainment. Intelligence. 2007;35(2):115–121. [Google Scholar]
- 32.Rindermann H. The g-factor of international cognitive ability comparisons: the homogeneity of results in PISA, TIMSS, PIRLS and IQ-tests across nations. European Journal of Personality. 2007;21(5):667–706. [Google Scholar]
- 33.Lynn R, Vanhanen T. IQ and global inequality. Augusta, GA: Washington Summit Publishers; 2006. [Google Scholar]
- 34.Flynn JR. Massive IQ gains in 14 nations: What IQ tests really measure. Psychological Bulletin. 1987;101:171–191. [Google Scholar]
- 35.Lynn R. In support of the nutrition theory. In: Neisser U, editor. The rising curve: Long-term gains in IQ and related measures. Washington, DC: American Psychological Association; 1998. pp. 207–218. [Google Scholar]
- 36.Delay TC, Whaley SE, Sigman MD, Espinosa MP, Neumann C. IQ on the rise: The flynn effect in rural Kenyan children. Psychological Science. 2003;14(3):215–219. doi: 10.1111/1467-9280.02434. [DOI] [PubMed] [Google Scholar]
- 37.Ray R. The determinants of child labour and child schooling in Ghana. Journal of African Economies. 2003;11:561–590. [Google Scholar]
- 38.Hein S, Reich J, Grigorenko EL. Cultural manifestation of intelligence in formal and informal learning environments during childhood. In: Jensen LA, editor. The Oxford handbook of human development and culture: An interdisciplinary perspective Forthcoming. [Google Scholar]
- 39.The World Bank. Africa Development Indicators 2012/13. Washington, DC: The Word Bank; 2013. [Google Scholar]
- 40.Schaffnit-Chatterjee C. A brigt spot in spite of key challanges. Frankfurt am Main: Deutsche Bank; 2013. Sub-Saharan Africa. [Google Scholar]
- 41.Centers for Disease Control and Prevention. CDC growth charts: United States. [cited 2013 October 15];2000 May 30; Available from: http://www.cdc.gov/growthcharts/.
- 42.Wolrd Health Organization. Growth reference, BMI-for-age (5–19 years) [cited 2013 October 18];2007 Available from: http://www.who.int/growthref/who2007_bmi_for_age/en/.