Abstract
There is growing interest in studying the toxicity and health risk of exposure to multi-pollutant mixtures found in ambient air, and the U.S. Environmental Protection Agency (EPA) is moving towards setting standards for these types of mixtures. Additionally, the Health Effects Institute's strategic plan aims to develop and apply next-generation multi-pollutant approaches to understanding the health effects of air pollutants. There's increasing concern that conventional in vitro exposure methods are not adequate to meet EPA's strategic plan to demonstrate a direct link between air pollution and health effects. To meet the demand for new in vitro technology that better represents direct air-to-cell inhalation exposures, a new system that exposes cells at the air-liquid interface was developed. This new system, named the Gillings Sampler, is a modified two-stage electrostatic precipitator that provides a viable environment for cultured cells. Polystyrene latex spheres were used to determine deposition efficiencies (38-45%), while microscopy and imaging techniques were used to confirm uniform particle deposition. Negative control A549 cell exposures indicated the sampler can be operated for up to 4 hours without inducing any significant toxic effects on cells, as measured by lactate dehydrogenase (LDH) and interleukin-8 (IL-8). A novel positive aerosol control exposure method, consisting of a p-tolualdehyde (TOLALD) impregnated mineral oil aerosol (MOA), was developed to test this system. Exposures to the toxic MOA at a 1 ng/cm2 dose of TOLALD yielded a reproducible 1.4 and 2 fold increase in LDH and IL-8 mRNA levels over controls. This new system is intended to be used as an alternative research tool for aerosol in vitro exposure studies. While further testing and optimization is still required to produce a “commercially ready” system, it serves as a stepping-stone in the development of cost-effective in vitro technology that can be made accessible to researchers in the near future.
Keywords: Air-liquid interface exposures, Electrostatic air sampler, Aerosol toxicity
1. Introduction
The U.S. Environmental Protection Agency (EPA) is moving towards setting standards multi-pollutant mixtures found in ambient air [1, 2] and its strategic plan calls for demonstrating a direct link between air quality and health effects [1]. Furthermore, the Health Effects Institute (HEI) calls for the development and application of next-generation multi-pollutant approaches to understanding exposure to and health effects of air pollutants [3]. Animal inhalation exposure studies have been conducted in an effort to assess the toxic effects of inhaled aerosols and have been considered the “gold standard,” [4, 5] however, logistical and ethical reasons have led to demand a reduction and replacement of animal testing with alternate methods [5, 6]. For these reasons, there is a need to develop alternative in vitro methods and exposure systems which can provide new insights into the pollutant-cell interactions that lead to the observed adverse health effects in humans [7].
The standard method for traditional in vitro exposures studies relies on submerged culture conditions where the airborne pollutant is added to a culture medium and then directly added to cells [4, 5, 7, 8]. In this exposure method a particle dose is delivered to the cells in a liquid suspension, which alters the particles' physical and chemical characteristics [9, 10]. This method also assumes that all particles deposit over the cells' surface, but the number or mass of particles that actually interact with the cells cannot be determined [4]. What is needed is new in vitro technology that can quantify the dynamic changes in the toxicity of particles while maintaining their size, composition, and interaction with other gasses. The major challenge in developing an alternative to this method is achieving a direct air-to-cell inhalation exposure. In the last 15 years alternative exposure systems through the use of new in vitro technology have been developed where cells are exposed at an air-liquid interface (ALI), creating a more realistic air-to-cell inhalation exposure. These exposure systems allow the apical surface of the cells to be exposed to the air while the basolateral surface is nutritionally supported with culture media through a porous membrane [5, 11].
Various ALI exposure systems have been developed both in-house and commercially (Table 1) [6, 9, 12-18]. Each of the exposure systems shown in Table 1 uses different mechanisms to deposit particles, which include diffusion, sedimentation, cloud settling, and electrostatic precipitation. When developing this new technology, researchers ensured that basic conditions such as direct pollutant-cell interaction, tissue culture environments, and uniform exposures to pollutants were met [6, 19]. Using various test atmospheres, the ALI exposure systems were shown to be more sensitive than the traditional submerged culture conditions [10, 17, 20]. These test atmospheres varied and included photochemically-aged diesel exhaust, concentrated ambient coarse PM, and cookstove emissions, among others. While all exposure systems demonstrated basic deposition and showed a positive biological response after exposure, no standardized testing protocol has been established. The lack of standardized testing for ALI exposure systems and the limited availability of the in-house system to be shared with other research groups makes it difficult to fully compare the various systems to each other.
Table 1. Commercial and in-house air-liquid interface (ALI) exposure systems.
| ALI System | Deposition Mechanism | In Vitro Model | Particle Control | Negative Control | Reference |
|---|---|---|---|---|---|
| ALICE | Cloud Settling | A549 | Zinc Oxide | 10mM NaCL and 10mM Citrate Solutions | Lenz 2009 |
| Cultex CG | Diffussion and Sedimentation | HFBE21 | Titanium Dioxide; Diesel Soot | None | Aufderheide 2000 |
| Cultex RFS | Diffussion and Sedimentation | 16HBE14o- | Cigarette Smoke (K3R4F and K1R5F) | Clean Air | Aufderheide 2011 |
| EAVES | Electrostatic Precipitation | A549 | Diesel Exhaust | Clean Air and Polystyrene Latex Spheres | de Bruijne 2009 |
| EPDExS | Electrostatic Precipitation | Murine Alveolar Epithelial Cells (C10) | 1, 4-naphthoquinor | Titanium Dioxide and Polystyrene Latex Spheres | Stevens 2008 |
| NACIVT | Electrostatic Precipitation | BEAS-2B; Porcine Lung Macrophages | None | Polystyrene Latex Spheres | Savi 2008 |
| Modified EAVES | Electrostatic Precipitation | Normal Human Bronchial Epithelial (NHBE) Cells | Concentrated Coarse Ambient PM | Clean Air | Volckens 2009 |
| VitroCell | Diffussion and Sedimentation | A549 | None – VOCs only | Clean Air | Anderson 2010 |
| Whole-Smoke Perspex Chambers (BAT) | Electrostatic Precipitation | NCI-H292 | Cigarette Smoke (A, B, and 2R4F) | Clean Air | Phillips 2005 |
One method of evaluating the ALI exposure systems is to compare their deposition efficiencies. Not all exposure systems, however, used the same efficiency testing method making direct comparisons difficult. For example, the EAVES and modified-EAVES systems deposited fluorescent PSL spheres or ammonium fluorescein particles directly onto porous membranes and measured their fluorescence intensities, while the ALICE system uses quartz crystal microbalance to determine mass deposition. In addition to deposition testing, all ALI exposure systems were evaluated using a different toxic pollutant sources for cell exposures. Replicating the methods used for these systems can be problematic as detailed protocols might not always be described fully or the pollutant source, such as a combustion sources, makes it difficult to reproduce. For example, reproducing diesel exhaust emissions from an engine is challenging since the chemical and physical composition of the diesel exhaust can change due to the type of engine used, operating mode (idle vs. throttle), and source of diesel fuel. Comparison of cell exposure results from ALI exposure systems is further hampered by the varying in vitro models that were used (i.e. immortalized cell lines vs. primary cells), pollutant sources, and different doses of particles delivered to the cells. For these reasons attempting to compare the systems based on their toxicological results is highly problematic. A positive aerosol control method that can be reproduced by any research group is needed to adequately compare the various exposure systems that have been developed.
While the development of ALI exposure systems have contributed to advancing the knowledge of multi-pollutant exposure, these systems are also limited to a laboratory setting. Currently, there are no portable in vitro systems which can be deployed in a real-world setting. One of the objectives of this study is to introduce the development of a portable aerosol sampler to be used for conducting in vitro exposure studies at the air-liquid interface. The portable aerosol sampler presented here will be referred to as the Gillings Sampler. The Gillings Sampler was evaluated under controlled laboratory conditions and an overview of operating performance and efficacy is described in the following sections. The second objective of this study is to introduce the development of a positive aerosol control exposure method that can be used with any ALI exposure system. A demonstration of this new positive aerosol control exposure method will be presented next.
2. Methods
With the collaboration of the Environmental Sciences and Engineering (ESE) Design Center located in the Gillings School of Global Public Health, University of North Carolina at Chapel Hill, a prototype of the portable aerosol sampler was manufactured. Testing and evaluation of the Gillings Sampler was divided into three sub-phases: particle deposition testing, negative control testing, and positive control testing.
2.1 Air Sampler Components and Operating Conditions
The Gillings Sampler is comprised of three sub-systems: Electrical Enclosure System (EES), Heated Humidification System (HHS), and Cell Exposure System (CES). The principle mechanism to deposit particles directly onto cells using a two-stage electrostatic precipitator is described in Figure 1.
Figure 1.
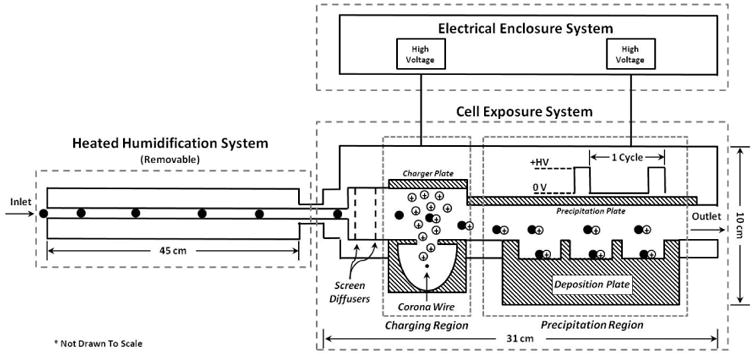
Side-view schematic of the Gillings Sampler. A vacuum pump on the sampler outlet pulls air through the device. Air first enters the Heated Humidification System where the air is warmed and humidified. The air then enters the Cell Exposure System where two perforated screens disperse the air into the charging region. In the charging region, a corona wire sitting below the flow path produces positive ions to electrically charge the incoming particles. The charged particles then enter the precipitation region where they are subjected to a positive electric field that forces the particles downwards onto the deposition plate. The particles deposit inside the wells of the deposition plate where cultured cells are exposed. The air then leaves via the outlet.
The EES is the source of power to both the CES and the HHS. All of the low and high voltage power supplies, as well as the temperature and humidity controllers, are safely housed in this compartment. The HHS was manufactured using commercially available components in the ESE Design Center. This removable system is used to pre-heat and moisten the incoming airflow before it reaches the cells, as required by the sampling conditions. If one were conducting a field study where the climate is hot and humid, for instance, the use of the HHS may not be needed. In human airways, inspired air is rapidly warmed and moistened mainly in the nasal cavities and remainder of the upper airways. Inspired air is warmed from around 20°C at the portal of entry to 31°C in the pharynx and 35°C in the trachea [21]. This system is, therefore, a critical component as it represents the pre-heating and humidification of inhaled air.
The CES was manufactured using commercially available components in the ESE Design Center. It is a modified, temperature-regulated (37°C), two-stage electrostatic precipitator. An electrical current is applied to the corona wire to produce a corona discharge that produces high concentrations of unipolar ions used to charge the incoming particles in the sampled flow [22, 23]. A high voltage is applied to the precipitation plate in a pulsed-precipitation pattern to generate an electric field, similar to that described by Liu and colleagues [23]. One precipitation cycle in this 2-part, pulsed-precipitation pattern consists of having the electric field turned off to allow the precipitation region to be filled with particles, followed by turning on the electric field for to force down the particles onto the collection area. The specified times in this cycle depend on the sample flow rate, electric field strength, and volume inside the CES. To help explain how this pulse-precipitation method to deposit particles works, a demonstration is shown in Figure 2. In the precipitation region, a 6-well or 9-well deposition plate allows 30 mm Millicell-CM membranes to be co-exposed. The multi-well deposition plates are composed of two parts; the compartmentalized well plate and a masking lid. The masking lid fits over the well plate and covers the cell culture media surrounding the inserts, minimizing evaporation and allowing for longer exposure times.
Figure 2.
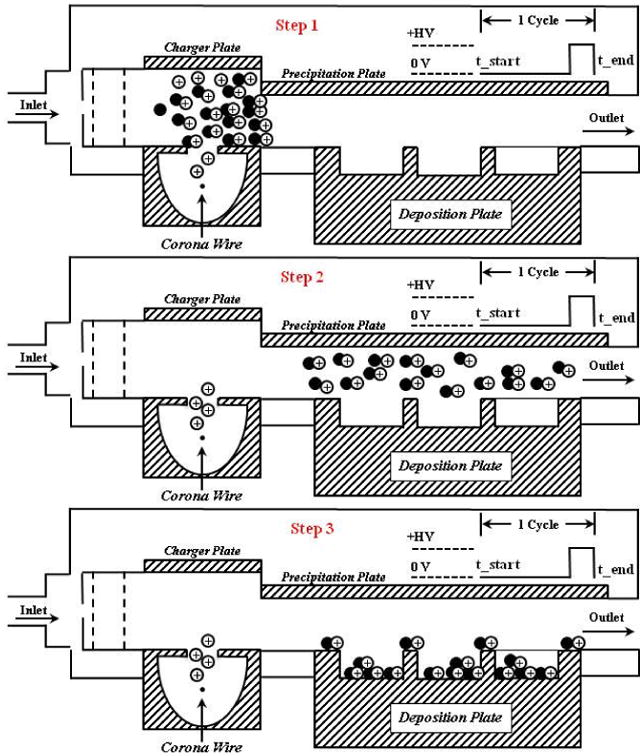
A demonstration of how one precipitation pattern occurs with an “air parcel” containing particles is shown here. One precipitation cycle in this 2-part, pulsed-precipitation pattern consists of having the electric field turned off to allow the precipitation region to be filled with particles, followed by turning on the electric field to force down the particles onto the collection area. At step 1, all the particles are in the charging section, above the corona wire. At step 2, the charged particles have “filled up” the volume over the deposition plate. At step 3, the end of the cycle, all particles have been deposited on the deposition plate. Most particles have deposited inside the wells where cultured cells will sit and some particles will deposit on the masking lid.
2.2 Particle Deposition Efficiency and Imaging Analysis
Particle deposition efficiency was calculated using fluorescent 200 nm standard microspheres. Polystyrene latex (PSL) spheres were selected as test particles since they have been used as calibration standards in other applications. The PSL spheres, referred to as YG-PSL spheres, (0.20 μm, Yellow-Green Fluoresbrite Microspheres, Polysciences, Inc.) were nebulized using a glass micro spray nebulizer to a concentration of ∼1 mg/m3. Prior to nebulization, 0.5 mL of the YG-PSL stock solution was diluted in 8 mL of HPLC-grade water. The nebulized aerosol flow passed through a charge neutralizer (model 3012, Kr-85, 2 mCi, 74 MBq, TSI, Inc.), then into a 20 L glass jar before sampling through the sampler, as previously described by de Bruijne [9]. A 25 mm diameter foil substrate was placed over each Millicell-CM membrane to collect the YG-PSL spheres. The YG-PSL spheres were sampled and collected for 1,000 precipitation cycles (91.7 minutes). After collection, the foil substrates were placed inside glass tubes filled with 5 mL of ethyl acetate to dissolve the YG-PSL spheres and release the fluorescent dye. Variations of this method have been used previously by others to test the efficiency of their systems [9, 24, 25]. Each sample was analyzed using a spectrofluorometer (FluoroLog, Horiba Scientific) at the peak excitation (440 nm) and emission (486 nm) wavelengths provided by the manufacturer.
A Teflon membrane filter (47 mm diameter; Pall Corporation) was used to collect YG-PSL spheres at the same flow rate and duration as the Gillings Sampler to determine the mass concentration in the air. The filter was weighed before and after to determine the total mass collected. A transmission electron microscope (TEM) grid was used to collect the YG-PSL spheres inside the Gillings Sampler. The impacted particles were then viewed directly on the grid in a Zeiss EM900 TEM at an accelerating voltage of 50 kilovolts (kV) to verify their particle diameter.
Two different imaging techniques were used to qualitatively assess the distribution of the deposited PSL spheres. These techniques also serve to demonstrate, as proof of principle, that the PSL spheres are in fact being collected on the membrane surface, ensuring that particles will be directly deposited on the cells during future exposures to PM. An infrared imaging system (Odyssey Imaging System; LI-COR Biosciences) was used to observe the PSL sphere deposition over the entire membrane area. To conduct this technique, a different set of 200 nm PSL spheres, referred to as IR-PSL, (200 nm, Red Fluorophorex Fluorescent Microspheres, Phosphorex, Inc.) was used. These IR-PSL spheres were nebulized as described above and collected directly onto the membrane. Prior to nebulization, 0.75 mL of the IR-PSL stock solution was diluted in 7 mL of HPLC-grade water. Episcopic fluorescence microscopy was used to observe the YG-PSL sphere deposition at a greater magnification. The YG-PSL spheres were collected directly on the membrane. Using an inverted light microscope configured for epifluorescence, the membrane was observed using an FITC filter block to reveal fluorescence of the YG-PSL spheres.
2.3 A549 Cell Cultures
The A549 cell line is a human pulmonary type II epithelial-like cell line derived from human alveolar cell carcinoma of the lung [26]. While an immortalized cell line may not be a perfect representative of the biological response of primary cells, the goal of this work was to test the development of new technology and exposure method. The A549 cells are reproducible, easy to culture on the Millicell-CM membranes, and provide a robust biological signal in response to pollutant exposures. These cells were, therefore, ideally suited for this work as it allows for reliable replication of experiments. Follow up studies using the Gillings Sampler will be conducted using models of primary cells.
A549 cells were grown on collagen-coated Millicell-CM membranes in F12-K media with 10% fetal bovine serum (FBS) plus 0.01% penicillin/streptomycin. Cells were plated at a density of 8.5 × 10⁵ cells per insert 28 hours prior to exposure and placed in commercial 6-well plates inside an incubator at 5% CO2. When the cells reached ∼80% confluency, 4 hours prior to exposure, the FBS-containing media was replaced with serum-free media containing F12-K media, 1.5 μg/mL bovine serum albumin, plus 0.01% penicillin/streptomycin. Immediately before exposures, the membranes were transferred to the 6-well deposition plate.
2.4 Negative Control Exposures
To effectively evaluate the Gillings Sampler, a series of clean air cell exposures were conducted at various operating configurations. The laboratory is equipped with a clean air generator, which was the source of air for all negative control tests. This source of clean air, or “zero air,” is produced from a 737-250 Pure Air Generator (AADCO Instruments). The 737 series Pure Air Generators contain <1 ppb ozone, methane, hydrocarbons, NO/NOx, H2S, SO2, COS, CO, CO2, SF6 and fluorocarbons while all PM is removed from the source air. No toxicity should be observed from any negative control exposures. In all tests, the exposures were conducted for 2,620 precipitation cycles (4 hours) at constant temperature (37°C), flow rate (2.2 L/minin), and relative humidity (RH) above 70%, and at 5% CO2. After each exposure, the Millicell-CM membranes were transferred to new commercially available 6-well tissue culture plates with 1.2 mL of fresh serum-free media in the basolateral side only and then placed into an incubator for an additional 9 hours to allow for the cells to produce and release biological markers of toxicity.
2.5 Positive Aerosol Control
In a previous study, a mineral oil aerosol (MOA) was generated to serve as a surrogate for organic-containing ambient PM [27]. In this study, Ebersviller and colleagues nebulized mineral oil into a 120 m3 smog chamber using a Collison nebulizer. This study showed that the MOA elicits no acute biological effects on A549 human lung epithelial cells. Later, p-tolualdehyde (TOLALD) was introduced into the chamber and allowed to mix with the MOA. The TOLALD partitioned on the MOA causing it to become toxic. When cells were exposed to a dose of 4.7–7.0 ng/cm2 of the toxic MOA, a 2.6 and 3.9 fold increases in inflammation and cytotoxicity levels were observed when compared to controls. This study showed that the MOA acted as a delivery mechanism to deposit TOLALD on the cells. More importantly, this simple mix consisted of one toxic component that is widely available. The existing method was modified to generate a toxic MOA on the bench top, instead of a smog chamber, making it easier for other researchers to use in a laboratory as a positive aerosol control for quality assurance testing of any ALI in vitro exposure system.
A toxic positive aerosol control was generated by starting with 100 mL of fresh, steri-filtered mineral oil (pharmaceutical grade, 100%). Each batch of mineral oil was steri-filtered in the laboratory, as described by Ebersviller and colleagues, [27] one day before to remove any particulate or biological contaminants. The steri-filtered mineral oil was kept sealed and stored overnight in a sterile laboratory. The mineral oil was then ready to be mixed with a toxic chemical. TOLALD is a semi-volatile species likely to be in both the gas and particle phases in the ambient environment [27]. It has also been shown to be a major component in diesel exhaust [28]. For these reasons and due to the successful results presented by Ebersviller and colleagues [27], TOLALD was selected as an appropriate compound. To generate a toxic mineral oil, 25 μL of TOLALD was injected directly into the 100 mL of mineral oil and mixed well. The mixed mineral oil containing TOLALD was then nebulized using a pint size Collison nebulizer [29], generating a toxic MOA. A schematic of the experimental setup is shown in Figure 3.
Figure 3.
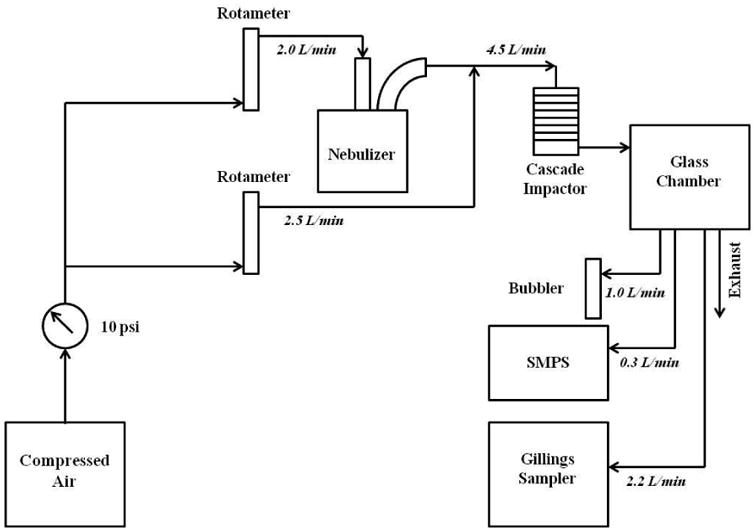
A schematic of the experimental set up used for mineral oil aerosol exposures. A clean air generator serves as the source of air. The mineral oil (with and without TOLALD) is first nebulized using a Collison nebulizer. Clean air is added to dilute the aerosol output which then enters a personal cascade impactor. The mineral oil aerosol is then introduced into a 3.8-liter glass chamber. The air sampled by the Gillings Sampler, the SMPS, and the midget impinger is drawn from the glass chamber.
A scanning mobility particle sizer (SMPS) was used to measure the size distribution of the aerosol. A midget impinger, used as a bubbler, was filled with 10 mL of o-(2,3,4,5,6-pentafluorobenzyl) hydroxylamine chloride (PFBHA) solution and sampled the mineral oil aerosol at 1 L/min for 2 hours during the cell exposure time. Analysis of the carbonyl content of these samples was conducted using the previously described protocol [10, 27]. Briefly, selective ion analysis for carbonyl containing compounds, including TOLALD, was performed with derivatization using PFBHA, gas chromatography and Ion Trap mass spectrometry as described by Yu et al., 1997 and Liu et al., 1999 [30, 31]. Samples were collected as described and analyzed using a Varian Saturn 2200 GCMS Ion Trap using a 60m × 0.32 mm × 0.5 micron RTX-5 fused-silica column (Restek), using temperature programming as described by Liu et al., 1999 [31]. Mass spectra of m/z=181 indicating aldehydes and ketones, and quantified with standards of pure compounds were used to produce the chromatograms shown.
2.6 Generating a Reproducible Positive Aerosol Control
Using the experimental setup described in Figure 3, an MOA was generated (with and without the addition of TOLALD) to expose the A549 cells to a reproducible aerosol. Mineral oil aerosolized with a Collison nebulizer produces a wide range of particle sizes. An eight-stage Marple Personal Cascade Impactor (New Start Environmental, LLC) was used in this setup to remove larger size particles (Figure 4). The personal cascade impactor can be replaced with any other size selective particle inlets as desired by the intended user. An aerosol concentration between 1.3-1.6 mg/m3, as measured by the SMPS and assuming a density of 0.85 g/cm3 for the mineral oil, was maintained throughout the exposure duration in all experiments. Figure 5 demonstrates that aerosol size and concentration is repeatable across all experiments.
Figure 4.
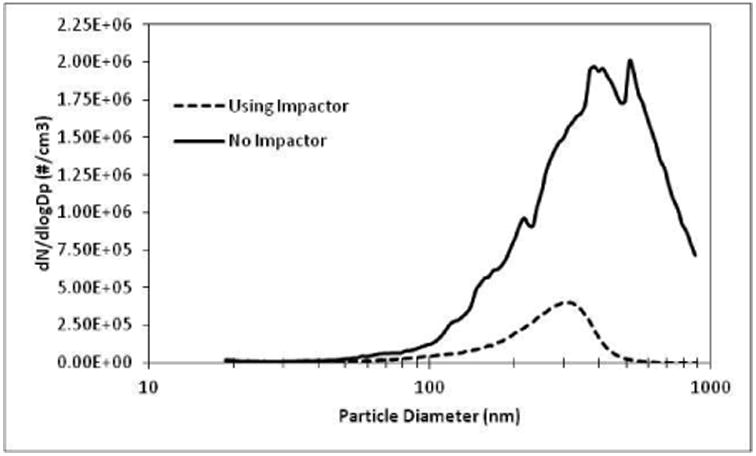
Number size distribution of the mineral oil aerosol was measured with and without a personal cascade impactor as a size selective inlet in the experimental setup.
Figure 5.
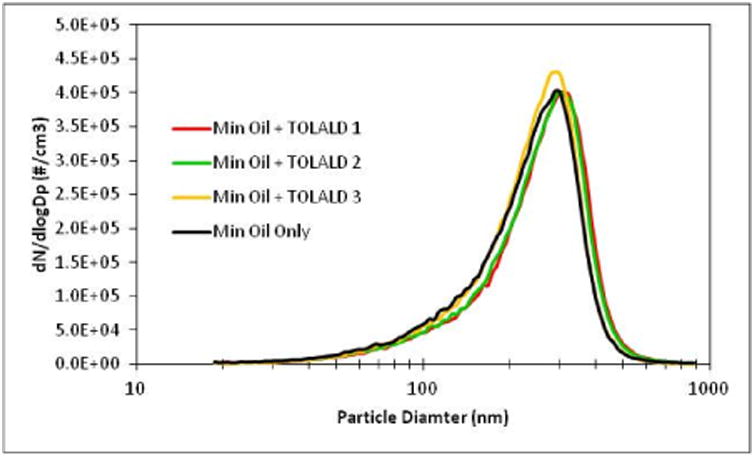
Number size distribution of the mineral oil aerosol for all experiments was measured with an SMPS for all experiments conducted. Repeatable size and concentrations were achieved.
The carbonyl content in the MOA was measured after collecting the aerosol sample in a PFBHA solution. Figure 6 shows the 3 chromatograms for each experiment containing TOLALD. As expected, only the TOLALD and the unreacted PFBHA are detected by GC-MS. By comparing the detected TOLALD to an internal standard, an average of dose of 8 ng of TOLALD was calculated to be delivered to each Millicell-CM insert based on the measured SMPS concentrations and efficiency calculated using the YG-PSL spheres.
Figure 6.
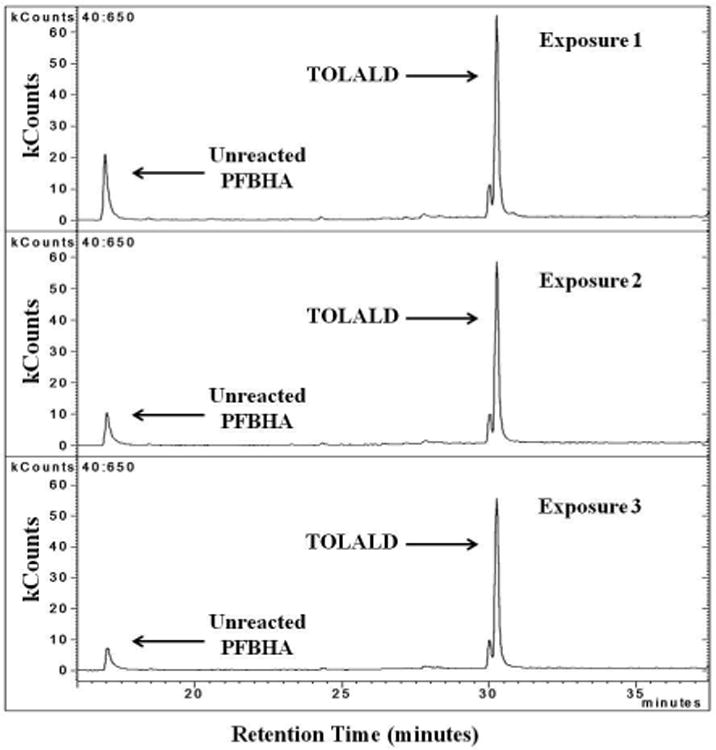
GC-MS chromatogram of m/z=181 from all three experiments containing TOLALD. The unreacted PFBHA is observed at retention time of 17 minutes. The TOLALD peak is detected at the retention time of about 30.5 minutes.
2.7 Positive Control Exposures
A549 cells were first exposed to fresh, steri-filtered mineral oil containing no TOLALD. This sham exposure served to assess if mineral oil itself induces any acute biological effects. Based on the study by Ebersviller and colleagues [27], it is expected that mineral oil elicits no acute biological effects from A549 cells. An exposure to the toxic MOA was then conducted using the Gillings Sampler. In total, three replicate exposures to the toxic MOA were conducted to test the reproducibility of the aerosol generation, aerosol size, TOLALD concentration, and measured toxicity. These exposures were conducted for 1,310 precipitation cycles (2 hours) at constant temperature (37°C), flow rate (2.2 L/minin), and relative humidity (RH) above 70%, and at 5% CO2. After each exposure, the Millicell-CM membranes were transferred to new commercially available 6-well tissue culture plates with 1.2 mL of fresh serum-free media in the basolateral side only and then placed into an incubator for an additional 9 hours to allow for the cells to produce and release biological markers of toxicity.
2.8 Biological Analysis
For each cell exposure conducted, a set of unexposed cells housed in an incubator were used as controls. The basolateral supernatants and total RNA were collected for each Millicell-CM sample (n=6) for toxicological analysis 9 hours post-exposure. Tot a l RNA was isolated from cells using Trizol (Invitrogen). Interleukin-8 (IL-8) protein, a marker of inflammation in the supernatant, was measured (in pg/mL) via enzyme-linked immunosorbent assay (ELISA; BD Biosciences). IL-8, among other cytokines, has been observed in humans when stressed by exposure to ozone and other air pollution mixtures in human clinical trials and measured in asthmatic and chronic obstructive pulmonary disease (COPD) patients [32-35], therefore it was selected as an appropriate endpoint for our study. An interference was observed in the IL-8 protein analysis using ELISA for the positive control exposures conducted (see Results section below), and as a result, IL-8 mRNA was measured in these samples only with quantitative real-time reverse-transcription polymerase chain reaction (qRT-PCR) and normalized against β-actin mRNA levels to obtain an accurate biological expression level. Cytotoxicity was measured via levels of lactate dehydrogenase (LDH) in the collected basolateral supernatant using a coupled enzymatic assay that measures relative absorbance (Takara Bio Inc.). IL-8 and LDH have been shown in previous studies [9, 10, 27, 36-38] by our research group to be appropriate endpoints of inflammation and cytotoxicity therefore they were selected as appropriate endpoints for this study. These endpoints serve to demonstrate the efficacy of the Gillings Sampler; different endpoints for any in vitro model can be selected for any other research needs. Data for LDH and IL-8 are presented as the mean ± standard error from the mean and expressed as fold increase over control. Data were analyzed using an unpaired Student's t-test and ANOVA where differences were considered significant if p ≤ 0.05.
3. Results
3.1 Particle Deposition Efficiency
YG-PSL spheres were collected on a TEM grid and observed under a TEM to verify that the particle diameter of 200 nm with a coefficient of variability (CV) of 5% stated by the manufacturer was true. Using TEM, it was observed that an individual YG-PSL sphere had a diameter of 214 nm. The YG-PSL spheres were then nebulized and collected on inserts using the Gillings Sampler to determine the particle collection efficiency for these size particles. The mass collected was then quantified using a spectrofluorometer. The particle deposition efficiency (η) was calculated to be 45% for the 6-well deposition plate (CV = 24.5%), and 38% (CV = 28.7%) for the 9-well deposition plate using the equation below.
Here, efficiency is defined as the average mass collected (Mc) on a specified collection area over the total mass (Mt) in the volume sampled above that collection area. The collection area of interest is the Millicell-CM membrane growth area. We are only interested in how much PM is delivered to the membrane growth area. It is assumed the sampled air is uniformly distributed over the entire CES. To calculate the total particle mass in the volume sampled, the particle concentration (Cp) and total volume (Vt) must be known. The particle concentration (Cp) was determined by quantifying the mass collected with a Teflon filter over a specified period of time. Since the Gillings Sampler was operated with a pulsed deposition voltage, the volume of aerosol sampled is independent of the aerosol flow rate and depends only on the collection area (A) of the collecting surface, the distance (H) from the collection surface to the precipitation plate, and the number of precipitation cycles (n) [23, 39].
3.2 Qualitative Analysis of Particle Deposition
Two techniques were used to visually confirm the collection of the PSL spheres on the membranes at different magnification levels. First, IR-PSL spheres were collected directly onto the membranes and were observed using an infrared imaging system (Figure 7A & 7B). This technique allowed the entire 4.2 cm2 surface area of the membrane to be visualized at once, and it can be seen that the IR-PSL spheres deposit over the entire surface. Episcopic fluorescence microscopy was then used to observe YG-PSL sphere deposition at 20 times magnification (Figure 7C) and the randomly distributed deposition of the YG-PSL spheres was verified. After observing the images in Figure 7, it is clear that particle deposition does take place and is randomly distributed over the surface area of each Millicell-CM membrane.
Figure 7.
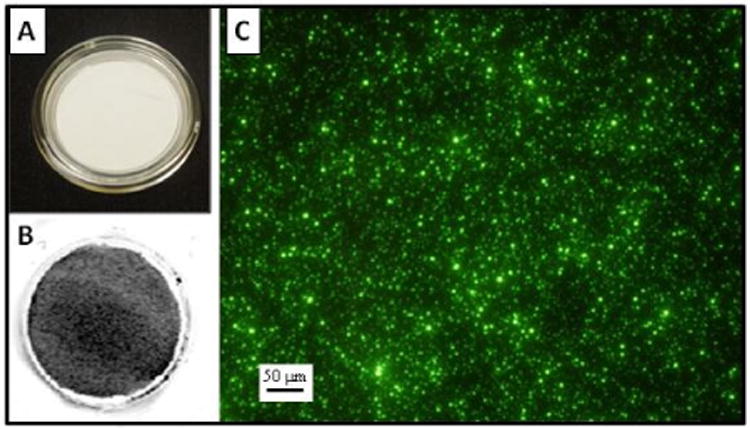
Infrared and episcopic fluorescence images are observed here: A) View of a new Millicell-CM membrane without magnification. B) View of an infrared image of the IR-PSL spheres collected on a Millicell-CM membrane without magnification. The gray shades indicate fluorescence of the IR-PSL spheres. C) An episcopic fluorescence image of YG-PSL spheres collected on a Millicell-CM membrane at 20× magnification over a randomly selected area of the membrane.
3.3 Negative Control Exposures to Clean Air
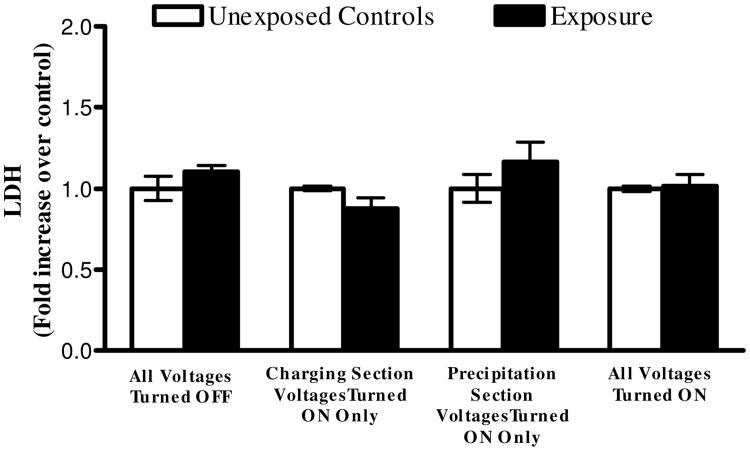
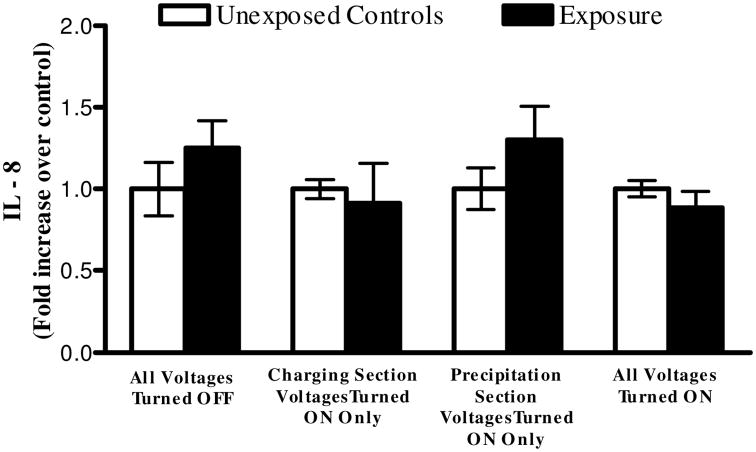
A series of cell exposures to clean air were conducted at various operating conditions (two independent experiments for each condition) of Gillings Sampler. Cells were first exposed to clean air while all high voltages remained turned off. This allowed us to investigate any potential problems with cell culture media evaporation that could lead to cell desiccation. No statistical difference in LDH and IL-8 levels between controls and exposures were observed. Cells were then exposed with the high voltages applied to the charging section of the CES only to investigate any potential toxicity from the O3 produced during corona discharge. An average O3 concentration of 69 parts per billion (ppb) was measured at the outlet of the sampler during the 4 hours the charging section was powered on. Again, no difference in LDH and IL-8 levels was observed. Next, cells were exposed with only the high voltage applied to the precipitation plate to address potential toxicity interference from the electric field. No difference in LDH and IL-8 expression levels was observed. From these data, it was determined that the individual components and parameters of the Gillings Sampler do not induce any elevated levels of cytotoxicity and inflammation, as measured by LDH and IL-8. One last exposure was conducted with all high voltages turned on to verify that when all components are working together there are no potential LDH and IL-8 responses resulting from the Gillings Sampler itself. These results validate that the Gillings Sampler can be operated for up to 4 hours with all the high voltages turned on without inducing adverse effects on the cells for these measured endpoints (Figures 8 and 9).
Figure 8.
Fold increase in cytotoxicity, as measured by LDH in the basolateral media, from 4-hour long (2,620 cycles) exposures to clean air using the Gillings Sampler at various operational conditions. No statistical difference observed when comparing exposed cells to unexposed controls under any conditions. Data shown is the mean of two independent experiments for each condition (n=6 for each independent condition). Data is presented as the mean ± standard error from the mean.
Figure 9.
Fold increase in inflammation, as measured by IL-8 in the basolateral media, from 4-hour long (2,620 cycles) exposures to clean air using the Gillings Sampler at various operational conditions. No statistical difference observed when comparing exposed cells to unexposed controls under any conditions. Data shown is the mean of two independent experiments for each condition (n=6 for each independent condition). Data is presented as the mean ± standard error from the mean.
3.4 Exposure to Positive Aerosol Control Induces Reproducible Toxicity
The goal of the first experiment was to confirm that exposure to mineral oil alone does not induce any acute biological effects. Cells were initially exposed to the MOA without the addition of TOLALD (two independent exposures). Analysis of the LDH levels was conducted in the basolateral media for both the unexposed cells and cells exposed to the mineral oil. The results from this analysis demonstrate that there is no statistical significant difference in the LDH levels observed from the unexposed and exposed cells. Using qRT-PCR, IL-8 mRNA levels were analyzed for the unexposed and exposed cells. Results from this analysis show small, but statistically significant increase in the exposed cells (Figure 10).
Figure 10.
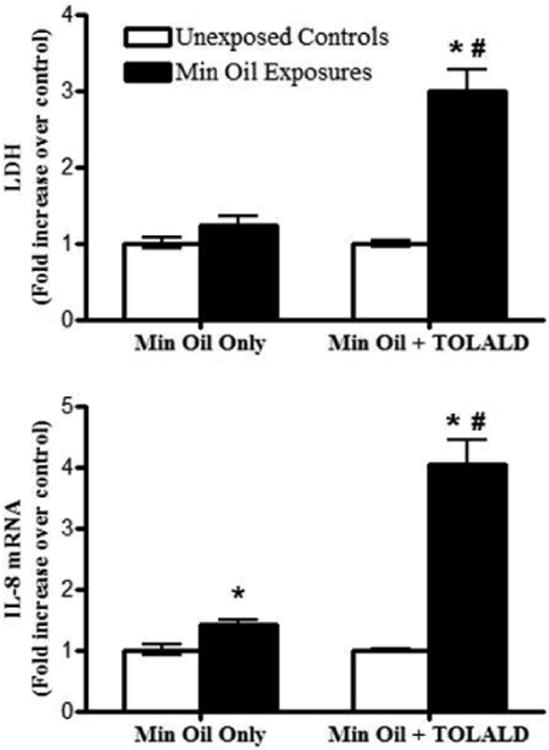
Fold increase in LDH (measured in basolateral media) and IL8 mRNA levels of exposures to mineral oil only and mineral oil with TOLALD compared to their respective controls. The asterisk symbol (*) indicates a statistically significant difference (t-test; p < 0.05) over unexposed controls. The pound sign (#) indicates a statistically significant difference (t-test; p < 0.05) between the mineral oil only exposure and the mineral oil with TOLALD exposure. Data shown for “Min Oil Only” is the mean of two independent experiments (n=6 for each independent experiment). Data shown for “Min Oil + TOLALD” is from one independent experiment (n=6). Data is presented as the mean ± standard error from the mean.
Since mineral oil alone did not induce drastic changes in LDH and IL-8 mRNA level, a cell exposure was then conducted using the MOA containing TOLALD. Again, their LDH and IL-8 mRNA levels were analyzed and the results are shown in Figure 10. As can be seen, the MOA containing TOLALD is more toxic to the cells as a 3 and 4 fold increase over control is observed in the LDH and IL-8 mRNA levels. These results are comparable to those by Ebersviller and colleagues mentioned previously.
Since positive results were obtained from exposing cells to the toxic MOA containing TOLALD, two more independent exposures were then conducted to determine if reproducible biological results could be obtained. A total of 3 independent exposures to the MOA containing TOLALD were conducted. The LDH and IL-8 mRNA expression levels were analyzed and compared to each exposure to determine their reproducibility. As stated above, an average of dose 8 ng of TOLALD (or 1.9 ng/cm2) was delivered to each membrane containing cells. Normalizing their LDH and IL-8 mRNA expression levels to the TOLALD dose delivered, we can observe the fold increase associated with each biological endpoint. On average, a 1.4 fold increase in LDH levels over unexposed controls is measured per 1 ng/cm2 dose of TOLALD delivered to the cells (Figure 11). Similarly, on average, a 2 fold increase in IL-8 mRNA levels over unexposed controls is measured per 1 ng/cm2 dose of TOLALD (Figure 11). In each of the two endpoints measured, there is no statistical difference across the 3 exposures conducted. These results confirm our hypothesis that we can accurately reproduce a biological response when using a controlled and reproducible aerosol source.
Figure 11.
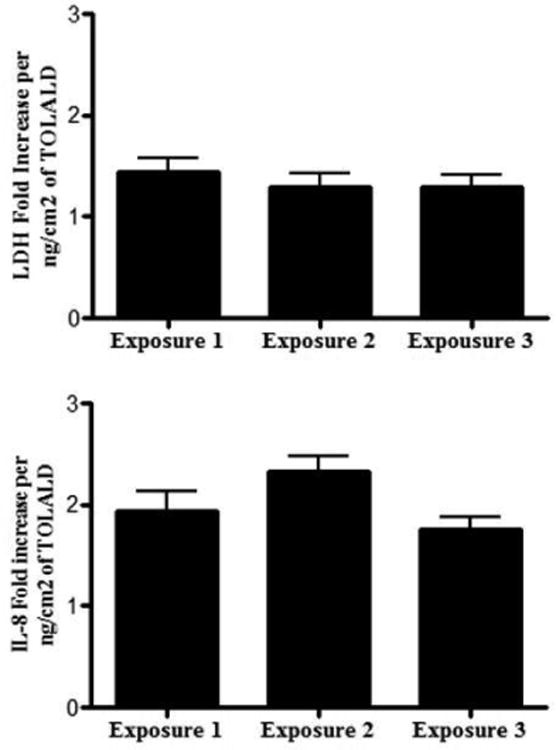
Fold increase in LDH (measured in basolateral media) and IL-8 mRNA levels of exposures mineral oil with TOLALD compared to their respective controls for every ng/cm2 of TOLALD dose delivered to the cells. ANOVA analysis indicates no statistical difference across the 3 exposures (n=6 for each exposure). Data is presented as the mean ± standard error from the mean.
For the negative control exposures conducted, IL-8 protein was measured in the supernatant via ELISA. Previous studies, however, have shown that the carbonaceous particles and engineered nanomaterials can interfere with the ELISA assay [40-42] whereby cytokines bind to the particles and can no longer be detected in the supernatant. Therefore, quantitative real-time reverse-transcription polymerase chain reaction (qRT-PCR) is the preferred analysis tool for these types of exposures. After conducting exposures to the mineral oil aerosol (MOA), IL-8 protein results indicated that interference with the biochemistry of the ELISA also occurs when using the MOA. Measurement of IL-8 protein via ELISA was not possible since the cytokines seem to also bind to the deposited MOA and therefore qRT-PCR analysis was conducted for these exposures only.
4. Discussion
The Gillings Sampler was manufactured and assembled using commercially available components, such as power supplies, heaters, and controllers, and using electrostatic precipitation as its principle of operation. The use of heaters and temperature controllers allows the temperature throughout the entire system to be maintained at 37°C, while the use of the HHS allows the sampler to be operated at optimal RH conditions. The temperature and humidity regulation system implemented in the Gillings Sampler introduces a portability feature that allows for potential usage in a wide range of settings. In an effort to provide the flexibility to co-expose multiple commercially available tissue inserts, interchangeable deposition plates were developed. These deposition plates can be customized to fit multiple configurations. These unique deposition plates provide researchers the flexibility to conduct time-series studies, co-expose multiple cell types, or simply increase their statistical power with a higher number of samples.
One of the biggest concerns in these types of exposure systems is the distribution of particle deposition within each membrane insert. A difficult task is to ensure that cells within each membrane are uniformly exposed to the particles. It is not ideal, for example, if particle deposition is localized, for example, in the center or at the edges of the membrane. The infrared image obtained using the IR-PSL was crucial to this work as it provided visualization of the particle deposition distribution over the entire area. From this observation, it was determined that the Gillings Sampler adequately deposits particles across the entire 4.2 cm2 membrane area. Testing individual components of the Gillings Sampler demonstrated that the instrument itself does not induce toxicity, based on the biological endpoints measured. Additionally, the Gillings Sampler was operated successfully for up to 4 hours. The two main concerns that could have limited the maximum exposure time were media evaporation and the O3 generated by the corona wire. The plate design has a masking lid fitted over the cell culture media surrounding the inserts. This design significantly decreases evaporation, thereby allowing for longer exposure times. The 69 ppb of ozone produced by the corona wire proved to be insignificant as it did not increase the cytotoxicity and inflammation expression levels measured.
While we are satisfied with the particle deposition results obtained with this first prototype, future efforts will be aimed at increasing deposition efficiency and reducing variability of deposition from insert to insert. Increasing the deposition efficiency can be achieved by improving electrical charging of the incoming particles. Currently, two diffuser screens are placed in the flow path to disperse the incoming aerosol over the entire volume inside the CES. Visual inspection of the deposition inside the entire CES indicates that the diffuser screens are not dispersing the flow as uniformly as expected. Redesigning the inlet head of the sampler can help with better flow dispersion resulting in less insert to insert variation.
As discussed previously, there is a lack of standardized testing to determine the efficacy of exposing cells to airborne PM using ALI exposure systems that have been introduced in recent years. The new positive aerosol control method described here can be used as a standardized method for comparing the efficacy of various ALI exposure systems, it can also serve as a quality assurance test for each ALI exposure system. By conducting this reproducible positive aerosol control test on a regular basis, as a quality assurance or “calibration” test, researchers can assure themselves that their ALI exposure system is operating at optimal conditions. It would be also be important to test other cell lines to determine if we can also obtain reproducible biological results and determine if they are more or less sensitive than A549 cells. While this is an initial attempt to develop a positive aerosol control, we have demonstrated a promising method that, once refined, can serve as both a standardized test and a quality assurance test for ALI exposure systems.
Further testing and optimization is still required to produce a “field deployable” and “commercially ready” in vitro system. The Gillings Sampler, however, is a stepping-stone in the development of cost-effective in vitro technology that can be made accessible to researchers in the near future.
Supplementary Material
Highlights.
We developed an electrostatic air sampler to expose cells at the air-liquid interface
We developed a reproducible positive aerosol control method for cell exposures
The biological results are reproducible when exposing to positive aerosol control
The particle deposition efficiency on the cells was calculated to be 38-45%
Acknowledgments
This work was supported in part by grants from the National Institute of Environmental Health Sciences (T32 ES007018, R01 ES15241-S1, and R01 ES013611), the Gillings School of Global Public Health's Gillings Innovation Laboratory Program for Research and Innovations Solutions. We thank Missy Brighton from the Center for Environmental Medicine, Asthma, and Lung Biology (CEMALB), David Leith, the Cory Laboratory, and the Fry Laboratory from the Department of Environmental Sciences and Engineering (ESE) at the University of North Carolina at Chapel Hill (UNC-CH) for all their technical advice and use of laboratory equipment.
Footnotes
Publisher's Disclaimer: This is a PDF file of an unedited manuscript that has been accepted for publication. As a service to our customers we are providing this early version of the manuscript. The manuscript will undergo copyediting, typesetting, and review of the resulting proof before it is published in its final citable form. Please note that during the production process errors may be discovered which could affect the content, and all legal disclaimers that apply to the journal pertain.
References
- 1.Board of Scientific Counselors (BOSC) Mid-Cycle Review of the Office of Research and Development's Air Research Program at the US Environmental Protection Agency. U S Environmental Protection Agency; 2008. [Google Scholar]
- 2.Dominici F, et al. Protecting human health from air pollution: shifting from a single-pollutant to a multi-pollutant approach. Epidemiology (Cambridge, Mass.) 2010;21(2):187. doi: 10.1097/EDE.0b013e3181cc86e8. [DOI] [PMC free article] [PubMed] [Google Scholar]
- 3.Health Effects Institute (HEI) HEI Strategic Plan for Understanding Health Effects of Air Pollution 2010-2015. Boston, MA: HEI; 2010. [Google Scholar]
- 4.Akhtar US, et al. In vivo and in vitro assessment of particulate matter toxicology. Urban Airborne Particulate Matter. 2011:427–449. [Google Scholar]
- 5.Paur HR, et al. In-vitro cell exposure studies for the assessment of nanoparticle toxicity in the lung-a dialogue between aerosol science and biology. Journal of Aerosol Science. 2011;42(10):668–692. [Google Scholar]
- 6.Aufderheide M, et al. Analytical in vitro approach for studying cyto-and genotoxic effects of particulate airborne material. Analytical and bioanalytical chemistry. 2011;401(10):3213–3220. doi: 10.1007/s00216-011-5163-4. [DOI] [PMC free article] [PubMed] [Google Scholar]
- 7.Devlin RB, Frampton ML, Ghio AJ. In vitro studies: what is their role in toxicology? Experimental and toxicologic pathology : official journal of the Gesellschaft fur Toxikologische Pathologie. 2005;57 Suppl 1:183–8. doi: 10.1016/j.etp.2005.05.018. [DOI] [PubMed] [Google Scholar]
- 8.Seagrave JC, McDonald JD, Mauderly JL. In vitro versus in vivo exposure to combustion emissions. Experimental and Toxicologic Pathology. 2005;57:233–238. doi: 10.1016/j.etp.2005.05.011. [DOI] [PubMed] [Google Scholar]
- 9.de Bruijne K, et al. Design and testing of electrostatic aerosol in vitro exposure system (EAVES): an alternative exposure system for particles. Inhal Toxicol. 2009;21(2):91–101. doi: 10.1080/08958370802166035. [DOI] [PubMed] [Google Scholar]
- 10.Lichtveld K, et al. In vitro exposures in diesel exhaust atmospheres: Resuspension of PM from filters versus direct deposition of PM from air. Environmental Science & Technology. 2012;46(16):9062–9070. doi: 10.1021/es301431s. [DOI] [PMC free article] [PubMed] [Google Scholar]
- 11.Dvorak A, et al. Do airway epithelium air-liquid cultures represent the in vivo airway epithelium transcriptome? American journal of respiratory cell and molecular biology. 2011;44(4):465. doi: 10.1165/rcmb.2009-0453OC. [DOI] [PMC free article] [PubMed] [Google Scholar]
- 12.Anderson SE, et al. Evaluation of dicarbonyls generated in a simulated indoor air environment using an in vitro exposure system. Toxicological Sciences. 2010;115(2):453–461. doi: 10.1093/toxsci/kfq067. [DOI] [PMC free article] [PubMed] [Google Scholar]
- 13.Aufderheide M, Mohr U. CULTEX - an alternative technique for cultivation and exposure of cells of the respiratory tract to airborne pollutants at the air/liquid interface. Experimental and Toxicologic Pathology. 2000;52(3):265–270. doi: 10.1016/S0940-2993(00)80044-5. [DOI] [PubMed] [Google Scholar]
- 14.Lenz AG, et al. A dose-controlled system for air-liquid interface cell exposure and application to zinc oxide nanoparticles. Particle and fibre toxicology. 2009;6:32. doi: 10.1186/1743-8977-6-32. [DOI] [PMC free article] [PubMed] [Google Scholar]
- 15.Phillips J, et al. Exposure of bronchial epithelial cells to whole cigarette smoke: assessment of cellular responses. Alternatives to laboratory animals : ATLA. 2005;33(3):239–48. doi: 10.1177/026119290503300310. [DOI] [PubMed] [Google Scholar]
- 16.Savi M, et al. A novel exposure system for the efficient and controlled deposition of aerosol particles onto cell cultures. Environmental Science & Technology. 2008;42(15):5667–5674. doi: 10.1021/es703075q. [DOI] [PubMed] [Google Scholar]
- 17.Volckens J, et al. Direct particle-to-cell deposition of coarse ambient particulate matter increases the production of inflammatory mediators from cultured human airway epithelial cells. Environmental Science & Technology. 2009;43(12):4595–4599. doi: 10.1021/es900698a. [DOI] [PMC free article] [PubMed] [Google Scholar]
- 18.Stevens J, et al. A new method for quantifiable and controlled dosage of particulate matter for in vitro studies: The electrostatic particulate dosage and exposure system (EPDExS) Toxicology in Vitro. 2008;22(7):1768–1774. doi: 10.1016/j.tiv.2008.05.013. [DOI] [PubMed] [Google Scholar]
- 19.Aufderheide M, et al. The CULTEX RFS: A comprehensive technical approach for the in vitro exposure of airway epithelial cells to the particulate matter at the air-liquid interface. BioMed Research International. 2013;2013:734137. doi: 10.1155/2013/734137. [DOI] [PMC free article] [PubMed] [Google Scholar]
- 20.Hawley B, Volckens J. Proinflammatory effects of cookstove emissions on human bronchial epithelial cells. Indoor air. 2013;23(1):4–13. doi: 10.1111/j.1600-0668.2012.00790.x. [DOI] [PMC free article] [PubMed] [Google Scholar]
- 21.Morris JB, Shusterman D. Target organ toxicology series. New York: Informa Healthcare USA; 2010. Toxicology of the nose and upper airways. [Google Scholar]
- 22.Hinds WC. Aerosol technology : properties, behavior, and measurement of airborne particles. 2nd. New York: Wiley; 1999. [Google Scholar]
- 23.Liu BYH, Whitby KT, Yu HHS. Electrostatic aerosol sampler for light and electron microscopy. Review of Scientific Instruments. 1967;38(1):100–102. doi: 10.1063/1.1720491. [DOI] [PubMed] [Google Scholar]
- 24.Sillanpää M, et al. High collection efficiency electrostatic precipitator for in vitro cell exposure to concentrated ambient particulate matter (PM) Journal of Aerosol Science. 2008;39(4):335–347. [Google Scholar]
- 25.Han B, et al. Efficient Collection of Atmospheric Aerosols with a Particle Concentrator - Electrostatic Precipitator Sampler. Aerosol Science and Technology. 2009;43(8):757–766. [Google Scholar]
- 26.Jaspers I, Flescher E, Chen L. Ozone-induced IL-8 expression and transcription factor binding in respiratory epithelial cells. American Journal of Physiology-Lung Cellular and Molecular Physiology. 1997;272(3):L504. doi: 10.1152/ajplung.1997.272.3.L504. [DOI] [PubMed] [Google Scholar]
- 27.Ebersviller S, et al. Gaseous VOCs rapidly modify particulate matter and its biological effects - Part 1: Simple VOCs and model PM. Atmos Chem Phys. 2012;12:12277–12292. doi: 10.5194/acpd-12-5065-2012. [DOI] [PMC free article] [PubMed] [Google Scholar]
- 28.Grosjean D, Grosjean E, Gertler AW. On-road emissions of carbonyls from light-duty and heavy-duty vehicles. Environmental Science & Technology. 2001;35(1):45–53. doi: 10.1021/es001326a. [DOI] [PubMed] [Google Scholar]
- 29.May K. The Collison nebulizer: description, performance and application. Journal of Aerosol Science. 1973;4(3):235–243. [Google Scholar]
- 30.Yu J, Jeffries HE, Sexton KG. Atmospheric photooxidation of alkylbenzenes—I. Carbonyl product analyses. Atmospheric Environment. 1997;31(15):2261–2280. [Google Scholar]
- 31.Liu X, Jeffries HE, Sexton KG. Hydroxyl radical and ozone initiated photochemical reactions of 1, 3-butadiene. Atmospheric Environment. 1999;33(18):3005–3022. [Google Scholar]
- 32.Bosson J, et al. Ozone-induced bronchial epithelial cytokine expression differs between healthy and asthmatic subjects. Clin Exp Allergy. 2003;33(6):777–82. doi: 10.1046/j.1365-2222.2003.01662.x. [DOI] [PubMed] [Google Scholar]
- 33.Gerritsen WB, et al. Markers of inflammation and oxidative stress in exacerbated chronic obstructive pulmonary disease patients. Respir Med. 2005;99(1):84–90. doi: 10.1016/j.rmed.2004.04.017. [DOI] [PubMed] [Google Scholar]
- 34.Holgate ST, et al. Health effects of acute exposure to air pollution. Part I: Healthy and asthmatic subjects exposed to diesel exhaust. Res Rep Health Eff Inst. 2003;(112):1–30. discussion 51-67. [PubMed] [Google Scholar]
- 35.Ordonez CL, et al. Increased neutrophil numbers and IL-8 levels in airway secretions in acute severe asthma: Clinical and biologic significance. Am J Respir Crit Care Med. 2000;161(4 Pt 1):1185–90. doi: 10.1164/ajrccm.161.4.9812061. [DOI] [PubMed] [Google Scholar]
- 36.Doyle M, et al. Effects of 1,3-butadiene, isoprene, and their photochemical degradation products on human lung cells. Environ Health Perspect. 2004;112(15):1488–95. doi: 10.1289/ehp.7022. [DOI] [PMC free article] [PubMed] [Google Scholar]
- 37.Doyle M, et al. Atmospheric photochemical transformations enhance 1,3-butadiene-induced inflammatory responses in human epithelial cells: The role of ozone and other photochemical degradation products. Chem Biol Interact. 2007;166(1-3):163–9. doi: 10.1016/j.cbi.2006.05.016. [DOI] [PubMed] [Google Scholar]
- 38.Sexton KG, et al. Photochemical products in urban mixtures enhance inflammatory responses in lung cells. Inhal Toxicol. 2004;16 Suppl 1:107–14. doi: 10.1080/08958370490443196. [DOI] [PubMed] [Google Scholar]
- 39.Liu BYH, Verma AC. Pulse-charging, pulse-precipitating electrostatic aerosol sampler. Analytical Chemistry. 1968;40(4):843–847. [Google Scholar]
- 40.Kocbach A, et al. Differential binding of cytokines to environmentally relevant particles: A possible source for misinterpretation of in vitro results? Toxicology letters. 2008;176(2):131–137. doi: 10.1016/j.toxlet.2007.10.014. [DOI] [PubMed] [Google Scholar]
- 41.Kroll A, et al. Interference of engineered nanoparticles with in vitro toxicity assays. Archives of toxicology. 2012;86(7):1123–1136. doi: 10.1007/s00204-012-0837-z. [DOI] [PubMed] [Google Scholar]
- 42.Seagrave J, et al. Diesel particulate material binds and concentrates a proinflammatory cytokine that causes neutrophil migration. Inhalation toxicology. 2004;16(s1):93–98. doi: 10.1080/08958370490443178. [DOI] [PubMed] [Google Scholar]
Associated Data
This section collects any data citations, data availability statements, or supplementary materials included in this article.


