

Abstract
Background
Oxytocin is a neuropeptide that is involved in the regulation of mood, anxiety and social biology. Genetic variation in the oxytocin receptor gene (OXTR) has been implicated in anxiety, depression and related stress phenotypes. It is not yet known whether OXTR interacts with other risk factors such as early life trauma to heighten the severity of experienced anxiety and depression.
Methods
In this study, we examined genotypes in 653 individuals and tested whether SNP variation in OXTR correlates with severity of features of self-reported experience on the Depression Anxiety and Stress Scale (DASS), and whether this correlation is enhanced when early life trauma is taken into account. We also assessed the effects of OXTR SNPs on RNA expression levels in two separate brain tissue cohorts totaling 365 samples.
Results
A significant effect of OXTR genotype on DASS anxiety, stress and depression scores was found and ELS events, in combination with several different OXTR SNPs, were significantly associated with differences in DASS scores with one SNP (rs139832701) showing significant association or a trend towards association for all three measures. Several OXTR SNPs were correlated with alterations in OXTR RNA expression and rs3831817 replicated across both sets of tissues.
Conclusions
These results support the hypothesis that the oxytocin system plays a role in the pathophysiology of mood and anxiety disorders.
Keywords: Depression, anxiety, stress, oxytocin, DASS scale, SNP, RNA expression
Background
Oxytocin (OXT) is a mammalian hormone that is best known for its role in lactation, parturition and maternal behavior. It is synthesized in the hypothalamic paraventricular and supraoptic nuclei, transported to the posterior pituitary and released into the general circulation. It is also found in extra-hypothalamic brain areas. OXT has been shown to exert effects on memory (de Wied, Diamant, & Fodor, 1993; Lerer et al., 2008a), anxiety (Heinrichs, Baumgartner, Kirschbaum, & Ehlert, 2003) and social interaction (Kosfeld, Heinrichs, Zak, Fischbacher, & Fehr, 2005; Uvnas-Moberg, 1998). OXT concentrations in plasma and cerebrospinal fluid (CSF) have been reported to have an inverse relationship with measures of aggression (Lee, Ferris, Van de Kar, & Coccaro, 2009), suicidality (Lee et al., 2009), and depression (Scantamburlo et al., 2007).
Of direct relevance to the current study, decreased CSF OXT concentrations were observed in women with a history of childhood abuse, particularly associated with emotional abuse (Heim et al., 2009). In contrast, higher plasma OXT levels are associated with higher social anxiety symptom severity in a cohort of patients with Generalized Social Anxiety Disorder (Hoge, Pollack, Kaufman, Zak, & Simon, 2008).
Oxytocin receptors (OXTR) are localized in hypothalamic and extra-hypothalamic brain regions including the cerebral cortex. The human OXTR gene is located at 3p25.3 and spans approximately 17 kilobases (Kb) containing 4 exons and 3 introns (Kimura, Tanizawa, Mori, Brownstein, & Okayama, 1992). Previous work had demonstrated associations between the OXT receptor gene (OXTR) haplotypes and affectivity or depressive temperament (TEMPS-A scale) (Kawamura et al., 2010). In this study, we attempted to confirm and extend these findings, as well as to assess whether OXTR variants are associated with increased stress, depression and anxiety phenotypes particularly in the context of early life stress, using the Depression Anxiety Stress Scale (DASS).
Materials and Methods
Sample
A total of 1,226 participants in the Brain Resource International Database administered by BRAINet for scientific access (BRID; www.brainnet.net, (Gordon, 2003; Gordon, Cooper, Rennie, Hermens, & Williams, 2005)) have been assessed using the DASS measure (KEMP et al., 2005; Lovibond SH, 1995), a 42-item self report designed to measure the negative emotional states of depression, anxiety and stress. The Depression scale assesses dysphoria, hopelessness, devaluation of life, self-deprecation, lack of interest/involvement, anhedonia, and inertia. The Anxiety scale assesses autonomic arousal, skeletal muscle effects, situational anxiety, and subjective experience of anxious affect. The Stress scale is sensitive to levels of chronic non-specific arousal. It assesses difficulty relaxing, nervous arousal, and being easily upset/agitated, irritable/over-reactive and impatient. Exclusion criteria included self-report of a personal history of physical brain injury, neurological disorder, psychiatric illness or other serious medical condition including history of sleep disorder (KEMP et al., 2005). DASS scores were treated as a continuous measure in all analyses. Individuals were assessed for the number of traumatic events they had been exposed to in early life using the Early Life Stress Questionnaire (ELSQ; (Chu, Williams, Harris, Bryant, & Gatt, 2013)). The ELSQ is based on the Child Abuse and Trauma Scale, which has been shown to have strong internal consistency, test-retest reliability, and validity, as it correlates with adult outcome and psychopathology (Sanders & Becker-Lausen, 1995). The measure consists of 19 events shown to have psychological impact in childhood in previous studies (Sanders et al., 1995). The number of events was counted and analysis was performed using both the number of events as a continuous measure as well as grouping events into no traumas versus one or more traumas reported. The following criteria were met during collection of this cohort: 1) the investigation was carried out in accordance with the latest version of the Declaration of Helsinki, 2) the study design was reviewed by an appropriate ethical committee, and 3) informed consent of the participants was obtained after the nature of the procedures was fully explained.
Genotyping
Of the 1226 BRID participants with DASS measures, 682 individuals had collected DNA available for genotyping. Fifteen SNPs spanning the length of OXTR were selected for genotyping and ten of these SNPs passed laboratory quality control (Figure 1). Genotypes were determined using iPLEX Gold™ primer extension followed by mass spectrometry analysis on the Sequenom MassARRAY system (Sequenom, San Diego, CA) by the Australian Genome Research Facility (http://www.agrf.org.au/). Complete genotyping data was obtained for 653 individuals. The cohort of 653 individuals used for our analysis was 47% female, with an average age of 37 (range 6–87 years) and an average of 11 years of education (range 1–18 years). All cohort members were of Caucasian decent.
Figure 1. Genotyped SNP locations and linkage disequilibrium.

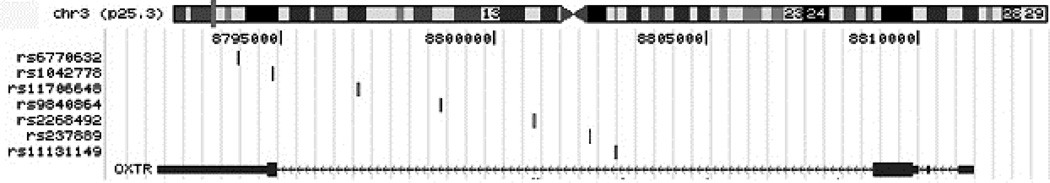
1A. Linkage disequilibrium map of SNPs chosen for genotyping. Linkage disequilibrium was calculated using data using Haploview and the CEPH data from the hapmap project (http://hapmap.ncbi.nlm.nih.gov/). The SNPs that failed to pass QC were rs237894, rs237895, rs2268496, rs237900 and rs237902. 1B. Basepair positions of SNPs used for analysis relative to the OXTR gene.
Quality Control
Prior to evaluation of samples and SNP variants, several quality control metrics were assessed. Quality metrics for samples included: 1. Removing samples with no phenotype and 2. Removing samples with call rates across all SNPs < 50%. Quality metrics for SNPs included: 1. Excluding SNPs with genotyping rates < 90% across all samples, 2. Excluding SNPs that were out of Hardy-Weinberg equilibrium (HWE) and 3. Excluding SNPs with a minor allele frequency less than 5%. A total of 7 SNPs met our criteria and were used for analysis. Three SNPs were eliminated because they were out of HWE. A total of 40% of the genetic variance of OXTR is captured using these 7 SNPs as measured using Haploview (Barrett, Fry, Maller, & Daly, 2005).
Imputation
To capture additional genetic variance within OXTR, SNPs were imputed using MaCH-Admix v2.0.198 (Liu, Li, Wang, & Li, 2013) as in Corneveaux et al (Corneveaux et al., 2010). The reference genome was the ALL GIANT.phase 1 release v3.20101123 (http://www.sph.umich.edu/csg/abecasis/MACH/download/1000G.2012-03-14.html) build that excludes monomorphic and singleton sites. The EUR alignment was used, which includes data from the CEPH cohorts as well as Italian, Finnish, British and Spanish samples (http://www.1000genomes.org/category/frequently-asked-questions/population) as is of a similar ethnic background to our cohorts. MaCH-Admix was run using the integrated (default) mode. Genotypes from 653 individuals were used for imputation, which comprised the full set of individuals for which there was both genotyping and full clinical data, including ELS, DASS scores, education, age and gender. Genotypes for 484 additional SNPs were imputed with an average quality score of 0.9 and a minimum quality score of 0.5. Imputed calls were imported into Haploview and Tagger was run to determine the minimal set of alleles which would tag the entire locus (Barrett, 2009; Barrett et al., 2005). The original genotyped SNPs were force-included in the models and pairwise tagging was performed. Fifty-one additional SNPs from this analysis were analyzed along with the original 7 polymorphisms. The average quality score was 0.8 for this set and the minimum quality score was 0.6. The minimum minor allele frequency was 2%. This set captured 90 of 90 alleles in the imputed set of SNPs at an r2 ≥ 0.8 with a max r2=0.971.
Brain Tissue
Brain tissue was obtained from National Institute on Aging Alzheimer’s disease centers, the Miami Brain Bank, the Newcastle Brain Tissue Resource, the MRC London Brain Bank for Neurodegenerative Diseases, the South West Dementia Brain Bank, The Netherlands Brain Bank and the Institut de Neuropatologia, Servei Anatomia Patologica, Universitat de Barcelona. All specimens were from donors who were greater than age 65 years at age of death. Only donors clinically classified as cognitively normal at time of death were included in this analysis. Board-certified neuropathologists performed Braak and Braak (Braak & Braak, 1995) staging on the based on the degree of neurofibrillary tangles and/or CERAD classification on the extent of neuritic plaques. Any samples with a history of other known neurological disease and or clinical history of stroke, cerebrovascular disease, Lewy bodies were excluded. Sample processing is given in references 17 and 19. The first set includes 177 samples and was 45% female, with an average age of 81 (range 65–100 years). The second set includes 188 samples and was 48% female, with an average age of 80 (range 65–102 years). All cohort members were of Caucasian decent.
Expression Profiling
Two data series were used to examine OXTR SNP genotypes and changes in OXTR transcript expression. Set 1 included data freely available at (http://labs.med.miami.edu/myers/LFuN/LFuN.html, (Webster et al., 2009)). This set includes 177 samples of human brain tissue from temporal, frontal or parietal cortex from individuals free of major neuropathology. Transcriptome profiles from this series were obtained on an Illumina Ref-seq8 microarray. The second series is a set of 188 pathology-free samples collected using the same criteria as set 1 (Zhang et al., 2013). Transcriptome profiles from this series were obtained on an Illumina HT-12 microarray. All transcript profiles were corrected as in Webster et al (Webster et al., 2009) with the exception that the lumi R package was used for set 2 (Du, Kibbe, & Lin, 2008). SNP genotypes from both sets were imputed using the same procedure as before, and Tagger was used as before to define minimal sets of variants to test. For both sets, genotypes for 484 additional SNPs were imputed with an average quality score of 0.95 and a minimum quality score of 0.54. Tags were determined independently for each set using Tagger. For the first expression set, 41 variants were used as tags with an average quality score of 0.8 and a minimum quality score of 0.6. The minimum minor allele frequency was 2%. This set captured 124 of 124 alleles in the imputed set of SNPs at a r2 ≥ 0.8 with a max r2=0.941. For the second expression set, 70 variants were used as tags with an average quality score of 0.9 and a minimum quality score of 0.6. The minimum minor allele frequency was 2%. This set captured 166 of 166 alleles in the imputed set of SNPs at an r2 ≥ 0.8 with a max r2=0.972.
Analysis
Several tests were performed in the BRAINnet data series. TEST 1: We use Student’s t-tests to examine whether there were differences in the DASS anxiety, DASS stress or DASS depression scores between individuals that experience one or more ELS events versus those that had no ELS. TEST 2: We examined whether there were any covariates that contributed to the relationships between ELS and DASS scores. TEST 3: We tested models including the main effects of OXTR SNPs, significant covariates from TEST 2, an interaction term for the joint effects of ELS and SNP genotype. We modeled DASS score as our outcome and regressed both SNP genotype and the interaction between SNP genotype and ELS. TEST 4: We performed an analysis in a separate dataset from neuropathologically normal human brains to examine whether any of the significant SNPs in our tests had a downstream functional effect, specifically testing whether they correlated with OXTR transcript expression changes. For all models the outcomes were DASS scores (either anxiety, stress or depression). Analysis for TEST 1 and TEST 2 was performed using SPSS v21 (Predictive Analytics SoftWare) using Student’s t-tests, and general linear models (GLM). Tests were corrected for multiple testing using a bootstrap procedure with 1000 permutations. Analysis for TEST 3 was performed using Plink v1.06 (Purcell et al., 2007) using an adaptive permutation procedure to correct for testing across multiple SNPs. SNP p-values were additionally corrected for multiple testing across the 3 different clinical phenotypes using a Bonferroni method. Expression data was analyzed for TEST 4 using Plink v1.06 (Purcell et al., 2007) using a linear model with permutation to correct for multiple testing.
Results
Symptoms and Early Life Stress
For TEST 1, we found a greater number of traumatic events was associated with greater severity of symptoms for stress (p-value=7.604E-09), anxiety (p-value=3.604E-06) and depression symptom scores (p-value=2.245E-11). These results are shown in Figure 2.
Figure 2. DASS scores comparing individuals with and without early life stress.

Shown are the distributions of DASS scores for individuals with less than one early life stress trauma (ELS <1) or greater than one early life stress trauma (ELS ≥ 1) for each of the 3 DASS measures (DASS_STRESS, DASS_ANXIETY or DASS_DEPRESSION) Significant differences were obtained for all scores, indicating that ELS impacts adult stress, anxiety and depression outcomes.
Symptoms-ELS relationship and Covariates
For TEST 2, we found that none of our demographic variables (gender, age or years of education) were significant covariates (Table 1A) when corrected for multiple testing. Additionally, none of these variables significantly interacted with ELS (Table 1B). Therefore, gender, age and years of education were not included in the modeling of SNP effects.
Table 1. Covariate analysis.
Table 1A lists p-values for the comparisons of gender, age and years of education with each of the DASS components. Table 1B lists the p-values for the interaction between ELS and each covariate.
| GENDER | BOOTSTRAP | AGE | BOOTSTRAP | EDUCATION | BOOTSTRAP | |
|---|---|---|---|---|---|---|
| ANXIETY | 0.181 | 0.958 | 1.96E-04 | 0.544 | 0.003 | 0.371 |
| DEPRESSION | 0.729 | 0.515 | 0.137 | 0.566 | 0.693 | 0.422 |
| STRESS | 0.761 | 0.333 | 0.435 | 0.549 | 0.172 | 0.399 |
Symptoms and SNPs
We were interested in examining two outcomes in our analysis of OXTR SNPs. In TEST 3, we sought to determine whether there was a main effect of SNP genotype on symptoms, assessed by DASS score and additionally, we examined whether there was an effect of ELS on the genotype and symptom relationship. Significant results for both of these tests are shown in Table 2. We found significant main effects of SNP genotype both on DASS stress and depression scores, but not with DASS anxiety. When ELS was considered there were significant SNPs identified for each type of symptom. The most interesting SNP in our findings was rs139832701 that gave significant results when ELS was considered in the models of DASS stress and depression, but just failed to survive correction for DASS anxiety. Additionally, there were main effects of this SNP on both stress and depression scores. The variant rs139832701 is a rare SNP just upstream of OXTR (Figure 3).
Table 2. SNP analysis.
Table 2 lists p-values for the comparisons of SNP genotype and ELS with each of the DASS components. RAW lists the unadjusted p-values from either the test of SNP genotype against DASS score (MAIN EFFECTS) or the unadjusted p-values from a linear test of whether early life stress (ELS) significantly interacted with the SNP genotype and DASS phenotype relationship (ELS INTERACTION). SNP ADJUSTED are the p-values adjusted for testing 58 variants using the bootstrap procedures in Plink. CORRECTED corrects the SNP ADJUSTED p-values for the 3 different DASS score tests using a Bonferroni correction. Only significant SNPs are shown.
| ANXIETY | |||||||||||||
|---|---|---|---|---|---|---|---|---|---|---|---|---|---|
| MAIN EFFECTS | ELS INTERACTION | ||||||||||||
| SNP | RAW | SNP ADJUSTED |
CORRECTED | FREQ | HWE | SNP | RAW | SNP ADJUSTED |
CORRECTED | FREQ | HWE | ||
| rs237886 | 0.028 | 0.036 | 0.107 | 0.444 | 0.979 | rs59190448 | 0.022 | 0.019 | 0.058 | 0.190 | 0.018 | ||
| rs139832701 | 0.051 | 0.023 | 0.068 | 0.016 | 1.000 | ||||||||
| rs17297971 | 0.011 | 0.333 | N/A | 0.047 | 0.460 | ||||||||
| rs237924 | 0.036 | 0.438 | N/A | 0.062 | 0.142 | ||||||||
| rs7652281 | 0.045 | 0.857 | N/A | 0.062 | 0.142 | ||||||||
| STRESS | |||||||||||||
|---|---|---|---|---|---|---|---|---|---|---|---|---|---|
| MAIN EFFECTS | ELS INTERACTION | ||||||||||||
| SNP | RAW | SNP ADJUSTED |
CORRECTED | FREQ | HWE | SNP | RAW | SNP ADJUSTED |
CORRECTED | FREQ | HWE | ||
| rs11131147 | 0.014 | 0.016 | 0.047 | 0.068 | 0.815 | rs139832701 | 0.007 | 0.005 | 0.016 | 0.015 | 1.000 | ||
| rs7652281 | 0.038 | 0.049 | 0.148 | 0.062 | 0.142 | rs7652281 | 0.016 | 0.857 | N/A | 0.062 | 0.142 | ||
| rs237892 | 0.054 | 0.065 | N/A | 0.071 | 0.059 | rs237892 | 0.029 | 0.356 | N/A | 0.071 | 0.059 | ||
| rs190216 | 0.035 | 0.214 | N/A | 0.079 | 0.025 | ||||||||
| DEPRESSION | |||||||||||||
|---|---|---|---|---|---|---|---|---|---|---|---|---|---|
| MAIN EFFECTS | ELS INTERACTION | ||||||||||||
| SNP | RAW | SNP ADJUSTED |
CORRECTED | FREQ | HWE | SNP | RAW | SNP ADJUSTED |
CORRECTED | FREQ | HWE | ||
| rs139832701 | 0.004 | 0.010 | 0.011 | 0.015 | 1.000 | rs139832701 | 0.001 | 0.004 | 0.011 | 0.015 | 1.000 | ||
| rs11131147 | 0.015 | 0.019 | 0.058 | 0.068 | 0.815 | ||||||||
| rs13093809 | 0.035 | 0.049 | 0.147 | 0.047 | 0.437 | ||||||||
Figure 3. Location of rs139832701 and rs3831817 with respect to OXTR.
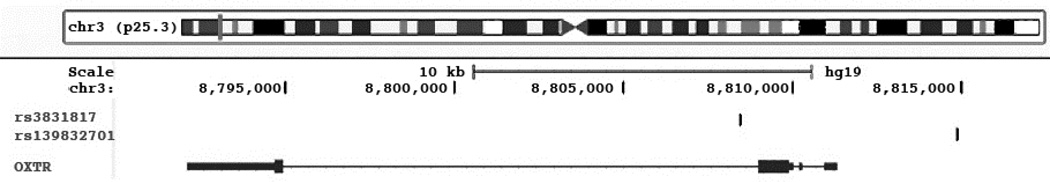
Shown in the figure is the location of rs139832701 and rs3831817 from data from the UCSC genome mapping site (http://genome.ucsc.edu).
OXTR genotypes and Expression
Because rs139832701 is located upstream of OXTR, it was of interest to determine whether this variant changes OXTR transcript expression. In TEST 4, we used two different cohorts including subjects of European ancestry who were verified as pathologically normal. These samples were analyzed as previously (Webster et al., 2009) to determine whether there was a linear relationship between OXTR allele dose and OXTR transcript levels. Results are shown in Table 3. There were several SNPs in each human brain tissue set where there was a linear relationship between OXTR expression and SNP genotypes. The clinically associated variants (rs139832701 and rs11131147) were not significant in our expression analysis, indicating it is likely that these variants do not act by changing OXTR levels. However, one common SNP was significant in both brain tissue sets. rs3831817 showed significantly different expression in each allele group as shown in Figure 4. The location of rs3831817 with respect to rs139832701 is shown in Figure 3.
Table 3. Expression analysis.
Table 2 lists p-values for the comparisons of SNP genotype and OXTR expression. RAW lists the unadjusted p-values from comparisons of SNP genotype against expression. SNP ADJUSTED are the p-values adjusted for testing multiple variants using the bootstrap procedures in Plink. Only significant SNPs are shown with the exception of rs139832701 and rs1131147 since these two SNPs gave significant results in our analysis of DASS scores.
| EXPRESSION SET 1 | ||||
|---|---|---|---|---|
| MAIN EFFECTS | ||||
| SNP | RAW | SNP ADJUSTED |
FREQ | HWE |
| rs237881 | 0.005677 | 0.006168 | 0.419 | 0.5559 |
| rs237876 | 0.009118 | 0.01275 | 0.28 | 0.8047 |
| rs3831817 | 0.009919 | 0.01113 | 0.38 | 0.6681 |
| rs2268498 | 0.01505 | 0.0142 | 0.402 | 0.0235 |
| rs62243375 | 0.01541 | 0.01242 | 0.06 | 0.5017 |
| rs237883 | 0.03678 | 0.03411 | 0.056 | 0.6064 |
| rs139832701 | 0.9383 | 1 | 0.139 | 0.0065 |
| rs11131147 | 0.9081 | 0.8571 | 0.103 | 0.4705 |
| EXPRESSION SET 2 | ||||
|---|---|---|---|---|
| MAIN EFFECTS | ||||
| SNP | RAW | SNP ADJUSTED |
FREQ | HWE |
| rs7629329 | 1.93E-07 | 0.000001 | 0.259 | 0.0953 |
| rs11718289 | 8.07E-07 | 0.000002 | 0.426 | 0.1434 |
| rs237902 | 1.88E-06 | 0.000009 | 0.349 | 0.6313 |
| rs34955659 | 1.08E-05 | 0.000017 | 0.023 | 1 |
| rs237888 | 8.64E-05 | 0.0001127 | 0.057 | 1 |
| rs34055574 | 0.0001853 | 0.0002057 | 0.339 | 0.5512 |
| rs62242632 | 0.0002328 | 0.0002299 | 0.103 | 0.4094 |
| rs6443206 | 0.0002205 | 0.0002393 | 0.234 | 0.8965 |
| rs9878427 | 0.0003801 | 0.0003105 | 0.113 | 1 |
| rs11476 | 0.000303 | 0.0004044 | 0.339 | 0.0042 |
| rs237894 | 0.0004674 | 0.0005243 | 0.288 | 1 |
| rs3831817 | 0.000644 | 0.000721 | 0.389 | 0.9276 |
| rs2268492 | 0.001291 | 0.001518 | 0.329 | 0.9922 |
| rs237889 | 0.002488 | 0.002914 | 0.379 | 0.7455 |
| rs2139184 | 0.004696 | 0.00535 | 0.031 | 1 |
| rs237917 | 0.005762 | 0.006785 | 0.284 | 0.742 |
| rs114641034 | 0.01002 | 0.007115 | 0.035 | 1 |
| rs11711703 | 0.00428 | 0.00833 | 0.174 | 0.7371 |
| rs2268495 | 0.004871 | 0.01014 | 0.225 | 0.5321 |
| rs237918 | 0.01105 | 0.01408 | 0.473 | 0.9736 |
| rs7635237 | 0.02051 | 0.0185 | 0.079 | 1 |
| rs190216 | 0.02186 | 0.02687 | 0.076 | 0.1948 |
| rs34474424 | 0.03345 | 0.0348 | 0.085 | 0.952 |
| rs56672907 | 0.0296 | 0.03622 | 0.207 | 0.0033 |
| rs73132859 | 0.03383 | 0.04492 | 0.046 | 1 |
| rs139832701 | 0.2099 | 0.1626 | 0.124 | 0.0026 |
| rs11131147 | 0.2322 | 0.2535 | 0.146 | 1 |
Figure 4. Expression of OXTR by rs3831817 genotypes.

Shown in the figure is a boxplot of rs3831817 genotypes (x-axis) and OXTR transcript levels (y-axis) for each brain profiling set. The adjusted linear p-values comparing allele dose and expression across all genotypes were 0.01113 (set 1) and 0.000721 (set 2).
Discussion
The physiological role of oxytocin has been intensively investigated. Initial work demonstrated its role in labor and lactation (Thorburn & Challis, 1979). More recent work has focused on oxytocin’s effects on human social behavior (Ebstein, Israel, Chew, Zhong, & Knafo, 2010) including work demonstrating that intranasal administration of oxytocin increases trust in humans (Kosfeld et al., 2005) and is a potent antagonist of amygdala activation and brainstem activation in autonomic and behavioral manifestations of fear (Kirsch et al., 2005). Further work has now defined a role for oxytocin in symptoms of depression (Malik, Zai, Abu, Nowrouzi, & Beitchman, 2012) and in risk factors for depression, such as early life stress (Bakermans-Kranenburg & van Ijzendoorn, 2008; Rodrigues, Saslow, Garcia, John, & Keltner, 2009). Oxytocin has also been implicated in other maladaptive emotional traits including aggression (Malik et al., 2012) and autistic behaviors (Andari et al., 2010).
In this study we focused on genetic variation in OXTR and whether early life stress exposure moderates the relationship between OXTR and symptoms of depression and anxiety. We found a significant interaction in which individuals with the OXTR rs139832701 variant who were also exposed to stress showed significantly more severe symptoms of depression and related symptoms of stress and (at trend level) anxiety. These findings suggest that genotypes of this OXTR variant might in the context of early life stress increase risk for expression of symptoms that lead to a much higher likelihood of developing mood and anxiety disorders.
To our knowledge the present findings are the first report on an association between early life stress, mood and anxiety symptoms and the OXTR rs139832701 variant. It extends on previous reports in which OXTR has implicated a haplotype comprised of 7 variants (rs11131149, rs2243370, rs2243369, rs113316193, rs2254298, and rs2268491) with depressive temperament. Mapping these prior results onto the effects seen in our screen (Figure 5) shows the SNP associated with DASS scores (rs139832701) is in linkage equilibrium with the prior SNPs (r2 values < 0.8), suggesting this is perhaps an independent result from prior observations. Other work has focused on a variant (rs53576) in the third intron of the OXTR that has been associated with greater empathy and stress reactivity (Rodrigues et al., 2009), greater maternal sensitivity (Bakermans-Kranenburg et al., 2008), higher self esteem and optimism (Saphire-Bernstein, Way, Kim, Sherman, & Taylor, 2011), differing cortisol levels during the Trier Social Stress Test (Chen et al., 2011), differences in positive affect (Kim et al., 2010) and the development of future depressive symptoms in the context of childhood maltreatment (McQuaid, McInnis, Stead, Matheson, & Anisman, 2013). This variant is also in linkage equilibrium with our associated SNP (r2=0.14), again suggesting our results are independent from prior studies.
Figure 5. Linkage disequilibrium plot of prior and current results.

Shown are the r2 values for SNPs previously associated with depression and anxiety and the results from our current screen.
There are some limitations to our results as reported. First, our DASS measures are all self-report. This might increase the noise in our clinical measures as outcomes are not validated by clinicians or examinations of medical records. Secondly, our expression cohort and our DASS cohort are sampled from different populations. While they are well balanced for gender distributions (DASS cohort: 47% female, Expression set 1: 45% female, Expression set 2: 48% female), the expression set cohorts are both considerably older than the DASS series. This is in part due to the fact that expression profiles might be affected by causes of death in younger samples, i.e. the CDC reports the major cause of death in younger cohorts is unintentional injury, which is likely to result in more head trauma than heart disease, which is the major cause of death in the elderly (http://www.cdc.gov/injury/wisqars/pdf/10lcid_all_deaths_by_age_group_2010-a.Pdf). Head trauma and similar injuries will affect brain expression profiles, thus it is less ideal to use younger brain tissue samples to perform expression profiling in control samples. The final limitation of this paper is that we were not able to map a downstream effect of the OXTR rs139832701 variant.
While we were not able to map a downstream change in OXTR gene expression to SNPs that were associated with differences in DASS outcomes, we were able to map one SNP (rs3831817) that was associated with differences in OXTR transcript expression in two different human brain tissue sets. rs3831817 is in moderate linkage disequilibrium with our DASS effect SNP (rs139832701, r2=0.74, Figure 5); however, again rs139832701 was not associated with differences in expression in two separate datasets (Table 3). rs3831817 falls into a cluster of SNPs that have been associated with autism risk in Chinese Han (Wu et al., 2005), Japanese (Liu et al., 2010) and Israeli (Lerer et al., 2008b) cohorts. Mapping this SNP onto the effects seen in prior screens (Figure 5) showed strong linkage disequilibrium between prior results and our expression SNP rs3831817 (r2 values ≥ 0.8 for rs53576 and rs237897) indicating that perhaps the prior associated SNPs were having effects through changes in downstream transcript levels. Other studies have linked epigenetic silencing and deletions of OXTR to the exhibition of autism (Gregory et al., 2009) suggesting that OXTR expression might be crucial to autism and rs3831817 might warrant further study in this context.
Acknowledgements
AJM is supported by NIA AG041232 and NIMH MH094759. This project was supported by an Australian Research Council Linkage Project grant (LP0455104) with Brain Resource Ltd as the industry partner. JMG is supported by the National Health & Medical Research Council of Australia (NHMRC) Career Development Fellowship 1062495. CDS is supported by the National Health & Medical Research Council of Australia (NHMRC) Project Grant 630428. PRS is supported by NHMRC Program Grant 1037196. CBN is supported by NIMH MH094759. We acknowledge access to data from the 501(c)(3) BRAINnet Foundation database; www.BRAINnet.net
Brain tissue specimens for the expression studies were collected from several National Institute on Aging (NIA) and National Alzheimer’s Coordinating Center (NACC, grant #U01 AG016976) funded sites. Amanda J. Myers, PhD (University of Miami, Department of Psychiatry) and John A. Hardy, PhD (Reta Lila Weston Institute, University College London) collected and prepared the series. Marcelle Morrison-Bogorad, PhD., Tony Phelps, PhD and Walter Kukull PhD are thanked for helping to co-ordinate this collection. The directors, pathologist and technicians involved include: National Institute on Aging: Ruth Seemann, John Hopkins Alzheimer's Disease Research Center (NIA grant # AG05146): Juan C. Troncoso, MD, Dr. Olga Pletnikova, University of California, Los Angeles (NIA grant # P50 AG16570):Harry Vinters, MD, Justine Pomakian, The Kathleen Price Bryan Brain Bank, Duke University Medical Center (NIA grant #AG05128, NINDS grant # NS39764, NIMH MH60451 also funded by Glaxo Smith Kline): Christine Hulette, MD, Director, John F. Ervin, Stanford University: Dikran Horoupian, MD, Ahmad Salehi, MD, PhD, New York Brain Bank, Taub Institute, Columbia University (NYBB): Jean Paul Vonsattel, MD, Katerina Mancevska, Massachusetts Alzheimer’s Disease Research Center (P50 AG005134): E. Tessa Hedley-Whyte, MD, MP Frosch, MD, Karlotta Fitch, University of Michigan (NIH grant P50-AG08671): Dr. Roger Albin, Lisa Bain, Eszter Gombosi, University of Kentucky (NIH #AG05144): William Markesbery, MD, Sonya Anderson, Mayo Clinic, Jacksonville: Dennis W. Dickson, MD, Natalie Thomas, University Southern California: Caroll A. Miller, MD, Jenny Tang, M.S., Dimitri Diaz, Washington University, St Louis Alzheimer’s Disease Research Center (NIH #P50AG05681): Dan McKeel, MD, John C. Morris, MD, Eugene Johnson, Jr., PhD, Virginia Buckles, PhD, Deborah Carter, University of Washington, Seattle (NIH #P50 AG05136):Thomas Montine, MD, PhD, Aimee Schantz, MEd., University of Pennsylvania School of Medicine, Alzheimer’s Disease Research Center: John Q Trojanowski, MD, Virginia M Lee, MD, Vivianna Van Deerlin, MD, Terry Schuck, Boston University Alzheimer’s Disease Research Center (NIH grant P30-AG13846): Ann C. McKee, Carol Kubilus Sun Health Research Institute Brain Donation Program of Sun City, Arizona (NIA #P30 AG19610; Arizona Alzheimer’s Disease Core Center, Arizona Department of Health Services, contract 211002, Arizona Alzheimer’s Research Center; Arizona Biomedical Research Commission, contracts 4001, 0011, 0,01 and 1001 to the Arizona Parkinson's Disease Consortium; Michael J. Fox Foundation for Parkinson’s Research): Joseph Rogers, PhD, Thomas G. Beach, MD, PhD, Lucia I. Sue Emory University: Bruce H. Wainer, MD, PhD, Marla Gearing, PhD, University of Texas, Southwestern Medical School: Charles L. White, III, M.D., Roger Rosenberg, Marilyn Howell, Joan Reisch, University of California, Davis: William Ellis, MD, Mary Ann Jarvis, Rush University Medical Center, Rush Alzheimer's Disease Center (NIH #AG10161): David A. Bennett, M.D. Julie A. Schneider, MD, MS, Karen Skish, MS, PA (ASCP)MT, Wayne T Longman, University of Miami/NPF Brain Endowment Bank: Deborah C. Mash, MD, Margaret J Basile, Mitsuko Tanaka Oregon Health & Science University: Randy Wotljer, PhD
Additional tissues include samples from the following sites: Newcastle Brain Tissue Resource (funding via the Medical Research Council, local NHS trusts and Newcastle University): C.M. Morris, MD, Ian G McKeith, Robert H Perry MRC London Brain Bank for Neurodegenerative Diseases (funding via the Medical Research Council): Simon Lovestone, Md PhD, Safa Al-Sarraj. MD, Claire Troakes, South West Dementia Brain Bank (funding via numerous sources including the Higher Education Funding Council for England (HEFCE), Alzheimer’s Research Trust (ART), BRACE as well as North Bristol NHS Trust Research and Innovation Department and DeNDRoN): Seth Love, MD, Patrick Kehoe, PhD, Laura Palmer, The Netherlands Brain Bank (funding via numerous sources including Stichting MS Research, Brain Net Europe, Hersenstichting Nederland Breinbrekend Werk, International Parkinson Fonds, Internationale Stiching Alzheimer Onderzoek): Inge Huitinga, MD, Marleen Rademaker, Michiel Kooreman, Institut de Neuropatologia, Servei Anatomia Patologica, Universitat de Barcelona: Isidre Ferrer Abizanda, MD, PhD, Susana Casas Boluda.
Role of Funding Source:
Sample collection was sponsored by an Australian Research Council Linkage Project grant (LP0455104) with Brain Resource Ltd as the industry partner. Data analysis was supported by NIA AG041232 and NIMH MH094759.
Footnotes
Publisher's Disclaimer: This is a PDF file of an unedited manuscript that has been accepted for publication. As a service to our customers we are providing this early version of the manuscript. The manuscript will undergo copyediting, typesetting, and review of the resulting proof before it is published in its final citable form. Please note that during the production process errors may be discovered which could affect the content, and all legal disclaimers that apply to the journal pertain.
Contributors:
AJM was responsible for the design, analysis and write-up of all experiments, LW manages the cohort and was involved in data collection and edited the manuscript, JMG helped with data collection and edited the manuscript, EZMC helped with data collection and edited the manuscript, CDS helped with data collection and edited the manuscript, PRS coordinated the genetic data collection and edited the manuscript, CBN edited the manuscript.
Disclosures:
Drs. Myers, McAuley-Clark & Dobson-Stone report no competing interests. Dr. Williams consults with Brain Resource Ltd. Dr. Gatt has previously received consultancy fees with Brain Resource Ltd for unrelated projects. Dr. Schofield reports receiving speaking fees from Janssen-Cilag. This activity does not present a conflict with the current data. Dr Nemeroff consults for Xhale, Takeda, SK Pharma, Shire, Roche, Lilly, Allergan, Mitsubishi Tanabe Pharma Development America, Taisho Pharmaceutical Inc., Lundbeck and Prismic Pharmaceuticals. He is a stockholder in CeNeRx BioPharma, PharmaNeuroBoost, Revaax Pharma, Xhale, Celgene, Seattle genetics and Abbvie. He serves on the scientific advisory boards of the American Foundation for Suicide Prevention (AFSP), CeNeRx BioPharma (2012), the National Alliance for Research on Schizophrenia and Depression (NARSAD), Xhale, PharmaNeuroBoost (2012), the Anxiety Disorders Association of America (ADAA), and Skyland Trail. He serves on the board of directors for AFSP, NovaDel (2011), Skyland Trail, Gratitude America, and ADAA. He receives income in excess of 10,000 from PharmaNeuroBoost, CeNeRx BioPharma, NovaDel Pharma, Reevax Pharma, American Psychiatric Publishing, and Xhale. He holds two patents: Method and devices for transdermal delivery of lithium (US 6,375,990B1) and Method of assessing antidepressant drug therapy via transport inhibition of monoamine neurotransmitters by ex vivo assay (US 7,148,027B2). None of these activities present a conflict with the current data.
References
- Andari E, Duhamel JR, Zalla T, Herbrecht E, Leboyer M, Sirigu A. Promoting social behavior with oxytocin in high-functioning autism spectrum disorders. Proc Natl Acad Sci U S A. 2010;107:4389–4394. doi: 10.1073/pnas.0910249107. [DOI] [PMC free article] [PubMed] [Google Scholar]
- Bakermans-Kranenburg MJ, van Ijzendoorn MH. Oxytocin receptor (OXTR) and serotonin transporter (5-HTT) genes associated with observed parenting. Soc Cogn Affect Neurosci. 2008;3:128–134. doi: 10.1093/scan/nsn004. [DOI] [PMC free article] [PubMed] [Google Scholar]
- Barrett JC. Haploview: Visualization and analysis of SNP genotype data. Cold Spring Harb Protoc. 2009;2009 doi: 10.1101/pdb.ip71. pdb ip71. [DOI] [PubMed] [Google Scholar]
- Barrett JC, Fry B, Maller J, Daly MJ. Haploview: analysis and visualization of LD and haplotype maps. Bioinformatics. 2005;21:263–265. doi: 10.1093/bioinformatics/bth457. [DOI] [PubMed] [Google Scholar]
- Braak H, Braak E. Staging of Alzheimer's disease-related neurofibrillary changes. Neurobiol Aging. 1995;16:271–278. doi: 10.1016/0197-4580(95)00021-6. discussion 278–284. [DOI] [PubMed] [Google Scholar]
- Chen FS, Kumsta R, von Dawans B, Monakhov M, Ebstein RP, Heinrichs M. Common oxytocin receptor gene (OXTR) polymorphism and social support interact to reduce stress in humans. Proc Natl Acad Sci U S A. 2011;108:19937–19942. doi: 10.1073/pnas.1113079108. [DOI] [PMC free article] [PubMed] [Google Scholar]
- Chu DA, Williams LM, Harris AW, Bryant RA, Gatt JM. Early life trauma predicts self-reported levels of depressive and anxiety symptoms in nonclinical community adults: relative contributions of early life stressor types and adult trauma exposure. J Psychiatr Res. 2013;47:23–32. doi: 10.1016/j.jpsychires.2012.08.006. [DOI] [PubMed] [Google Scholar]
- Corneveaux JJ, Myers AJ, Allen AN, Pruzin JJ, Ramirez M, Engel A, Nalls MA, Chen K, Lee W, Chewning K, Villa SE, Meechoovet HB, Gerber JD, Frost D, Benson HL, O'Reilly S, Chibnik LB, Shulman JM, Singleton AB, Craig DW, Van Keuren-Jensen KR, Dunckley T, Bennett DA, De Jager PL, Heward C, Hardy J, Reiman EM, Huentelman MJ. Association of CR1, CLU and PICALM with Alzheimer's disease in a cohort of clinically characterized and neuropathologically verified individuals. Hum Mol Genet. 2010;19:3295–3301. doi: 10.1093/hmg/ddq221. [DOI] [PMC free article] [PubMed] [Google Scholar]
- de Wied D, Diamant M, Fodor M. Central nervous system effects of the neurohypophyseal hormones and related peptides. Front Neuroendocrinol. 1993;14:251–302. doi: 10.1006/frne.1993.1009. [DOI] [PubMed] [Google Scholar]
- Du P, Kibbe WA, Lin SM. lumi: a pipeline for processing Illumina microarray. Bioinformatics. 2008;24:1547–1548. doi: 10.1093/bioinformatics/btn224. [DOI] [PubMed] [Google Scholar]
- Ebstein RP, Israel S, Chew SH, Zhong S, Knafo A. Genetics of human social behavior. Neuron. 2010;65:831–844. doi: 10.1016/j.neuron.2010.02.020. [DOI] [PubMed] [Google Scholar]
- Gordon E. Integrative Neuroscience. Neuropsychopharmacology. 2003;28:S2–S8. doi: 10.1038/sj.npp.1300136. [DOI] [PubMed] [Google Scholar]
- Gordon E, Cooper N, Rennie C, Hermens D, Williams LM. Integrative Neuroscience: The Role of a Standardized Database. Clinical EEG and Neuroscience. 2005;36:64–75. doi: 10.1177/155005940503600205. [DOI] [PubMed] [Google Scholar]
- Gregory SG, Connelly JJ, Towers AJ, Johnson J, Biscocho D, Markunas CA, Lintas C, Abramson RK, Wright HH, Ellis P, Langford CF, Worley G, Delong GR, Murphy SK, Cuccaro ML, Persico A, Pericak-Vance MA. Genomic and epigenetic evidence for oxytocin receptor deficiency in autism. BMC Med. 2009;7:62. doi: 10.1186/1741-7015-7-62. [DOI] [PMC free article] [PubMed] [Google Scholar]
- Heim C, Young LJ, Newport DJ, Mletzko T, Miller AH, Nemeroff CB. Lower CSF oxytocin concentrations in women with a history of childhood abuse. Mol Psychiatry. 2009;14:954–958. doi: 10.1038/mp.2008.112. [DOI] [PubMed] [Google Scholar]
- Heinrichs M, Baumgartner T, Kirschbaum C, Ehlert U. Social support and oxytocin interact to suppress cortisol and subjective responses to psychosocial stress. Biological Psychiatry. 2003;54:1389–1398. doi: 10.1016/s0006-3223(03)00465-7. [DOI] [PubMed] [Google Scholar]
- Hoge EA, Pollack MH, Kaufman RE, Zak PJ, Simon NM. Oxytocin levels in social anxiety disorder. CNS Neurosci Ther. 2008;14:165–170. doi: 10.1111/j.1755-5949.2008.00051.x. [DOI] [PMC free article] [PubMed] [Google Scholar]
- Kawamura Y, Liu XX, Akiyama T, Shimada T, Otowa T, Sakai Y, Kakiuchi C, Umekage T, Sasaki T, Akiskal HS. The association between oxytocin receptor gene (OXTR) polymorphisms and affective temperaments, as measured by TEMPS-A. Journal of Affective Disorders. 2010;127:31–37. doi: 10.1016/j.jad.2010.04.014. [DOI] [PubMed] [Google Scholar]
- Kemp AH, Stephan BCM, Hopkinson P, Sumich AL, Paul RH, Richard Clark C, Gordon E, Bryant RA, Williams LM. Toward an integrated profile of depression: evidence from the brain resource international database. Journal of Integrative Neuroscience. 2005;04:95–106. doi: 10.1142/s0219635205000665. [DOI] [PubMed] [Google Scholar]
- Kim HS, Sherman DK, Sasaki JY, Xu J, Chu TQ, Ryu C, Suh EM, Graham K, Taylor SE. Culture, distress, and oxytocin receptor polymorphism (OXTR) interact to influence emotional support seeking. Proc Natl Acad Sci U S A. 2010;107:15717–15721. doi: 10.1073/pnas.1010830107. [DOI] [PMC free article] [PubMed] [Google Scholar]
- Kimura T, Tanizawa O, Mori K, Brownstein MJ, Okayama H. Structure and expression of a human oxytocin receptor. Nature. 1992;356:526–529. doi: 10.1038/356526a0. [DOI] [PubMed] [Google Scholar]
- Kirsch P, Esslinger C, Chen Q, Mier D, Lis S, Siddhanti S, Gruppe H, Mattay VS, Gallhofer B, Meyer-Lindenberg A. Oxytocin modulates neural circuitry for social cognition and fear in humans. J Neurosci. 2005;25:11489–11493. doi: 10.1523/JNEUROSCI.3984-05.2005. [DOI] [PMC free article] [PubMed] [Google Scholar]
- Kosfeld M, Heinrichs M, Zak PJ, Fischbacher U, Fehr E. Oxytocin increases trust in humans. Nature. 2005;435:673–676. doi: 10.1038/nature03701. [DOI] [PubMed] [Google Scholar]
- Lee R, Ferris C, Van de Kar LD, Coccaro EF. Cerebrospinal fluid oxytocin, life history of aggression, and personality disorder. Psychoneuroendocrinology. 2009;34:1567–1573. doi: 10.1016/j.psyneuen.2009.06.002. [DOI] [PubMed] [Google Scholar]
- Lerer E, Levi S, Salomon S, Darvasi A, Yirmiya N, Ebstein RP. Association between the oxytocin receptor (OXTR) gene and autism: relationship to Vineland Adaptive Behavior Scales and cognition. Molecular Psychiatry. 2008a;13:980–988. doi: 10.1038/sj.mp.4002087. [DOI] [PubMed] [Google Scholar]
- Lerer E, Levi S, Salomon S, Darvasi A, Yirmiya N, Ebstein RP. Association between the oxytocin receptor (OXTR) gene and autism: relationship to Vineland Adaptive Behavior Scales and cognition. Mol Psychiatry. 2008b;13:980–988. doi: 10.1038/sj.mp.4002087. [DOI] [PubMed] [Google Scholar]
- Liu EY, Li M, Wang W, Li Y. MaCH-admix: genotype imputation for admixed populations. Genet Epidemiol. 2013;37:25–37. doi: 10.1002/gepi.21690. [DOI] [PMC free article] [PubMed] [Google Scholar]
- Liu X, Kawamura Y, Shimada T, Otowa T, Koishi S, Sugiyama T, Nishida H, Hashimoto O, Nakagami R, Tochigi M, Umekage T, Kano Y, Miyagawa T, Kato N, Tokunaga K, Sasaki T. Association of the oxytocin receptor (OXTR) gene polymorphisms with autism spectrum disorder (ASD) in the Japanese population. J Hum Genet. 2010;55:137–141. doi: 10.1038/jhg.2009.140. [DOI] [PubMed] [Google Scholar]
- Lovibond SHLP. Manual for the Depression Anxiety Stress Scales. Sydney: Psychology Foundation; 1995. [Google Scholar]
- Malik AI, Zai CC, Abu Z, Nowrouzi B, Beitchman JH. The role of oxytocin and oxytocin receptor gene variants in childhood-onset aggression. Genes Brain Behav. 2012;11:545–551. doi: 10.1111/j.1601-183X.2012.00776.x. [DOI] [PubMed] [Google Scholar]
- McQuaid RJ, McInnis OA, Stead JD, Matheson K, Anisman H. A paradoxical association of an oxytocin receptor gene polymorphism: early-life adversity and vulnerability to depression. Front Neurosci. 2013;7:128. doi: 10.3389/fnins.2013.00128. [DOI] [PMC free article] [PubMed] [Google Scholar]
- Purcell S, Neale B, Todd-Brown K, Thomas L, Ferreira MA, Bender D, Maller J, Sklar P, de Bakker PI, Daly MJ, Sham PC. PLINK: a tool set for whole-genome association and population-based linkage analyses. American Journal of Human Genetics. 2007;81:559–575. doi: 10.1086/519795. [DOI] [PMC free article] [PubMed] [Google Scholar]
- Rodrigues SM, Saslow LR, Garcia N, John OP, Keltner D. Oxytocin receptor genetic variation relates to empathy and stress reactivity in humans. Proc Natl Acad Sci U S A. 2009;106:21437–21441. doi: 10.1073/pnas.0909579106. [DOI] [PMC free article] [PubMed] [Google Scholar]
- Sanders B, Becker-Lausen E. The measurement of psychological maltreatment: early data on the Child Abuse and Trauma Scale. Child Abuse Negl. 1995;19:315–323. doi: 10.1016/s0145-2134(94)00131-6. [DOI] [PubMed] [Google Scholar]
- Saphire-Bernstein S, Way BM, Kim HS, Sherman DK, Taylor SE. Oxytocin receptor gene (OXTR) is related to psychological resources. Proc Natl Acad Sci U S A. 2011;108:15118–15122. doi: 10.1073/pnas.1113137108. [DOI] [PMC free article] [PubMed] [Google Scholar]
- Scantamburlo G, Hansenne M, Fuchs S, Pitchot W, Marechal P, Pequeux C, Ansseau M, Legros JJ. Plasma oxytocin levels and anxiety in patients with major depression. Psychoneuroendocrinology. 2007;32:407–410. doi: 10.1016/j.psyneuen.2007.01.009. [DOI] [PubMed] [Google Scholar]
- Thorburn GD, Challis JR. Endocrine control of parturition. Physiol Rev. 1979;59:863–918. doi: 10.1152/physrev.1979.59.4.863. [DOI] [PubMed] [Google Scholar]
- Uvnas-Moberg K. Oxytocin may mediate the benefits of positive social interaction and emotions. Psychoneuroendocrinology. 1998;23:819–835. doi: 10.1016/s0306-4530(98)00056-0. [DOI] [PubMed] [Google Scholar]
- Webster JA, Gibbs JR, Clarke J, Ray M, Zhang WX, Holmans P, Rohrer K, Zhao A, Marlowe L, Kaleem M, McCorquodale DS, Cuello C, Leung D, Bryden L, Nath P, Zismann VL, Joshipura K, Huentelman MJ, Hu-Lince D, Coon KD, Craig DW, Pearson JV, Heward CB, Reiman EM, Stephan D, Hardy J, Myers AJ, Grp N-N. Genetic Control of Human Brain Transcript Expression in Alzheimer Disease. American Journal of Human Genetics. 2009;84:445–458. doi: 10.1016/j.ajhg.2009.03.011. [DOI] [PMC free article] [PubMed] [Google Scholar]
- Wu S, Jia M, Ruan Y, Liu J, Guo Y, Shuang M, Gong X, Zhang Y, Yang X, Zhang D. Positive association of the oxytocin receptor gene (OXTR) with autism in the Chinese Han population. Biol Psychiatry. 2005;58:74–77. doi: 10.1016/j.biopsych.2005.03.013. [DOI] [PubMed] [Google Scholar]
- Zhang B, Gaiteri C, Bodea LG, Wang Z, McElwee J, Podtelezhnikov AA, Zhang C, Xie T, Tran L, Dobrin R, Fluder E, Clurman B, Melquist S, Narayanan M, Suver C, Shah H, Mahajan M, Gillis T, Mysore J, MacDonald ME, Lamb JR, Bennett DA, Molony C, Stone DJ, Gudnason V, Myers AJ, Schadt EE, Neumann H, Zhu J, Emilsson V. Integrated systems approach identifies genetic nodes and networks in late-onset Alzheimer's disease. Cell. 2013;153:707–720. doi: 10.1016/j.cell.2013.03.030. [DOI] [PMC free article] [PubMed] [Google Scholar]