

Abstract
Metastatic recurrence is the leading cause of cancer death in patients with colorectal carcinoma. In order to capture the molecular underpinnings for metastasis and tumor progression, we performed integrative network analysis on 11 independent human colorectal cancer gene expression data sets and applied expression data from an immunocompetent mouse model of metastasis as an additional filter for this biological process. In silico analysis of one metastasis-related co-expression module predicted Nuclear Factor of Activated T-cell (NFAT) transcription factors as potential regulators for the module. Cells selected for invasiveness and metastatic capability expressed higher levels of NFATc1 as compared with poorly metastatic and less invasive parental cells. We found that inhibition of NFATc1 in human and mouse colon cancer cells resulted in decreased invasiveness in culture and down-regulation of metastasis-related network genes. Overexpression of NFATc1 significantly increased the metastatic potential of colon cancer cells while inhibition of NFATc1 reduced metastasis growth in an immunocompetent mouse model. Finally, we found that an 8-gene signature comprising genes up-regulated by NFATc1 significantly correlated with worse clinical outcomes in Stage II and III colorectal cancer patients. Thus, NFATc1 regulates colon cancer cell behavior and its transcriptional targets constitute a novel, biologically-anchored gene expression signature for the identification of colon cancers with high risk of metastatic recurrence.
INTRODUCTION
Colorectal carcinoma is a leading cause of cancer-related deaths in the United States (1, 2). Conventional staging is insufficient to adequately predict metastasis or recurrence in colorectal cancer, particularly for patients with stage II or stage III disease (3). Over the past several years, gene expression profiling has been used to predict patient outcomes independently of conventional staging, however, the biological mechanisms driving poor clinical outcomes remain incompletely understood. Furthermore, because published prognostic colorectal cancer gene expression signatures are non-overlapping, inference of regulatory molecular targets driving clinical outcomes poses a significant challenge (4, 5). Nevertheless, it is likely that the combined data underlying these studies provide enough biological information for inference of potential transcriptional regulators of colorectal cancer progression and metastasis.
In the present study, we reasoned that the gene expression signatures of metastasis in mouse models and poor prognosis in humans reflect a functional consequence of the deregulation of co-regulated gene networks. Accordingly, we integrated eleven human microarray data sets, representing data from 1295 colorectal cancer tumor specimens, to produce a set of co-expressed gene modules. These co-expression modules were filtered using gene expression data from an immunocompetent mouse model of metastatic colon cancer to identify a metastasis-associated co-expression module. We further predicted the NFAT (Nuclear Factor of Activated T cell) family of transcription factors as a primary regulator of 21 genes in the module.
NFAT is a cell signaling molecule involved in complex adaptive systems particular to vertebrate biology related to the Rel family of cell signal proteins (6, 7). NFATs are regulated by receptor-mediated calcium/calmodulin signaling driving nuclear transport where they control transcriptional events governing functions as diverse as cell proliferation, survival and differentiation (8, 9), epithelial-to-mesenchymal transition (EMT) (6, 10) (11), and stem cell quiescence (12). NFATs also modulate inflammatory cell function, angiogenesis, cell migration and invasion (11, 13) and regulation of tumor stromal cell function in both a cell-type specific and context-dependent manner (14).
Here, we used a systems biology approach to identify NFAT as a potential regulator of colon cancer progression and metastasis. A schematic of our overall workflow appears in Supplementary Figure 1. We experimentally determined that expression of NFATc1, specifically, promotes increased colon cancer cell invasion and metastasis, and that expression of the NFATc1-driven transcriptional program correlates with poor prognosis in Stage II and III colorectal cancer patients.
MATERIALS AND METHODS
Human and mouse gene expression data
Human gene expression data sets were downloaded from the Gene Expression Omnibus (GEO) database (http://www.ncbi.nlm.nih.gov/geo/) and the ArrayExpress Archive (http://www.ebi.ac.uk/microarray-as/ae/) (Supplementary Table 1). Each gene expression data set was processed separately to generate a gene by sample expression matrix with normalized, log transformed and standardized expression values (see Supplementary Methods). The mouse gene expression data set was downloaded from the GEO GSE19073 (15) and the differential expression analysis was described in detail in Supplementary Methods.
Integrated network construction, co-expression module identification and enrichment analysis
For each human CRC data set selected for integration, Pearson’s correlation coefficients and the log likelihood ratio (LLR) for functional relevance were calculated for all gene pairs. Next, an integrated LLR score was calculated for each gene pair, and a score cutoff was selected to achieve a balance between consistency with existing knowledge and network coverage. An integrated gene co-expression network was then constructed in which each node is a gene while two nodes are connected by an edge if corresponding LLR score is above the selected cutoff (for additional detail, see Supplementary Methods). For the identification of co-expression modules, we used a modified version of the Iterative Clique Enumeration (ICE) algorithm (16). GO biological process enrichment analysis of the co-expression modules and transcription factor target enrichment analysis were performed using WebGestalt (17). The ranked list of genes according to their differential expression levels in the mouse data set was employed to identify metastasis-related modules using the GseaPreranked analysis available in the GSEA software downloaded from http://www.broadinstitute.org/gsea/. Default parameters were used for the analysis.
Survival analysis
Survival analysis was performed in R using the survival package. Specifically, survival curves were estimated using the Kaplan-Meier method, and survival comparisons among groups were made by the log-rank test. Two data sets were used for the survival analysis. The data set GSE17536 was from the Moffitt Cancer Center and has been previously published. The data set GSE38832 was from the Vanderbilt University Medical Center, which included 54 samples from the previously published data set GSE17537 and 68 newly analyzed samples. The COMBAT approach based on empirical Bayes frameworks was applied to remove batch effects across the two batches of microarray experiments (18).
Human tissue samples
Human tissues used for microarray analysis were collected following written informed consent and clinically annotated according to established protocols and approved by the appropriate Institutional Review Boards (IRB) at the Moffitt Cancer Center and Vanderbilt University as previously described (GSE17536 and GSE17537) (15).
RNA preparation and analysis
Total RNA from cells or tissues was isolated using QIAGEN kits (QIAGEN, Valencia, CA) and DNase-I treated, quantified by Nanodrop-1000 (Thermo Scientific, Rockford, IL) and assessed for quality on an Agilent Bioanalyzer as previously described (15). Chromosome Immunoprecipitation (ChIP) studies were conducted using mouse anti-NFATc1 specific antibody from Santa Cruz Biotechnology (Santa Cruz, California) and an kit from Millipore (Billerica, MA), according to the manufacturer’s instructions. Quantitative RT-PCR (qPCR) was performed as described elsewhere (19), gene specific primers are listed in Supplementary Tables 2–3.
Cell culture
The MC-38 mouse adenocarcinoma cell line and its derivatives were provided by Dr. Robert Coffey are described elsewhere (15). HCT116 and HT29 colon cancer cell lines were obtained from American Type Culture Collection (Manassas, Virginia). All cell lines were maintained at low passage as monolayers in RPMI-1640 medium (Gibco Life Technologies, Rockville, MD) supplemented with 10% fetal bovine serum (Atlanta Biologicals, Lawrenceville, GA) 500U/ml Penicillin G, 500 μg/ml Streptomycin (Gibco Life Technologies Inc., Rockville, MD) and L-glutamine (Gibco Life Technologies Inc., Rockville, MD). FK506 (Sigma) was used at 20ng/mL. Integrity of human cell lines used in this study was tested by RNAseq analysis in May 2013. Cytoplasmic and nuclear extracts were prepared using Nuclear Extract kit (Active Motif, Carlsbad, CA), according to manufacturer’s instructions.
Immunoblots
Cells were harvested in RIPA lysis buffer (50mM Tris pH7.5, 150mM NaCl, 1% NP-40, 0.5% Na-deoxy Cholate, 0.1%SDS) containing a cocktail of protease inhibitors (Roche Diagnostics, Indianapolis, IN), with a brief sonication. Samples were mixed with LDS buffer containing DTT (Invitrogen, Carlsbad, CA), and fractionated on 4–12% NuPAGE gels in MOPS-SDS buffer (Invitrogen, Carlsbad, CA). Antibodies against NFATc1-c4 and PARP1/2 were obtained from Santa Cruz Biotechnology (Santa Cruz, CA) β-Actin from Sigma Chemical (St. Louis, Mo) and α-Tubulin from Abcam Scientific (Cambridge, Mass.). Ramos cell (Burkitt’s lymphoma, B lymphocytes) lysate (Santacruz Biotechnology) was used as positive control.
Invasion assays
Invasion assays were conducted using both Boyden chambers as described elsewhere (15) as well as the xCELLigence system from Roche Diagnostics (50) (see also Supplementary Methods).
Overexpression and inhibition of NFATc1
RNAi studies were performed as previously described using NFATc1 specific ON-target plus SMART pool siRNA or ON-target plus Non-targeting Pool (Thermo Scientific; Rockford, IL,) Specific si-RNA sequences are given in Supplementary Table 4.
For preparing stable over-expressing cells, mouse wild-type NFATc1 (Addgene plasmid 11101) (20) was cloned into vector pGP-Lenti3 (GenBank Accession no. JX861384) between unique XbaI and BamHI sites. Puromycin and GFP expression were used as selection markers for creation of stable cell lines.
For gene knockdown experiments, NFATc1 specific GIPZ lentiviral shRNAmir (V3LMM_418820) (Thermoscientific) was selected for experimental use. Briefly, MC38 cells were electroporated using NEON (Invitrogen). Puromycin and GFP expression were used as selection markers for creation of stable cell lines. For HT29 studies, cells were transiently co-transfected with pEF6-NFATc1 and pMaxGFP vectors, flow sorted to enrich for highly expressing GFP-positive cells and confirmed NFATc1 overexpression by Western blot.
Animal studies
All animal studies were approved by the Vanderbilt Institutional Animal Care and Use Committee and performed in accordance with the standards of the Association of Assessment and Accreditation of Laboratory Care (AAALAC). Procedures were performed using both parental and stable transfected cell lines as previously described (15).
Statistical analyses for experimental procedures
Statistical analyses for all experimental procedures were conducted in Graphpad Prism 5. (GraphPad Software, San Diego, CA, USA). p<0.05 was considered statistically significant.
RESULTS
Integrated human colorectal cancer co-expression network
We first identified 14 publicly available human colorectal cancer gene expression data sets (Supplementary Table 1) and eliminated 3 sets for which the association between pairwise gene co-expression and functional relevance was not clear (Supplementary Results, Supplementary Figure 2). We also found that the 11 remaining data sets contain complementary functional information (Supplementary Results, Supplementary Figure 3) and were therefore suitable for integration and development of a comprehensive co-expression network.
Following Ramani et al. (21), we constructed three co-expression networks based on three LLR cutoffs and evaluated the functional relevance of the networks using random gene pairs and interacting protein pairs (Supplementary Methods) as negative and positive references, respectively. As shown in Figure 1A, all three networks (cyan, pink, and green curves) clearly outperformed the negative reference (black), and a higher LLR cutoff corresponded to higher functional relevance of gene pairs in the co-expression network. The functional relevance of the co-expression network derived from an LLR cutoff of 1.25 (green) approached that for the curated protein interaction network (red), suggesting a high biological validity of the co-expression network. In order to capture novel functional relationships offered by the co-expression network analysis that may not be supported by existing knowledge, we used a slightly relaxed LLR cutoff of 1 and constructed the integrated colorectal cancer co-expression network with 2,285 genes and 13,083 edges (Supplementary File 1). A co-expression network derived from the GSE17536 data set with an LLR cutoff of 0.74 showed a similar level of functional relevance as that of the integrated network (Figure 1A, dashed pink curve). However, it included only 1,226 genes and 7,516 edges. Therefore, data integration helped achieve a significantly better network coverage with 86% more genes and 74% more edges. The integrated network represents one of the most comprehensive co-expression networks for a specific cancer type and can serve as a resource for other investigators for the study of cancer-associated gene function and identification of candidate cancer driver gene programs.
Figure 1. Identification of NFAT as a potential regulator of metastasis.
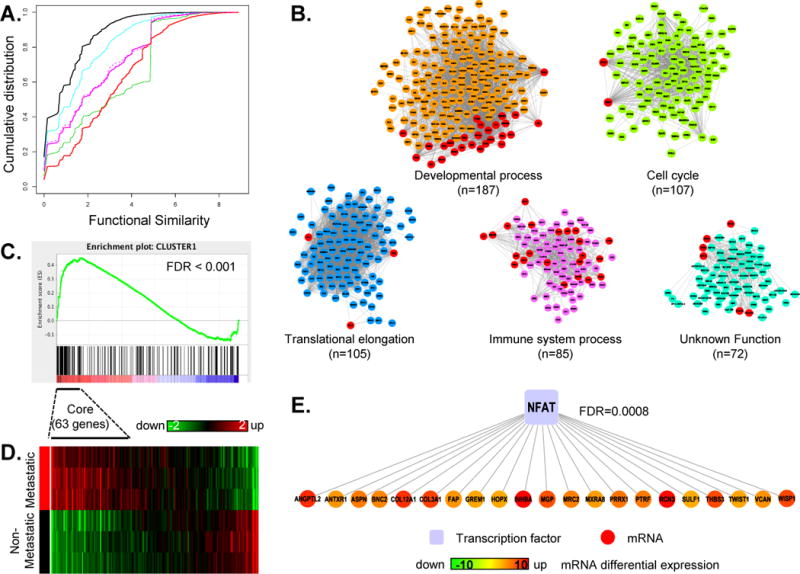
(A) Cumulative distribution function (CDF) curves of semantic similarities for gene pairs in co-expression networks based on LLR cutoffs of 0.5 (CYAN), 1 (PINK), and 1.25 (GREEN), compared to gene pairs in the stand alone co-expression network derived from GSE17536 with a Pearson’s correlation coefficient cutoff of 0.74 (DOTTED PINK). CDF curves for all gene pairs and interacting protein pairs are included as negative (BLACK) and positive (RED) references, respectively. (B) The largest five co-expression modules, each depicted in a distinct color scheme and annotated with associated biological processes are shown. Red nodes indicate genes shared between modules. (C) GSEA analysis indicates enrichment of mouse model genes in the module representative of developmental processes (FDR<0.001). (D) Expression pattern for all genes in the developmental process module appearing in the mouse data, with the 63 leading edge genes identified by GSEA denoted as core genes. (E) Fisher’s exact test indicates significant enrichment of NFAT targets (21 genes, FDR=0.0008) among the 63 core genes.
Transcriptional programs encoded in the network
The integrated network had a high clustering coefficient of 0.58, indicating a highly modular network structure (22). Using a modified version of the ICE algorithm (16), we identified 441 co-expression modules (Supplementary Figure 4, Supplementary File 2) from the network, among which 38 included 10 or more genes.
Figure 1B depicts the five largest modules with 187, 107, 105, 85, and 72 genes, respectively. Four of the top five modules showed significant enrichment (FDR <0.01, hypergeometric test) in distinct biological processes including developmental process, cell cycle, translational elongation, and immune system process, respectively. The fifth module was not enriched in any of the defined GO biological processes (labeled as unknown function). Interestingly, among the 72 genes in this module, only 27 (37%) had a GO biological process annotation, in contrast to an average of 85% annotated genes in the other four modules. It is possible that this module may represent a transcriptional program underlying an understudied biological function.
Metastasis-related transcriptional programs and candidate effectors
We ranked all human genes based on the differential expression level of their mouse orthologs in the poorly metastatic parental MC38 cell line (designated as MC38Par) and the highly metastatic MC38 cell-derived colon cancer cell line (MC38Met) (15). For each co-expression module, we used the GSEA to test whether genes in the module were significantly enriched in the top or bottom of the ranked list, indicating coordinate up- or down-regulation of the module in the metastatic cell line.
The module consisting of 187 genes functionally linked to developmental process (Figure 1B) was enriched with genes up-regulated in the metastatic cells (FDR < 0.001), whereas the module consisting of 107 genes functionally linked to cell cycle was enriched with genes that are down-regulated in the metastatic cells (FDR = 0.01). This pattern is consistent with reduced cell proliferation and increased motility in cells undergoing epithelial to mesenchymal transition (EMT), a developmental process implicated in cancer metastasis (23). Owing to its significant association to the metastatic cell gene expression profile, we focused on the 187-gene module for further study. We identified 63 core genes in this module that accounted for the enrichment signal in the metastatic cells (Supplementary File 3, Figure 1C). As shown in Figure 1D, mouse orthologs of the 63 core genes showed clear up-regulation in MC38Met compared with MC38Par, whereas those of non-core genes were either not differentially expressed or down-regulated in MC38Met. This result indicates that a substantial portion, but not all, of the co-expression relationship was conserved between human tumors and the mouse model. The 63 core genes are positively correlated in human and mouse, and thus, serve as candidate effectors of a transcriptional program associated with a metastatic phenotype.
Identification of NFAT as a potential regulator of the metastasis-associated transcriptional program
We performed enrichment analysis for the 63 core genes against the gene sets of transcription factor targets and found that one third of the genes in the module were putative targets of the NFAT family transcription factors, representing significant enrichment (FDR=0.0008, Fisher’s exact test, Figure 1E, Supplementary File 4). As a set, these genes are functionally enriched for skeletal and muscular system development, connective tissue development, and for cell movement, growth and proliferation (Supplementary Table 5).
We next assessed the mRNA expression of NFAT family members and 21 putative target genes in 22 stage II and III fresh frozen primary human colorectal cancer tumor specimens. We found that mRNA for 19 out of the 21 putative NFAT target genes were significantly up-regulated in the tumor specimens as compared to normal adjacent tissue (Supplementary Figure 5). We next assessed the expression of individual NFAT members and the 21 target genes using microarray data from the isogenic mouse cell lines and from primary tumor data. Among the four NFAT members examined, NFATc1 mRNA was the most differentially expressed (FDR=0.0001) between MC38Met and MC38Par cells, with almost 3-fold (p<3E–06, moderated t-test) increase in metastatic cells (Supplementary Table 6). Moreover, two NFATc1 probe sets (21105_s_at and 210162_s_at) correlated best with the major cluster of the 21 metastasis-related NFAT transcriptional target genes in three independent patient cohorts (Supplementary Figure 6 B–D). These data suggested that NFATc1, specifically, is associated with a metastasis-associated transcriptional program in human colorectal cancer.
NFATc1 expression is associated with invasive behavior of colon cancer cells
We found that pharmacological inhibition of NFATs using FK506 reduced both cell invasiveness and expression of metastasis associated target genes (Supplementary Figure 7). We next wanted to assess the role of NFATc1 expression, specifically, in regulating invasiveness. We found that experimental inhibition of NFATc1 expression in MC38Met cells by RNAi resulted in a specific decrease in NFATc1 mRNA and protein expression. In Figure 2, four members of the NFAT family are evaluated for off-target effects of the RNAi at the mRNA and protein levels. First, the effect of siNFATc1 on NFATc1 specific mRNA levels is evaluated in MC38Met cells relative to siSCR control and parental lines (Panel 2A). Next, the effect of the RNAi’s are evaluated on NFATc2 (Panel 2B) and NFATc3 (Panel 2C) specific mRNA expression, demonstrating no off-target effects relative to parental siSCR controls. In Panel 2D, the specificity of the NFATc1 specific knockdown can be appreciated at the protein level, as well, with no off-target effects shown for NFAT family members c2–c4. Importantly, treatment of MC38Met with NFATc1-specific RNAi caused a significant reduction in cell invasion of MC38Met cells (Figure 2E). Thus, the siNFATc1 specific RNAi (a pool of 4 distinct RNAi’s was used in this experiment, sequences are given in Supplementary Table 4) has no detectable off-target effects on NFAT family member specific mRNA species or proteins, demonstrating the specificity of the observed effects on cell invasion.
Figure 2. Inhibition of NFATc1 in MC38Met cells.
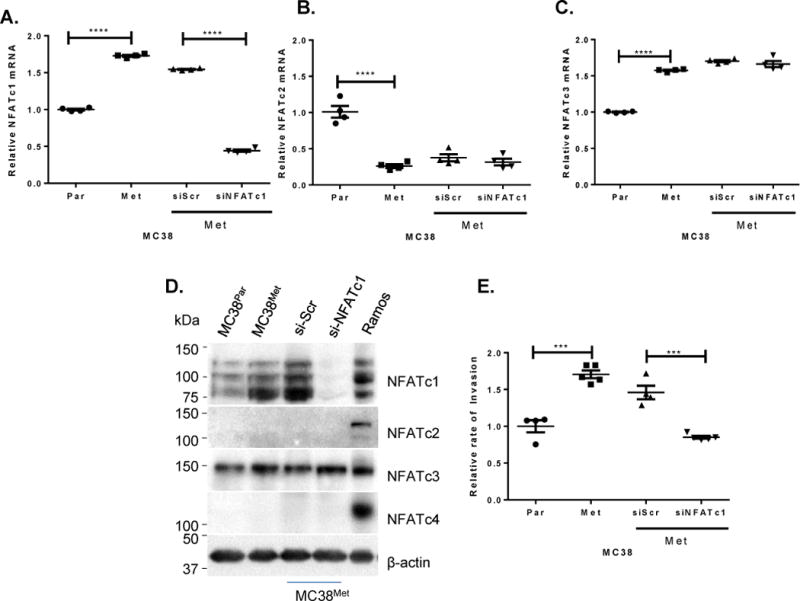
Effect of control RNAi (siScr) or NFATc1 specific RNAi on specific NFAT mRNA species: (A) NFATc1, (B) NFATc2 (C) NFATc3. (D) The effect of NFATc1 siRNA vs scrambled control si-Scr on NFAT family protein levels in MC38Met cells, and steady state levels in both MC38Par and MC38Met cells with Ramos cell lysate positive control in the right hand lane. (E) Relative rates of invasion for cells shown in (A–D) (F)
In order to determine the relevance of NFATc1 expression in human cancer cells, we manipulated expression levels in HT29 (low to undetectable NFATc1 expression) and in HCT116 cells (high endogenous NFATc1 expression). We found that transient overexpression of NFATc1 in HT29 cells (Figure 3A) had no effect on cell viability or proliferation (Figure 3B) but significantly increased cell invasion (Figure 3C). In contrast, when RNAi was used to specifically inhibit NFATc1 expression in HCT116 cells (Figure 3D–E), we found that targeted RNAi treatment did not significantly affect cell proliferation (Figure 3F) and was associated with a significant decrease in the rate of invasion through matrigel as compared to the siSCR control (Figure 3G).
Figure 3. NFATc1 expression is associated with cell invasion in human colon cancer cells.
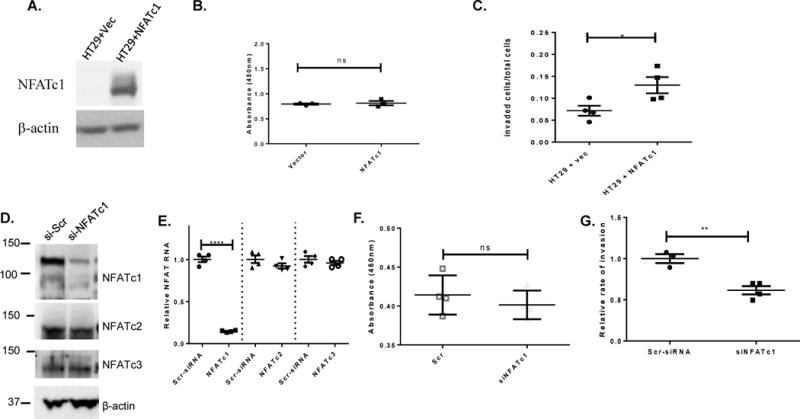
(A) Western Blot showing NFATc1 levels in vector-transfected and NFATc1-transfected HT29 colon cancer cells. (B) Representative live cell measures after a 24 hour growth period using pools of HT29 cells shown in (A). (C) Relative rates of invasion through matrigel at 24hrs (*p<0.04) of cells depicted in (A). (D) Western Blot showing protein expression of NFATc1-c3 family members in HCT116 cells treated with either control RNAi (si-Scr) or NFATc1 specific RNAi (si-NFATc1). (E) Representative live cell measures of HCT116 cells shown in (D–E) (G) Relative rate of HCT116 cell invasion through matrigel shown in (D–F) (representative experiment, ** p<0.004).
NFATc1 activity is primarily regulated at the post-translational level by phosphorylation, so variations in NFATc1 expression levels across human colon cancer specimens, particularly in the epithelial compartment, is low (data not shown). However, the range of expression of the putative targets of NFATc1 activity identified with our filtered integrated data network is diverse and so may be used as surrogate biomarkers for NFATc1 activity in human specimens. Combining the results of experiments conducted in MC38 cells, we found that 8 out of 21 genes from the metastatic module are consistently altered by NFAT activity and NFATc1 expression in MC38Met cells (Figure 4A–B, Supplementary Figure 7, Supplementary Table 5). These 8 genes include Angiopoeitin (ANGPTL2), Asporin (ASPN), Collagen 3A1 (COL3A1), Matrix Gla Protein (MGP), Mannose receptor (MRC2), Fibroblast activating protein (FAP), Polymerase I and Transfer Release Factor (PTRF), and TWIST1. ChIP assays confirmed enrichment of NFATc1 on promoters on 7 out of 8 of these genes in metastatic MC38 cells (Figure 4C, Supplementary File 5). This 8 gene set is functionally enriched in cell movement (ANGPTL2, COL3A1, FAP, MGP, MRC2, TWIST1) and cancer (TWIST1, COL3A1, ANGPTL2, ASPN, FAP, MGP, MRC2, PTRF). Importantly, we also observed significant overlap between these 8 genes and previously published colon cancer specific prognostic signatures (15, 24–27), indicating that our integrative approach largely supports and builds upon a significant group of published studies in this area by providing a biologically-based underpinning for the signature (Supplementary Table 7). While developmental pathways and activation of cell movement processes have been strongly linked with cancer progression in other experimental models (15, 25–29), these findings are the first to link them with cell autonomous NFATc1 expression and invasive activity in tumor cells.
Figure 4. Evidence for a dominant set of NFATc1 target genes.
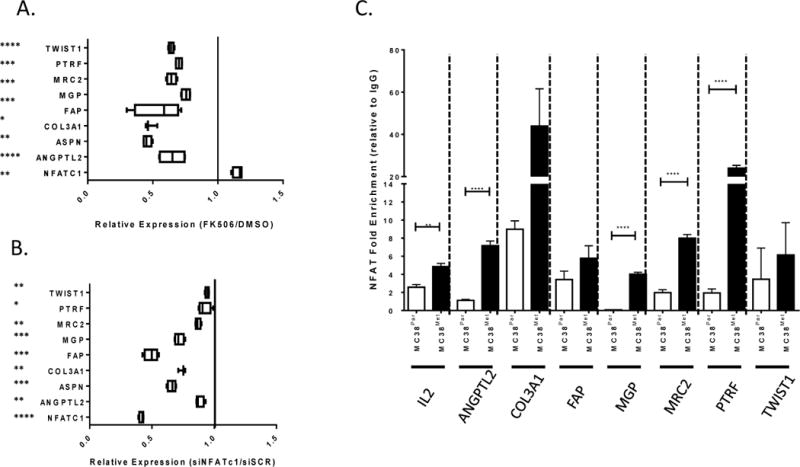
(A) Expression of eight putative target mRNA species significantly associated with NFATc1 expression in MC38Met cells following FK506 treatment (relative to DMSO control, n=4, significance is determined by 1-sample t-test against equivalence or ratio=1 as shown by verticle line). (B) Expression of eight mRNA species significantly associated with NFATc1 expression in HCT116 cells following treatment with NFATc1 specific RNAi (relative to siSCR, n=4, significance is determined by 1-sample t-test against equivalence or ratio=1 as shown by verticle line).(C) Quantification of NFATc1 pull-down on putative target gene specific promoter binding elements relative to IgG control (ASPN mRNA species undetectable, not shown). ns=p>0.05, *p<0.05,**p<0.005,***p<0.0005, ****p<0.00005.
To test whether these 8 genes can be used to identify colorectal cancers with poor prognosis, we examined their expression levels in two clinically annotated cohorts of stage II–III colorectal cancer tumors. As shown in Figures 5A–B, increased expression of these genes is associated with increased number of recurrence and death events for stage II and III patients. To statistically evaluate the correlation of the 8 genes with colorectal cancer outcomes, we performed a survival analysis based on a combined VUMC and MCC data set. Based on the average of standardized gene expression levels of the 8 genes, patients were classified into two groups (above median expression and below median expression). We found that the group of patients with above-median expression had significantly shorter overall survival (OS: p=3.2e-05, hazard ratio [HR]=3.56, Figure 5C), worse disease specific survival (DSS: p=6.5E-06, HR=7.89, Figure 5D), and shorter disease-free survival (DFS: p=1.1E-04, HR=3.76, Figure 5E) as compared with the below-median group. These data show that increased expression of the NFATc1-driven transcriptional program correlates with worse outcomes for stage II–III patients and suggest a novel role for NFATc1 in promoting tumor progression.
Figure 5. An NFAT-driven transcriptional program is correlated with poor outcomes in Stage II and III colorectal cancer patients.
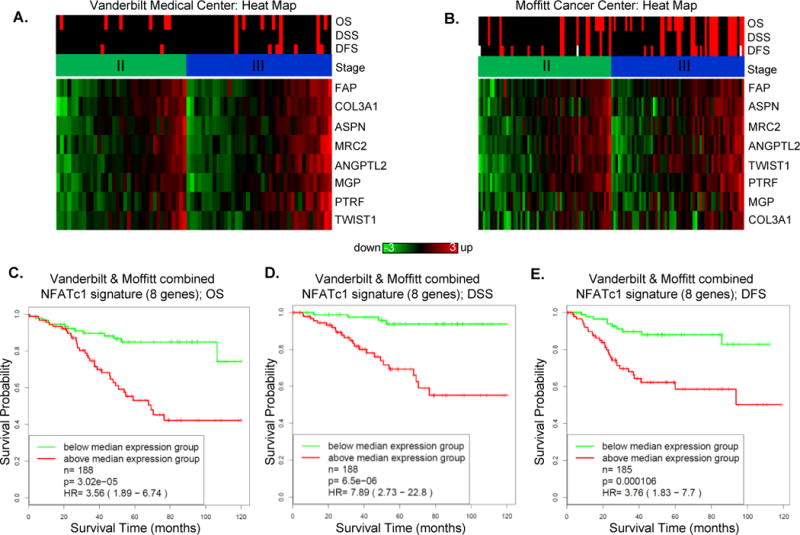
(A–B) NFATc1 signature gene expression patterns in stages II & III colorectal cancer specimens in (A) Vanderbilt Medical Center (GSE 38832) and (B) Moffitt Cancer Center (GSE17536) data sets. The top three rows indicate whether or not a disease-specific death event or a recurrence event was recorded in follow up (black = no event, red=event, white=not available), respectively. The fourth row indicates the cancer stage (green=stage 2, dark blue=stage 3). (C–E) Overall, disease-specific and disease-free survival (OS, DSS, DFS) analyses based on a combined Vanderbilt and Moffitt data sets.
NFATc1 expression and the metastatic potential of MC38 colon cancer cells in vivo
To determine whether the NFATc1-associated changes in cell migration and invasion observed in cell culture are also associated with changes in metastatic potential in vivo, we manipulated NFATc1 expression in MC38 cells and tested their metastatic potential in isogenic and immunocompetent mice as described previously (15). For these studies, we performed stable transfection of MC38Parcells with constitutively expressed NFATc1 (MC38Par + NFATc1) (Figure 6A, B) and showed that these cells exhibited a higher rate of trans-endothelial invasion as compared with the MC38Par+Vec control cells (Figure 6C). For the in vivo experiments, mice injected intrasplenically with MC38Par+NFATc1 cells exhibited a greater metastatic liver tumor incidence and overall tumor burden as compared to those injected with MC38Par+Vec control cells. Strikingly, liver metastasis from MC38Par+NFATc1 cells were mostly diffuse and replaced most of the liver parenchyma in contrast to very little metastatic colonization in mice injected with MC38Par+Vec control cells (n=12–14 mice per cell line, Figure 6D–G and Supplementary Figure 8 C–D). Moreover, target gene expression was predictably upregulated in these cells, consistent with a regulatory role for this network in metastasis in vivo (Supplementary Figure 8E). Thus, overexpression of NFATc1 and the target gene network in MC38Par cells increased their metastatic potential in vivo.
Figure 6. Overexpression of NFATc1 in MC38Par cells increases tumor incidence and liver metastases.
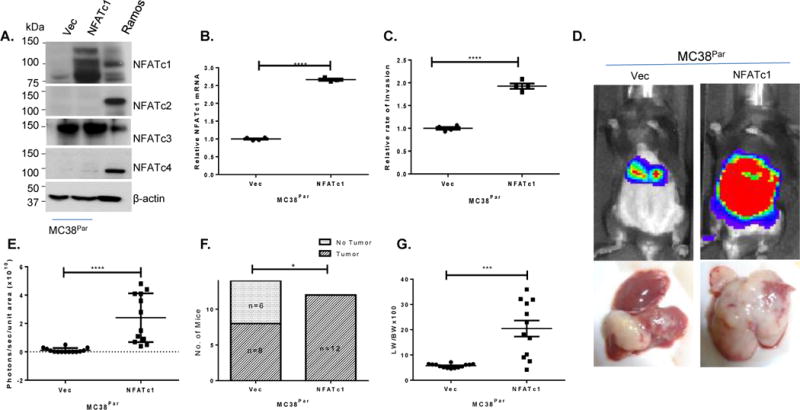
(A) Western Blot showing NFAT proteins in MC38Par cells transfected with either empty vector (VEC) or NFATc1, β-actin is used as a loading control and Ramos extract as positive control. (B) Analysis of NFATc1 mRNA in MC38Par cells shown in (A). (C) Rates of trans-endothelial invasion for MC38Par cells shown in (A–B). Individual replicate wells from a representative experiment are plotted with the mean and the standard error of the mean (bars and whiskers). (D) Representative mice from splenic metastasis model (n=12–14/group) using MC38Par cells shown in (A–D). (E) Bioluminescence of mice injected with MC38Par cells shown in (A–D) at 14th days. (F) Incidence of liver metastases for mice injected at day 14. (G) Liver weight to body weight ratio in mice injected with either MC38Par shown in (A–F) cells at day 14 post-injection. *p<0.02, *** p=0.0004, **** p<0.0001.
In complementary studies, stable NFATc1 specific shRNAmir expressing MC38Met cells (MC38Met+shNFATc1) or control scrambled shRNAmir (MC38Met+shCtrl) cells were generated (Figure 7A–B). We found thatMC38Met+shNFATc1 cells exhibited a lower rate of invasion as compared to the MC38Met+shCtrl cells (Figure 7C). Intrasplenic injection of the MC38Met+shNFATc1 cells resulted in reduced metastatic liver tumor burden as measured by bioluminescence (Figure 7D–E; p<0.04), lower tumor incidence (Figure 7F; p<0.03), and reduced liver weight to body weight ratio (Figure 7G; p<0.0004) as compared to mice injected with MC38Met+shCtrl cells (Supplementary Figure 8A–C). Moreover, target gene expression was predictably downregulated in these cells and consistent with a role for this NFATc1 network in regulating metastasis in vivo. Supplementary Table 8 summarizes the statistics of the in vivo experiments in table format.
Figure 7. Knockdown of NFATc1 in MC38Met cells decreases tumor incidence and liver metastases.
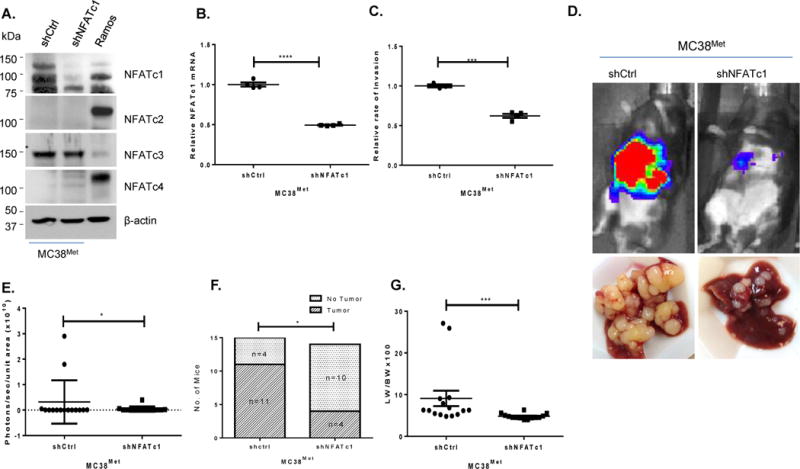
(A) Western Blot showing NFAT proteins in MC38Met+shCtrl and MC38Met+shNFATc1 cell lines, β-actin is used as a loading control and Ramos cell extract as positive control. (B) Analysis of NFATc1 specific mRNA in cells shown in (A) (C) Rates of trans-endothelial invasion for cells are shown in (A–B). Individual replicate wells from a representative experiment are plotted with the mean and the standard error of the mean (bars and whiskers). (D) Representative (n=14–15 mice/group) bioluminescence image corresponding day 21. (E) Summary of bioluminescence signal quantified at day 21. (F) Summary incidence of liver metastases. (G) Liver metastases measured by liver weight to body weight ratio at 21 days post-injection. *p<0.03, *** p<0.001, **** p<0.0001.
Thus, the above-described in vivo studies confirm a role for tumor cell expression of NFATc1 in regulating the metastatic behavior of colon cancer cells in an immunocompetent mouse model, strengthening the evidence that such a mechanism can also play a role in human colorectal cancer. However, our results do not rule out a cooperative role of other NFAT members in disease progression, as has been shown by others in pancreatic cancer (30–32), leukemia (33, 34), breast cancer (35, 36) and in melanoma (37), nor does it rule out cooperative effects of other signaling pathways in contributing to these effects. Further studies are needed to determine the precise regulation of genes from this module and to determine whether or not non-cell autonomous signals may be required for full expression of the prognostic genes.
In summary, we combined multiple publicly available microarray data sets to identify a novel cell autonomous role for NFATc1 in regulating cell invasion and metastasis in colon cancer and to further link that activity to expression of 8 target genes whose expression is associated with clinical outcomes in patient samples. A unique strength of this study is the quality evaluation of publicly available human microarray data sets and systematic integration of the data into a co-expression network for module analysis. Although the co-expression modules were identified in an unsupervised manner, filtering the modules using expression data from a mouse model allowed us to identify a group of co-regulated genes whose expression is associated with poor outcomes in human colorectal cancer. Moreover, NFATc1, the regulator of a group of co-expressed genes associated with poor colorectal cancer patient outcomes, was demonstrated to promote metastasis in mice. Thus, the integrative approach addresses the sample size limitations of earlier prognostic gene signature studies and the use of the immunocompetent mouse model represents important aspects of a disease-appropriate microenvironment in the metastatic process.
Supplementary Material
Acknowledgments
The authors wish to acknowledge Tanner J. Freeman for critical input and thank Connie Weaver and Keeli Lewis for technical expertise.
Financial support: GM088822 (to R.D.B and B.Z), CA095103 (to R.D.B., CA158472 (to X.C and R.D.B), K12 CA9060625 (to KC), the Vanderbilt-Ingram Cancer Center Support Grant (CA0684845), the Clinical and Translational Science Award to Vanderbilt (UL1RR024975), Vanderbilt Digestive Disease Research Center (DK058404), and the Vanderbilt Cooperative Human Tissue Network U01CA094664 and NIH
Footnotes
Conflict of interest: The authors disclose no potential conflicts of interest.
References
- 1.Siegel R, Naishadham D, Jemal A. Cancer statistics, 2012. CA Cancer J Clin. 2012;62:10–29. doi: 10.3322/caac.20138. [DOI] [PubMed] [Google Scholar]
- 2.ACS. Cancer Facts and Figures. Atlanta Georgia: American Cancer Society; 2012. [Google Scholar]
- 3.Niedzwiecki D, Bertagnolli MM, Warren RS, Compton CC, Kemeny NE, Benson AB, 3rd, Eckhardt SG, Alberts S, Porjosh GN, Kerr DJ, et al. Documenting the natural history of patients with resected stage II adenocarcinoma of the colon after random assignment to adjuvant treatment with edrecolomab or observation: results from CALGB 9581. J Clin Oncol. 2011;29:3146–3152. doi: 10.1200/JCO.2010.32.5357. [DOI] [PMC free article] [PubMed] [Google Scholar]
- 4.Kopetz S, Abbruzzese JL. Barriers to Integrating Gene Profiling for Stage II Colon Cancer. Clin Cancer Res. 2009;15:7451–7452. doi: 10.1158/1078-0432.CCR-09-2523. [DOI] [PubMed] [Google Scholar]
- 5.Shi M, Beauchamp RD, Zhang B. A network-based gene expression signature informs prognosis and treatment for colorectal cancer patients. PLoS One. 2012;7:e41292. doi: 10.1371/journal.pone.0041292. [DOI] [PMC free article] [PubMed] [Google Scholar]
- 6.Crabtree GR, Olson E. NFAT signaling: choreographing the social lives of cells. Cell. 2002;109(Suppl):S67–79. doi: 10.1016/s0092-8674(02)00699-2. [DOI] [PubMed] [Google Scholar]
- 7.Hogan PG, Chen L, Nardone J, Rao A. Transcriptional regulation by calcium, calcineurin, and NFAT. Genes Dev. 2003;17:2205–2232. doi: 10.1101/gad.1102703. [DOI] [PubMed] [Google Scholar]
- 8.Macian F. NFAT proteins: key regulators of T-cell development and function. Nat Rev Immunol. 2005;5:472–484. doi: 10.1038/nri1632. [DOI] [PubMed] [Google Scholar]
- 9.Wu H, Peisley A, Graef IA, Crabtree GR. NFAT signaling and the invention of vertebrates. Trends Cell Biol. 2007;17:251–260. doi: 10.1016/j.tcb.2007.04.006. [DOI] [PubMed] [Google Scholar]
- 10.Ranger AM, Oukka M, Rengarajan J, Glimcher LH. Inhibitory function of two NFAT family members in lymphoid homeostasis and Th2 development. Immunity. 1998;9:627–635. doi: 10.1016/s1074-7613(00)80660-3. [DOI] [PubMed] [Google Scholar]
- 11.Oikawa T, Nakamura A, Onishi N, Yamada T, Matsuo K, Saya H. Acquired expression of NFATc1 downregulates E-cadherin and promotes cancer cell invasion. Cancer Res. 2013;73:5100–5109. doi: 10.1158/0008-5472.CAN-13-0274. [DOI] [PubMed] [Google Scholar]
- 12.Horsley V, Aliprantis AO, Polak L, Glimcher LH, Fuchs E. NFATc1 balances quiescence and proliferation of skin stem cells. Cell. 2008;132:299–310. doi: 10.1016/j.cell.2007.11.047. [DOI] [PMC free article] [PubMed] [Google Scholar]
- 13.Fougere M, Gaudineau B, Barbier J, Guaddachi F, Feugeas JP, Auboeuf D, Jauliac S. NFAT3 transcription factor inhibits breast cancer cell motility by targeting the Lipocalin 2 gene. Oncogene. 2010;29:2292–2301. doi: 10.1038/onc.2009.499. [DOI] [PubMed] [Google Scholar]
- 14.Singh G, Singh SK, Konig A, Reutlinger K, Nye MD, Adhikary T, Eilers M, Gress TM, Fernandez-Zapico ME, Ellenrieder V. Sequential activation of NFAT and c-Myc transcription factors mediates the TGF-beta switch from a suppressor to a promoter of cancer cell proliferation. J Biol Chem. 2010;285:27241–27250. doi: 10.1074/jbc.M110.100438. [DOI] [PMC free article] [PubMed] [Google Scholar]
- 15.Smith JJ, Deane NG, Wu F, Merchant NB, Zhang B, Jiang A, Lu P, Johnson JC, Schmidt C, Bailey CE, et al. Experimentally derived metastasis gene expression profile predicts recurrence and death in patients with colon cancer. Gastroenterology. 2010;138:958–968. doi: 10.1053/j.gastro.2009.11.005. [DOI] [PMC free article] [PubMed] [Google Scholar]
- 16.Shi Z, Derow CK, Zhang B. Co-expression module analysis reveals biological processes, genomic gain, and regulatory mechanisms associated with breast cancer progression. BMC Syst Biol. 2010;4:74. doi: 10.1186/1752-0509-4-74. [DOI] [PMC free article] [PubMed] [Google Scholar]
- 17.Zhang B, Kirov S, Snoddy J. WebGestalt: an integrated system for exploring gene sets in various biological contexts. Nucleic Acids Res. 2005;33:W741–748. doi: 10.1093/nar/gki475. [DOI] [PMC free article] [PubMed] [Google Scholar]
- 18.Johnson WE, Li C, Rabinovic A. Adjusting batch effects in microarray expression data using empirical Bayes methods. Biostatistics. 2007;8:118–127. doi: 10.1093/biostatistics/kxj037. [DOI] [PubMed] [Google Scholar]
- 19.Freeman TJ, Smith JJ, Chen X, Washington MK, Roland JT, Means AL, Eschrich SA, Yeatman TJ, Deane NG, Beauchamp RD. Smad4-mediated signaling inhibits intestinal neoplasia by inhibiting expression of beta-catenin. Gastroenterology. 2012;142:562–571 e562. doi: 10.1053/j.gastro.2011.11.026. [DOI] [PMC free article] [PubMed] [Google Scholar]
- 20.Monticelli S, Rao A. NFAT1 and NFAT2 are positive regulators of IL-4 gene transcription. Eur J Immunol. 2002;32:2971–2978. doi: 10.1002/1521-4141(2002010)32:10<2971::AID-IMMU2971>3.0.CO;2-G. [DOI] [PubMed] [Google Scholar]
- 21.Ramani AK, Li Z, Hart GT, Carlson MW, Boutz DR, Marcotte EM. A map of human protein interactions derived from co-expression of human mRNAs and their orthologs. Mol Syst Biol. 2008;4:180. doi: 10.1038/msb.2008.19. [DOI] [PMC free article] [PubMed] [Google Scholar]
- 22.Barabasi AL, Oltvai ZN. Network biology: understanding the cell’s functional organization. Nat Rev Genet. 2004;5:101–113. doi: 10.1038/nrg1272. [DOI] [PubMed] [Google Scholar]
- 23.Kalluri R, Weinberg RA. The basics of epithelial-mesenchymal transition. J Clin Invest. 2009;119:1420–1428. doi: 10.1172/JCI39104. [DOI] [PMC free article] [PubMed] [Google Scholar]
- 24.Zhu J, Wang J, Shi Z, Franklin JL, Deane NG, Coffey RJ, Beauchamp RD, Zhang B. Deciphering genomic alterations in colorectal cancer through transcriptional subtype-based network analysis. PLoS One. 2013;8:e79282. doi: 10.1371/journal.pone.0079282. [DOI] [PMC free article] [PubMed] [Google Scholar]
- 25.Anastassiou D, Rumjantseva V, Cheng W, Huang J, Canoll PD, Yamashiro DJ, Kandel JJ. Human cancer cells express Slug-based epithelial-mesenchymal transition gene expression signature obtained in vivo. BMC Cancer. 2011;11:529. doi: 10.1186/1471-2407-11-529. [DOI] [PMC free article] [PubMed] [Google Scholar]
- 26.Loboda A, Nebozhyn MV, Watters JW, Buser CA, Shaw PM, Huang PS, Van’t Veer L, Tollenaar RA, Jackson DB, Agrawal D, et al. EMT is the dominant program in human colon cancer. BMC Med Genomics. 2011;4:9. doi: 10.1186/1755-8794-4-9. [DOI] [PMC free article] [PubMed] [Google Scholar]
- 27.Oh SC, Park YY, Park ES, Lim JY, Kim SM, Kim SB, Kim J, Kim SC, Chu IS, Smith JJ, et al. Prognostic gene expression signature associated with two molecularly distinct subtypes of colorectal cancer. Gut. 2012;61:1291–1298. doi: 10.1136/gutjnl-2011-300812. [DOI] [PMC free article] [PubMed] [Google Scholar]
- 28.Grade M, Hormann P, Becker S, Hummon AB, Wangsa D, Varma S, Simon R, Liersch T, Becker H, Difilippantonio MJ, et al. Gene expression profiling reveals a massive, aneuploidy-dependent transcriptional deregulation and distinct differences between lymph node-negative and lymph node-positive colon carcinomas. Cancer Res. 2007;67:41–56. doi: 10.1158/0008-5472.CAN-06-1514. [DOI] [PMC free article] [PubMed] [Google Scholar]
- 29.Padua D, Zhang XH, Wang Q, Nadal C, Gerald WL, Gomis RR, Massague J. TGFbeta primes breast tumors for lung metastasis seeding through angiopoietin-like 4. Cell. 2008;133:66–77. doi: 10.1016/j.cell.2008.01.046. [DOI] [PMC free article] [PubMed] [Google Scholar]
- 30.Baumgart S, Glesel E, Singh G, Chen NM, Reutlinger K, Zhang J, Billadeau DD, Fernandez-Zapico ME, Gress TM, Singh SK, et al. Restricted heterochromatin formation links NFATc2 repressor activity with growth promotion in pancreatic cancer. Gastroenterology. 2012;142:388–398. e381–387. doi: 10.1053/j.gastro.2011.11.001. [DOI] [PMC free article] [PubMed] [Google Scholar]
- 31.Koenig A, Linhart T, Schlengemann K, Reutlinger K, Wegele J, Adler G, Singh G, Hofmann L, Kunsch S, Buch T, et al. NFAT-induced histone acetylation relay switch promotes c-Myc-dependent growth in pancreatic cancer cells. Gastroenterology. 2010;138:1189–1199. e1181–1182. doi: 10.1053/j.gastro.2009.10.045. [DOI] [PMC free article] [PubMed] [Google Scholar]
- 32.Buchholz M, Schatz A, Wagner M, Michl P, Linhart T, Adler G, Gress TM, Ellenrieder V. Overexpression of c-myc in pancreatic cancer caused by ectopic activation of NFATc1 and the Ca2+/calcineurin signaling pathway. EMBO J. 2006;25:3714–3724. doi: 10.1038/sj.emboj.7601246. [DOI] [PMC free article] [PubMed] [Google Scholar]
- 33.Glud SZ, Sorensen AB, Andrulis M, Wang B, Kondo E, Jessen R, Krenacs L, Stelkovics E, Wabl M, Serfling E, et al. A tumor-suppressor function for NFATc3 in T-cell lymphomagenesis by murine leukemia virus. Blood. 2005;106:3546–3552. doi: 10.1182/blood-2005-02-0493. [DOI] [PMC free article] [PubMed] [Google Scholar]
- 34.Medyouf H, Alcalde H, Berthier C, Guillemin MC, dos Santos NR, Janin A, Decaudin D, de The H, Ghysdael J. Targeting calcineurin activation as a therapeutic strategy for T-cell acute lymphoblastic leukemia. Nat Med. 2007;13:736–741. doi: 10.1038/nm1588. [DOI] [PubMed] [Google Scholar]
- 35.Yoeli-Lerner M, Chin YR, Hansen CK, Toker A. Akt/protein kinase b and glycogen synthase kinase-3beta signaling pathway regulates cell migration through the NFAT1 transcription factor. Mol Cancer Res. 2009;7:425–432. doi: 10.1158/1541-7786.MCR-08-0342. [DOI] [PMC free article] [PubMed] [Google Scholar]
- 36.Yoeli-Lerner M, Yiu GK, Rabinovitz I, Erhardt P, Jauliac S, Toker A. Akt blocks breast cancer cell motility and invasion through the transcription factor NFAT. Mol Cell. 2005;20:539–550. doi: 10.1016/j.molcel.2005.10.033. [DOI] [PubMed] [Google Scholar]
- 37.Flockhart RJ, Armstrong JL, Reynolds NJ, Lovat PE. NFAT signalling is a novel target of oncogenic BRAF in metastatic melanoma. Br J Cancer. 2009;101:1448–1455. doi: 10.1038/sj.bjc.6605277. [DOI] [PMC free article] [PubMed] [Google Scholar]
Associated Data
This section collects any data citations, data availability statements, or supplementary materials included in this article.