

Abstract
Biochemical modifications to mRNA, especially N6-methyladenosine (m6A) and 5-methylcytosine (m5C), are recently shown to be associated with crucial biological functions. Despite the intriguing advancements, little is known so far about the dynamic landscape of RNA methylome across different cell types and how the epitranscriptome is regulated at system level by enzymes, i.e., RNA methyltransferases and demethylases. To investigate this issue, a meta-analysis of m6A MeRIP-Seq datasets from 10 different experimental conditions (cell type/tissue or treatment) are collected, and the combinatorial epitranscriptome, which consists of 42758 m6A sites, is extracted and divided into 3 clusters, in which the methylation sites are likely to be hyper- or hypo-methylated simultaneously (or co-methylated), indicating the sharing of a common methylation regulator. Four different clustering approaches are used, including, K-means, hierarchical clustering (HC), Bayesian factor regression model (BFRM) and nonnegative matrix factorization (NMF) to unveil the co-methylation patterns.
To validate whether the patterns are corresponding to enzymatic regulators, i.e., RNA methyltransferases or demethylases, the target sites of a known m6A regulator, fat mass and obesity-associated protein (FTO), are identified from an independent mouse MeRIP-Seq dataset and lifted to human. Our study shows that, 3 out of the 4 clustering approaches used can successfully identify a group of methylation sites overlapping with FTO target sites at significance level 0.05 (after multiple hypothesis adjustment), among which, the result of NMF is the most significant (p-value 2.81e-06). We defined a new approach evaluating the consistency between two clustering results and shows that clustering results of different methods are highly correlated indicating strongly the existence of co-methylation patterns. Consistent with recent studies, a number of cancer and neuronal disease-related bimolecular functions are enriched in the identified clusters, which are biological functions can be regulated at epitranscriptional level, indicating the pharmaceutical prospect of RNA N6-methyladenosine-related studies.
This result successfully reveals the linkage between the global RNA co-methylation patterns embedded in the epitranscriptomic data under multiple experimental conditions and the latent enzymatic regulators, suggesting a promising direction towards more comprehensive understanding of the epitranscriptome.
Introduction
The dynamic chemical modifications of DNA together with their functions have been well established through intensive studies ranging from simple model organisms to human in the past decade [1–3]. Compared with DNA modifications, RNA modifications are largely neglected, and have yet drawn extensive attention until very recently [4–7]. The presence of chemical modifications to RNA was established as early as 1970s [8–10]. Until today, people have identified over 100 post-transcriptional RNA modifications in all 3 kingdoms of life [11]; however, not much is known so far about their biological, physiological and pathological functions due to technical limitations. Recently, a new technique (differently named as “MeRIP-Seq” [12] or “m6A-Seq” [13]) was proposed in 2012 by two independent groups, for the first time, enabled the global unbiased profiling of mRNA N6-methyladenosine methylome, one component of the epitranscriptome layer of gene regulation [14]. Currently, the only practically feasible unbiased approach for measuring mRNA m6A is MeRIP-Seq technique [12, 13, 15]. MeRIP-Seq pulls down and sequences the methylated mRNA fragments with anti-m6A antibody, and an input control sample is also generated to measure the basal abundance of all genes (see Figure 1).
Figure 1. Illustration of MeRIP-Seq Protocol.

In MeRIP-Seq, two types of samples (IP and control samples) can be generated. In the beginning of the protocol, RNA molecules are firstly sheared into fragments of around 100nt. Through anti-m6A antibody, the IP sample provides unbiased measurement of the methylated RNA fragments; the control sample reflects the basal RNA abundance, including both the methylated and unmodified RNA molecules.
Similar to ChIP-Seq data analysis [16–18], since MeRIP-Seq cannot provide base-resolution, the detection of RNA methylation sites from MeRIP-Seq has been mainly formulated as the “peak detection” problem [19, 20]; however, as point out previously, a single RNA methylation site may be split into 2 sections due to the existence of introns, the peak calling of MeRIP-Seq data should ideally be splicing-aware [14, 19]. Nevertheless, MeRIP-Seq technique successfully combines the essence of methylated DNA immunoprecipitation sequencing (MeDIP-Seq) and RNA sequencing (RNA-Seq) for high-resolution detection of transcriptome-wide RNA methylation modifications. Within 2 years’ time, the technique has been applied to a number of important studies in human, mouse, yeast, etc. [21–25]. Meanwhile, some RNA (de)methylation enzymes are identified [24, 26–28]. These studies together greatly enhanced our understanding of the reversible modifications to mRNA [5, 29].
However, one question remains to be answered is how the epitranscriptome, which consists of tens of thousands of RNA methylation sites, is regulated at system level across multiple conditions by RNA methyltransferases and demethylases. While it is important to cumulate additional knowledge for the function of a specific RNA methylation enzyme under a particular condition to obtain all pieces of a Jigsaw puzzle, it is also necessary to integrate what we have so far for a big picture and untangle the high dimensional RNA methylome of tens of thousands of RNA methylation sites to shape an interpretable picture. The RNA methylome embraces a number of features that make a system level computational analysis necessary and feasible:
The RNA m6A methylome consists of a large number of RNA methylation sites (ranging from 9124 to 46293 m6A sites predicted in different conditions [14]). It has been even speculated that, every RNA molecule may be methylated under a specific condition. Conceivably, dimension reduction technique is necessary to make sense of high-dimensional information. The RNA residuals are methylated or demethylated by a relatively small number of regulators (RNA methyltransferases or demethylases), each of which regulates thousands of RNA methylation sites. In this sense, high dimensional RNA methylation data can be conveniently projected into lower dimensional space of RNA methylation regulators to reveal directly the biochemical causes of the observed phenomenon.
RNA methylation is non-stoichiometric, i.e., a specific residual can be methylated only on a fraction of transcripts, not necessarily all or none. This process is influenced by the “methylation potential” [30], which is the ratio of S-adenosylmethionine (SAM, the universal methyl donor cosubstrate) and S-adnosylhomocysteine (SAH, the by-product of SAM that acts as competitive inhibitor). With the simplest approximation of an equilibrium condition, the ratio between methylated and unmodified residuals is directly proportional to the SAM/SAH ratio, and is independent from the absolute RNA abundance. The fact that the same nucleic acids are not methylated at the same level indicates the specificity of the enzymes, which is more complicatedly determined by the methylation complex.
RNA co-methylation pattern exists due to enzymatic regulators. Consistent with the “SAM/SAH” ratio, the group of RNA methylation sites controlled by the same RNA methylation factor will show hyper- or hypo-methylation simultaneously. This is analogous to transcription factor (TF) network or microRNA (miRNA) network, where the regulated target genes show co-expression pattern consistent with their regulator. Conceivably, the hyper-methylation of a large number of RNA methylation sites may indicates the increase of methyltransferases or the decreases of demethylase. Co-regulation pattern is the key for the identification of latent regulatory factors, which may function at protein level and cannot be directly observable from the high-throughput RNA methylation sequencing data. Due to the activities of RNA methylation enzymes and their specificity, the methylation level of the large number of RNA methylation sites are not independent of each other but show some clustering effect. On one hand, it is likely that a single methylation factor may regulate a large number of RNA methylation sites simultaneously; on the other hand, if we consider a single RNA methylation enzyme can be a protein complex consists of the protein products of several genes, then it is possible that the methylation status of a single site is determined by multiple proteins. Although the real regulatory relationship between RNA methylation sites and enzymes can be more complex, it is practically more convenient to start with simpler computation methods, such as, K-means, and gradually increases the complexity of tools.
RNA co-methylation patterns are likely to have specific biological functions. From evolutionary point of view, to maximize the functionality of RNA methylation as a means of regulation, rather than aimlessly targeting a number of unrelated genes by random, natural selection should favor that an RNA methylation regulator targets functional-related genes to control specific functions so as to add the adaptability of the liver organism. It should be reasonable to assume that the targets of the same RNA methylation enzyme are likely to share functions in common; and on the other hand, for the purpose of validation, if some functions are statistically related to an RNA methylation enzyme, it is likely that identification of the enzyme and its targets is successful.
Transcriptional regulation may indirectly affect the epitranscriptome. Although existing studies mostly focus on the changes of the absolute amount of methylation with the basal RNA expression levels ignored, it is important to notice whether the increase is triggered by transcriptional regulation or by the enzymatic regulation (RNA methyltransferases or demethylases). While the RNA “methylation potential” moderates the ratio of methylated and unmodified molecules, transcriptional regulation directly control the absolute amount of RNA transcripts with the ratio unchanged. In practice, the changes in the absolute amount of RNA methylation can be due to a joint effect of the two (See Figure 2).
Figure 2. Regulation of RNA methylome.

The absolute amount of RNA methylation is affected by transcriptional regulation and enzymatic regulation. On one hand, transcriptional regulation changes the absolute amount of RNA molecules, keeping the relative amount unchanged; on the other hand, enzymatic regulation changes the percentage of methylated RNA with the total amount of RNA molecules unchanged. In this figure, the absolute amount of RNA methylation increases 4 times in cancer compared with the control condition, which is due to a joint effect of transcriptional up-regulation (fold change of 2) and enzymatic hyper-methylation (fold change of 2).
In this study, the combinatorial RNA m6A methylome from 10 experimental conditions (different tissues, cell lines or treatments) is firstly extracted using an R package we developed to study its dynamics. Four different clustering approaches, representing different rationales, are applied to dissect the RNA methylation sites. The results confirm the existence of co-methylation patterns and their relationship with RNA methylation enzymes.
Material and Method
Multiple N6-methyladenosine MeRIP-Seq datasets from different conditions are collected for this analysis. Samples include HEK293, HepG2, U2OS cell lines and brain tissue with different treatments, some with more than 1 biological replicates. The raw data in FASTQ format (SRA) was obtained directly from Gene Expression Omnibus (GEO), and then aligned to the human reference genome assembly (hg19) with spliced aligner Tophat2 [31] for the following analysis. The information of these datasets is summarized in Table 1.
Table 1.
Human MeRIP-Seq Datasets
| ID | Tissue/Cell | Treatment | Other Info | # of Replicates IP & Input |
# of Reads (Million) IP & Input |
Source |
|---|---|---|---|---|---|---|
| h1 | HEK293T | SYSY Ab | 2 & 3 | 145 & 217 | [12] | |
| h2 | NEB Ab | 1 & 3 | 33 & 217 | [12] | ||
| h3 | Brain | 1 & 1 | 22 & 17 | [13] | ||
| h4 | HepG2 | 4 & 3 | 68 & 85 | [13] | ||
| h5 | UV | 1 & 1 | 21 & 7 | [13] | ||
| h6 | HS | 1 & 1 | 34 & 52 | [13] | ||
| h7 | HGF | 1 & 1 | 33 & 23 | [13] | ||
| h8 | IFN | 1 & 1 | 47 & 27 | [13] | ||
| h9 | U2OS | 3 & 3 | 86 & 83 | [21] | ||
| h10 | DAA | 3 & 3 | 80 & 87 | [21] |
To dissect the RNA methylome with clustering approach, the joint epitranscriptome must be firstly extracted. Currently, there is no convenient tool provided with this function. For this purpose, we developed an open source R package RNA Methylation Tool (RMT) for the processing of multiple MeRIP-Seq datasets and extracting the combinatorial epitranscriptome, i.e., all the RNA methylation sites detected under one or more conditions. The general work flow of RMT is shown in Figure 3.
Figure 3. Work Flow of RMT package.
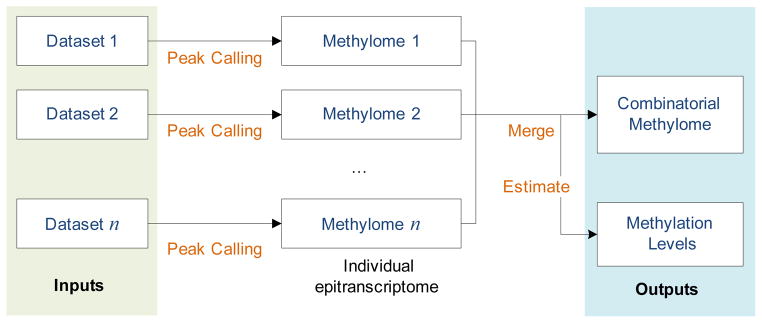
The RMT package is developed for convenient extracting the combinatorial epitranscriptome from multiple MeRIP-Seq datasets obtained from different conditions. Specifically, it requires the input of multiple MeRIP-Seq datasets in the form of aligned BAM files, and outputs all the RNA methylation sites together with their estimated methylation levels. The RMT package is available in Supplementary Material S1.
We will in the next detail each step of RMT work flow.
Extract individual RNA methylome using exomePeak R/Bioconductor package: The very first step of the analysis is to extract all the RNA methylation sites (or the “epitranscriptome”) from each individual MeRIP-Seq experiment. As aforementioned, there are two types of samples in MeRIP-Seq, i.e., IP and control samples. As essentially an enrichment-based approach, since the pull-down reads in the IP sample are enriched with methylated fragments, there is likely a higher number of reads (or a “peak”) appearing near the methylation sites in the IP sample compared with the input control sample, thus the methylation sites may be detected with “peak calling” method. We previously developed the exomePeak R/Bioconductor package [19] for this purpose. The exomePeak package is based on the C-test for comparison of two Poisson means [32] to detect the methylation sites on RNA molecule. As a splicing-aware peak caller focus on the exons only, its effectiveness on MeRIP-Seq peak calling has been demonstrated previously [19].
Merge all detected methylation sites for a combinatorial methylome: RNA methylation is reversible and dynamic under different conditions. The RNA methylome with tens of thousands of RNA methylation sites identified under different conditions in previous step are further merged into a combined set. It is worth mentioning that, the difference between RNA methylome under different conditions is not only due to the context-specificity but also related to noise and the detectability of MeRIP-Seq, i.e., when the expression level of a gene is low, its methylation site can be difficult to detect. The combination of multiple RNA methylomes is conducted in the following way: (1) RNA methylation sites that do not overlap with those detected under a different condition are context-specific and unique, thus all are kept. (2) RNA methylation sites that overlap with those detected under a different condition are not context specific and may appear multiple times. Under this scenario, only the widest methylation sites are kept.
-
Quantification of RNA methylation level: A natural way to quantify the RNA methylation level (percentage of methylated RNA molecules) based on MeRIP-Seq data is the “IP/Input ratio”, which is defined as ratio of the number of reads in IP and input control sample after compensating for the sequencing depth (or total number of reads). However, infinite “IP/Input ratio” might be generated when there are no reads detected in the input sample, which is not rare. Here, we adopt the way of computing gene expression in RNA-Seq with “RPKM” for a specific methylation site. The RNA methylation level is then quantified with:
(1) Where, tm, j indicates the RPKM value of m-th methylation site in the IP sample from j-th biological replicate, and cm, j input control sample. The introduction of RPKM and its fold change into MeRIP-Seq is intuitive and conceptually sound. Please note that, under an ideal scenario of reversible chemical reaction, the methylation level is independent of RNA abundance (transcriptional regulation) and determined by only the “methylation potential”. For the aforementioned reason, the co-methylation patterns embedded is irrelevant to the gene expression. when calculating RPKM value, “R” refers to reads mapped to a specific methylation site, and “K” refers to 1000bp of methylation site. In all the following analysis, multi-reads (reads can be mapped to multiple genomic locations) are excluded to eliminate mapping ambiguity. The redefined methylation level in (1) is then more robust and will not generate infinite value. For most methylation sites, where short reads are more enriched in IP sample compared with input control sample, it should be a positive number.
After extracting the combinatorial RNA methylome and the methylation levels, feature selection was conducted to select the most informatics features (RNA methylation sites) for clustering purpose. For each feature, the methylation level defined in (1) can be determined on every single biological replicate provided the corresponding paired IP and Input control MeRIP-Seq sample is available. For the purpose of detecting co-methylated RNA methylation sites, of interests are those varies significantly across different conditions/replicates. For best clustering effect, it is important to exclude those with small variance in methylation level. We will select features that have larger variance in methylation level across different conditions, then the methylation levels are standardize prior to clustering analysis with:
| (2) |
Whereμm and sm are the mean and sample standard deviation of m-th methylation site, respectively. Based on the standardized matrix of x̂m, j, co-methylation pattern embedded may be extracted. Each co-methylation pattern consists of a number of methylation sites are hyper- and hypo-methylated simultaneously, indicating a common latent regulatory factor at epitranscriptomic level. For this purpose, 4 widely used clustering approaches are adopted, including, K-means, hierarchical clustering, Bayesian factor model [33] and nonnegative matrix factorization [34], each reflects a different underlying assumption. The clustering results are then passed for gene ontology analysis with topGO R/Bioconductor package [35] for functional analysis.
Result and Discussion
RNA methylome of individual sample
The newly developed RMT package internally adapts exomePeak package for peak calling on every individual IP sample. Specifically, the RNA methylation sites under each condition are shown in Table 2, the number of peaks (RNA methylation sites) under a specific condition ranges from 1200 (brain) to 21127 (HepG2). The strand-specific consensus sequences for each condition are then obtained at MEME-ChIP webserver [36] by extracting all the peak regions from hg19 whole genome FASTA file provided from Illumina iGenome. Despite the large variation in the numbers of detected RNA methylation sites, the enriched consensus sequences are similar to the known RRACH motif of m6A [12, 13], indicating the determined RNA methylation sites are accurate and consistent with previous studies.
Table 2.
RNA methylome of a specific biological replicate
| ID | Tissue | Treatment | Other Info | Sample | # of peaks | Motif | E-value |
|---|---|---|---|---|---|---|---|
| h1 | HEK293T | SYSY Ab | S1 | 21114 |
|
2.8e-147 | |
| S2 | 17492 |
|
2.2e-146 | ||||
| h2 | NEB Ab | S3 | 12118 |
|
1.8e-134 | ||
| h3 | Brain | S4 | 1200 |
|
1.5e-019 | ||
| h4 | HepG2 | S5 | 18166 |

|
1.3e-191 | ||
| S6 | 21127 |
|
1.9e-168 | ||||
| S7 | 16441 |
|
2.6e-196 | ||||
| S8 | 15126 |

|
8.3e-102 | ||||
| h5 | UV | S9 | 7545 |
|
4.1e-124 | ||
| h6 | HS | S10 | 16301 |
|
2.2e-140 | ||
| h7 | HGF | S11 | 9477 |

|
2.9e-106 | ||
| h8 | IFN | S12 | 8629 |
|
6.3e-011 | ||
| h9 | U2OS | S13 | 20330 |

|
2.1e-085 | ||
| S14 | 15931 |
|
4.7e-076 | ||||
| S15 | 15698 |
|
1.8e-109 | ||||
| h10 | DAA | S16 | 13342 |
|
1.2e-054 | ||
| S17 | 15985 |

|
8.7e-060 | ||||
| S18 | 12442 |

|
2.7e-055 |
Combinatorial RNA methylome
The combinatorial RNA methylome of 10 different datasets (Table 1) is then extracted by the newly developed RMT package. Thanks to the GenomicFeatures R/Bioconductor package [37], peak merging stage takes only seconds to complete, the most time consuming step is peak calling by exomePeak package. The 258465 RNA methylation sites detected on 18 replicates from 10 different conditions are further merged into 42758 unique RNA methylation sites using the rules previously specified. (See Figure 4 and Supplementary Material S2)
Figure 4. An RNA methylation site spanning a splicing site.

The figure shows an RNA methylation site spanning a splicing site on the CDS of ASXL2 (Entrez Gene ID: 55252). The reads are consistently more enriched in the IP sample compared with the input control sample across 10 different experimental conditions. As shown in the HEK293 and HepG2 tracks, this methylation site consists of several sub-peaks and thus may represent more than 1 methylated residual. It is possible that this peak is detected as several non-joint peaks under some conditions, but this merged unique RNA methylation site is chosen with our aforementioned procedure.
Under individual conditions, different number of merged methylation sites can be observed (see Figure 5A), and consistent with previous studies, the RNA methylation sites are more enriched near the stop codon of mRNA and on 3′UTR region (see Figure 5B). One interesting new observation is that, the RNA methylation sites on lncRNA are consistently more enriched on the 5′end compared with 3′end, whose cause is yet clear (see Figure 5B).
Figure 5. Distribution of RNA methylation sites.

A. The number of unique RNA methylation sites on each biological replicate. Please note that, the sites here represents the merged peaks, which can be different from the number of peaks called by exomePeak on this individual sample. B. This subfigure shows the distribution of unique RNA methylation sites on mRNA and lncRNA with each curve representing one IP sample (total 18). Consistent with previous studies, on mRNA, the RNA methylation sites are highly enriched near stop codon and on 3′UTR region. Interestingly, the RNA methylation sites on lncRNA are slightly more enriched on the 5′end compared with 3′end.
For the merged 42758 unique RNA methylation sites, each on average appears on 1/3 (6 of 18) of biological replicates obtained under 10 different conditions. Specifically, 35.4% (15126) appears only once, and only 33.1% (14415) appears on more than 5 biological replicates, indicating a highly dynamic landscape of RNA N6-methyladnosine. Please note that, this highly specific behavior may partially attribute to detection noise and the dynamics of transcription, i.e., given the current protocol of MeRIP-Seq, it is impossible to detect an RNA methylation site on lowly expressed genes, so dynamics of transcription will also be cumulated in MeRIP-Seq peak calling. We then compared the genomic distribution of the most frequent (appear more than 5 times) and most rare methylation sites (appear only once). As shown in Figure 6, compared with the most frequent methylation sites, the highly specific sites are highly enriched in 5′UTR region of mRNA. On lncRNA, however, they do not show distinct differences.
Figure 6. Distribution of unique RNA methylation sites with different occurrence frequency.

Compared with the most frequent methylation sites (blue curve), the highly specific sites (red curve) are highly enriched in 5′UTR region of mRNA. On lncRNA, the two sets do not show distinct differences.
After extract the combinatorial epitranscriptome of more than 40k RNA m6A sites, their RPKM values are determined for each individual sample, and the methylation levels are calculated and standardized based on equation (1) and (2). Feature selection was conducted to select 3274 methylation sites with sample variance larger than 30. The selected methylation sites having methylation levels changing significantly across different conditions are then passed to clustering algorithm for discovery of the co-methylation patterns. Specifically, we applied four clustering algorithms to cluster the 3274 RNA methylation sites, including K-means, hierarchical clustering (HC), non-negative matrix factorization (NMF) and Bayesian Factor Regression Model (BFRM). An important predefined parameter for clustering analysis is the optimal number of clusters, which is pre-determined with cluster silhouettes of K-means method in a model selection procedure (see Figure 7). In our analysis, the other 3 clustering approaches adapt the same number of clusters for easy comparison purpose. It is worth mentioning that, the optimal number of clusters 3 is determined with a small subset of the data available (10 different conditions), and the actual number of RNA methylation regulatory factors can be much larger with a lot more different cell types.
Figure 7. Silhouette value of K-means clustering method.

Silhouette Value compares the intra-group similarity to closest group similarity. Using K-means approach, the selected 3274 RNA methylation sites are clustered into 3 groups with 1780, 595 and 899 sites, respectively. And in our analysis, the other 3 clustering approaches adapt the same number of clusters for easy comparison. It is worth mentioning that, the optimal number of clusters 3 is determined with a small subset of the data available (10 different conditions), and the actual number of RNA methylation regulatory factors can be much larger with a lot more different cell types.
After applying all 4 clustering approaches to the selected 3274 unique RNA methylation sites, as it can be seen from Figure 8, the methylation sites were divided into 3 clusters. Considering the 4 clustering methods each embraces a different rationale, it is not surprising to see that there exist distinct differences among them. While the BFRM clusters are of approximately similar size, the other 3 algorithms, especially for K-means and HC, generated clusters with quite uneven sizes.
Figure 8. clustering results of 4 approaches.
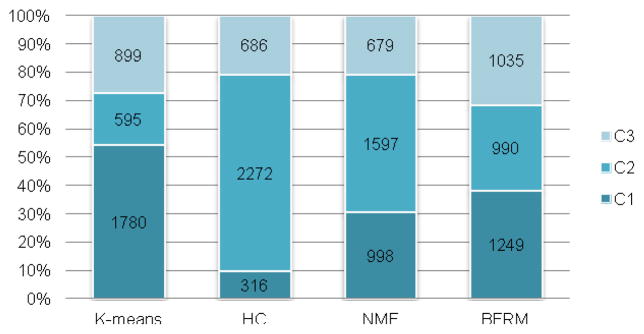
Figure shows the number of peaks in 3 clusters determined by 4 different clustering approaches. The largest cluster was generated by HC with 2272 RNA methylation site (69.4% of 3274). Compared with the other 3 clustering approaches, BFRM generates a well-balanced result with clusters of almost equal size. It is worth mentioning that, the cluster IDs are generated with no specific order, and the clusters generated by different numbers with the same ID are not necessarily corresponding to the same physical RNA co-methylation pattern.
Given the aforementioned clustering results, it is important to check whether different clustering approaches capture relatively consistent co-methylation pattern. For this purpose, we define a new method for evaluating the consistency between two clustering approaches. Given the clustering results of N elements by two methods c = [c1, c2, ···, cN] and r = [r1, r2, ···, rN], where ci, ri ∈ {1,2, ···, K} represents the cluster ID of the i -th element, and K represents the total number of clusters. We first convert the clustering IDs into a pair-wise resembling matrix (PRM) C and R, specifically, for an element in pair-wise resembling matrix ci, j generated from c = [c1, c2, ···, cN], we define,
| (3) |
Intuitively, ci, j represents whether the i -th element and j -th element are from the same cluster. In this way, the clustering results can be converted into a matrix recording whether two elements belong to the same cluster or not, and the conversion is unique and reversible as long as the cluster IDs have no order. The sensitivity and specificity of a clustering result c = [c1, c2, ···, cN] compared with a reference clustering result r = [r1, r2, ···, rN] can be conveniently defined as:
| (4) |
Please note that, by random, the expected value of sensitivity and specificity are 1/K and (K − 1)/K, respectively. And clustering IDs and reference clustering IDs are not switchable, i.e., ρsen (c | r) ≠ ρsen (r | c). We may further define a consistency score ρ when a true reference clustering ID set is not available using,
| (5) |
In this way, the consistency between two clustering results c = [c1, c2, ···, cN] and r = [r1, r2, ···, rN] can be evaluated. It is worth mentioning that, the defined consistent score ρ in (5) have the following good properties: (1) The definition gives a score of 1 when the two clustering results are identical, and gives a score of 0.5 when the two clustering ID sets are totally independent. (2) The definition of ρ is parameter-free. The definition of pair-wise resembling matrix (PRM) in (5) doesn’t require the numbers of clusters are the same for the two clustering results. The consistency of the 4 clustering approaches is then compared pair-wisely, and the result is summarized in Table 3. Not surprisingly, the clustering results are highly correlated and well above the random 0.5 threshold. Specifically, the pair-wise consistency score between K-means, HC and NMF are always larger than 0.7; the only exception is BFRM with much lower consistency with the others. This is not surprising because BFRM represents a rationale fundamentally different from K-means, HC and NMF, i.e., the regulators (or factors) of BFRM model can up- or down-regulate some targets simultaneously, so 2 methylation sites belonging to the same BFRM cluster can be reversely correlated in methylation level. This phenomenon is not possible for the other 3 clusters.
Table 3.
Consistency of the 4 clustering approaches
| K-means | HC | NMF | BFRM | |
|---|---|---|---|---|
| K-means | NA | 0.772 | 0.805 | 0.594 |
| HC | 0.772 | NA | 0.701 | 0.574 |
| NMF | 0.805 | 0.701 | NA | 0.584 |
| BFRM | 0.594 | 0.574 | 0.584 | NA |
The highly consistency between different clustering approaches indicate that co-methylation patterns are successfully captured. To find out whether the identified co-methylation patterns are corresponding to actual RNA methylation regulators, we compared them with the target genes of a known RNA m6A demethylase FTO [26]. Specifically, the FTO target sites in mouse midbrain are firstly identified using exomePeak package based on the m6A MeRIP-Seq data obtained from wild type mouse midbrain and FTO knockout condition [22]. Since it has been shown previously that m6A are conserved between human and mouse, these FTO target sites are lifted to human genome hg19 assembly with UCSC LiftOver tool [38]. Not surprisingly, more than 90% of the lifted FTO target sites overlap with our combinatorial RNA methylome. We then use Fisher’s exact test (FET) to compare with the identified co-methylation patterns are significantly overlapping with the FTO target genes. Multiple hypothesis correction was also conducted to calculate the false discovery rate (FDR) using BH method [39]. As it is shown in Table 4, 3 out of 4 clustering approaches can successfully identify a co-methylation pattern significantly overlapping with FTO targets at significance level 0.05 after multiple hypothesis correction, showing that clustering methods can indeed identify biologically meaningful co-methylation pattern corresponding to the latent regulator of epitranscriptome. The most significant co-methylation pattern overlapping with FTO targets is from NMF with p-value 2.81e-06 and FDR 3.372e-05, suggesting the superior performance of NMF clustering approach over the other 3 methods at the current setting in finding the co-methylation pattern in the epitranscriptome. Interestingly, for all 4 clustering approaches, FTO targets sites are enriched in the largest of the 3 clusters. Indeed, FTO is the first mRNA demethylase discovered and plays a crucial role in human metabolism [5, 6, 29]. It is reasonable to assume FTO is one of the most influential regulators at epitranscriptomic layer. Please note that, the captured RNA co-methylation pattern is not due to any of the transcriptional regulations. Under the ideal case of a reversible chemical reaction, the methylation potential is independent from RNA abundance and determines directly the ratio of methylated and un-modified RNA molecules.
Table 4.
Result of FTO target enrichment analysis
| Algorithms | Cluster ID | # of sites | p-value | FDR | Odds ratio |
|---|---|---|---|---|---|
| K-means | Cluster 1 | 1780 | 0.012 | 0.048 | 1.651 |
| Cluster 2 | 595 | 0.977 | 0.999 | 0.568 | |
| Cluster 3 | 899 | 0.884 | 0.999 | 0.769 | |
|
| |||||
| HC | Cluster 1 | 316 | 0.734 | 0.999 | 0.837 |
| Cluster 2 | 2272 | 0.051 | 0.153 | 1.523 | |
| Cluster 3 | 686 | 0.963 | 0.999 | 0.629 | |
|
| |||||
| NMF | Cluster 1 | 998 | 0.999 | 0.999 | 0.408 |
| Cluster 2 | 1597 | 2.81e-06 | 3.372e-05 | 2.793 | |
| Cluster 3 | 679 | 0.995 | 0.999 | 0.481 | |
|
| |||||
| BFRM | Cluster 1 | 1249 | 0.003 | 0.018 | 1.791 |
| Cluster 2 | 990 | 0.655 | 0.999 | 0.934 | |
| Cluster 3 | 1035 | 0.999 | 0.999 | 0.484 | |
Note: Three out of 4 clustering approaches can successfully identify a co-methylation pattern corresponding to FTO target sites at significance level 0.05 after multiple hypothesis correction. Interestingly, for all 4 clustering approaches, FTO targets sites are enriched in the largest of the 3 clusters. Indeed, FTO is the first mRNA demethylase discovered and plays a crucial role in human metabolism [5, 6, 29]. It is reasonable to assume FTO is one of the most influential regulators at epitranscriptomic layer.
Among the 4 clustering approaches, NMF gives the most biologically significant result (see Figure 9). NMF decomposes the RNA methylome into the product of two non-negative matrices, which essentially assume a regression-like model. Under the framework of NMF, a single methylation site may be regulated by multiple RNA methylation regulators, which is substantially different from Kmeans and HC. The recent identification of METTL3-WTAP-METTL14 RNA methylation complex [24, 27] provides a good example of complex dependence relationship. All 3 genes are required to form an RNA methylation complex. It is worth mentioning that, although the actual regulatory relationship at epitranscriptomic layer is more complex, it doesn’t prohibit using a simpler and more straightforward approach.
Figure 9. Decompose RNA methylome by NMF.

NMF decomposes the RNA methylome into the product of two nonnegative matrices, i.e., the basis components, which represents the loading or regulatory relationship, and the mixture components, which represents the activities of the regulators. Interestingly, although the biological replicates under the same condition are modeled independently by NMF, the estimated regulator activities (mixture coefficients) are highly consistent on the biological replicates from the same or similar conditions. E.g., the activities of regulars are highly consistent on U2OS, HEK293K and HepG2, respectively. The clustering result of NMF is obtained by assigning an RNA methylation site to the factor with the largest absolute value of regulatory coefficient. Please note that, although NMF in theory allows a single RNA methylation site regulated by multiple factors, we consider only the strongest regulator in the analysis.
Conceivably, the 3 clusters of RNA methylation sites identified from NMF are roughly corresponding to 3 regulators of the epitranscriptome, through which different biomolecular functions can be regulated at epitranscriptomic level. To reveal these functions, gene ontology enrichment analysis was conducted with topGO R/Bioconductor package [35] against the Biological processes category of gene ontology database. As it is shown in Figure 10, relative distinct biological functions are enriched in different clusters. There is essentially no overlap in function between different clusters when keeping the top 20 mostly enriched functions for each cluster, indicating the regulatory mechanism at epitranscriptomic level is potentially highly specific.
Figure 10. Gene ontology enrichment result of K-means.

Relative distinct biological functions are enriched in different clusters. There is essentially no overlap in function between different clusters when keeping the top 20 mostly enriched functions for each cluster. This analysis was conducted by topGO R/Bioconductor package [35].
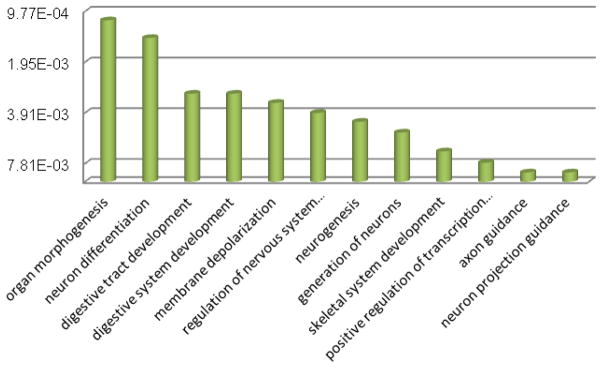
Specifically, the functions enriched in cluster 2, which is corresponding to FTO target sites, are shown in Figure 11. There are a number of important biological functions enriched in this cluster, including, neuron differentiation (p-value 0.0014), neurogenesis (0.0044), etc. Consistent previous studies of FTO, these functions are highly related to neuronal diseases [22] and cancer, indicating the prospect of RNA m6A and FTO studies.
Figure 11. Biological processes in FTO-related co-methylation pattern.
Cluster 3 of K-means result is sharing significantly with FTO targeted genes. A number of important biological functions are enriched in this cluster, including, regulation of neuron apoptotic process (p-value 0.0052), programmed cell death (p-value 0.0451), neuron death (0.0265), neuron apoptotic process, etc. These functions are highly related to neuronal diseases and cancer.
Conclusion and Discussion
In summary, with a newly developed R package RMT, we extracted the combinatorial epitranscriptome of more than 40000 RNA methylation sites from 18 biological replicates obtained under 10 different conditions, and then partially clustered them into 3 groups using 4 different clustering approaches after feature and model selection. The methylation sites belonging to the same cluster are likely to be hyper- and hypo-methylated simultaneously (or co-methylated), indicating that they are regulated by a common RNA methylation factor (methyltransferase or demethylase). We defined a new approach evaluating the consistency between two clustering results and show that, despite the discrepancy between different clustering approaches, the 4 clustering results are still highly correlated, capturing consistent patterns embedded in the epitranscriptome. To examine whether the co-methylation patterns are biologically meaningful, the target RNA methylation sites of a known RNA demethylase (FTO) is identified from mouse and lifted to human, and we show that FTO target sites are significantly overlapping with identified co-methylation pattern. Many important biological functions are significantly enriched and thus may be regulated by different RNA methylation factors at the epitranscriptomic level, a layer of gene regulation that has been missing for decades [14].
Computational reconstruction of the entire RNA methylation network is especially difficult due to the following reasons: Firstly, till this day, only a small number of genes related to RNA methylation are identified [11]. Although it is possible to predict enzyme targets from enzyme knockout dataset, to our best knowledge, no effort has been made so far to computationally predict the target sites of a specific RNA methyltransferase or demethylase. Secondly, so far there are only very limited amount of MeRIP-Seq dataset available. And the methylation levels for lowly expressed genes are difficult to estimate. It is clearly that precision achieved on lowly and highly expressed transcripts are different. From computational perspective, existing methods are not yet optimized for the intrinsic features of MeRIP-Seq, and advanced computational approaches that can take care of this discrepancy are still needed. With more data cumulated and revised mathematical models, it is promising that, future work may more explicitly and specifically associate methylation sites with RNA methylation factors.
Limited by the available data and knowledge, this study provides only the RNA methylation sites that are likely to share a common regulator, but fails to specify what actually those regulators (gene or protein) are. Nevertheless, it demonstrated, for the first time, the feasibility of dissecting the RNA methylome based on the RNA co-methylation patterns induced by RNA methyltransferases and demethylases, implying a promising direction in untangling the RNA methylome based on its regulators, through which, the biological meaning and underlying mechanism can be revealed in a deeper and more concise manner. Conceivably, with the eliminated regulatory relationship, the manipulating of the entire RNA methylome can be achieved through much less number of enzymatic regulators. This work can also inspire RNA methylation is an open question, many methods are not implanted. This work may also potentially be integrated with other related studies, e.g., a joint analysis of RNA methylation sites and transcription starting sites [40–42], or suggests the combinatorial patterns of different post-transcriptional RNA modifications, like in chromatin modifications and transcription factor binding [43, 44].
Supplementary Material
Acknowledgments
We thank the support from National Natural Science Foundation of China (61473232, 61401370, 91430111 and 61170134) to SWZ and JM; National Science Foundation of USA (CCF-1246073) to YH; The graduate starting seed fund of Northwestern Polytechnical University (Z2014145) to YCZ and LL; Fundamental Research Funds for the Central Universities (2014QNB47, 2014QNA84) to LZ and HL. We also thank computational support from the UTSA Computational Systems Biology Core, funded by the National Institute on Minority Health and Health Disparities (G12MD007591) from the National Institutes of Health.
Footnotes
Software Availability: The open source R package “RMT” for extracting combinatorial epitranscriptome from multiple MeRIP-Seq experiments is provided in Supplement Materials.
References
- 1.Bernstein BE, Meissner A, Lander ES. The mammalian epigenome. Cell. 2007 Feb 23;128:669–81. doi: 10.1016/j.cell.2007.01.033. [DOI] [PubMed] [Google Scholar]
- 2.Bock C. Analysing and interpreting DNA methylation data. Nat Rev Genet. 2012 Oct;13:705–19. doi: 10.1038/nrg3273. [DOI] [PubMed] [Google Scholar]
- 3.Laird PW. Principles and challenges of genomewide DNA methylation analysis. Nat Rev Genet. 2010 Mar;11:191–203. doi: 10.1038/nrg2732. [DOI] [PubMed] [Google Scholar]
- 4.He C. Grand challenge commentary: RNA epigenetics? Nat Chem Biol. 2010 Dec;6:863–5. doi: 10.1038/nchembio.482. [DOI] [PubMed] [Google Scholar]
- 5.Fu Y, Dominissini D, Rechavi G, He C. Gene expression regulation mediated through reversible m6A RNA methylation. Nat Rev Genet. 2014 doi: 10.1038/nrg3724. vol. advance online publication. [DOI] [PubMed] [Google Scholar]
- 6.Meyer KD, Jaffrey SR. The dynamic epitranscriptome: N6-methyladenosine and gene expression control. Nat Rev Mol Cell Biol. 2014 doi: 10.1038/nrm3785. vol. advance online publication. [DOI] [PMC free article] [PubMed] [Google Scholar]
- 7.Liebers R, Rassoulzadegan M, Lyko F. Epigenetic Regulation by Heritable RNA. PLoS Genet. 2014;10:e1004296. doi: 10.1371/journal.pgen.1004296. [DOI] [PMC free article] [PubMed] [Google Scholar]
- 8.Desrosiers R, Friderici K, Rottman F. Identification of methylated nucleosides in messenger RNA from Novikoff hepatoma cells. Proceedings of the National Academy of Sciences. 1974;71:3971–3975. doi: 10.1073/pnas.71.10.3971. [DOI] [PMC free article] [PubMed] [Google Scholar]
- 9.Schibler U, Kelley DE, Perry RP. Comparison of methylated sequences in messenger RNA and heterogeneous nuclear RNA from mouse L cells. Journal of molecular biology. 1977;115:695–714. doi: 10.1016/0022-2836(77)90110-3. [DOI] [PubMed] [Google Scholar]
- 10.Dubin DT, Taylor RH. The methylation state of poly A-containing-messenger RNA from cultured hamster cells. Nucleic acids research. 1975;2:1653–1668. doi: 10.1093/nar/2.10.1653. [DOI] [PMC free article] [PubMed] [Google Scholar]
- 11.Machnicka MA, Milanowska K, Osman Oglou O, Purta E, Kurkowska M, Olchowik A, Januszewski W, Kalinowski S, Dunin-Horkawicz S, Rother KM, Helm M, Bujnicki JM, Grosjean H. MODOMICS: a database of RNA modification pathways--2013 update. Nucleic Acids Res. 2013 Jan;41:D262–7. doi: 10.1093/nar/gks1007. [DOI] [PMC free article] [PubMed] [Google Scholar]
- 12.Meyer KD, Saletore Y, Zumbo P, Elemento O, Mason CE, Jaffrey SR. Comprehensive analysis of mRNA methylation reveals enrichment in 3′ UTRs and near stop codons. Cell. 2012 Jun 22;149:1635–46. doi: 10.1016/j.cell.2012.05.003. [DOI] [PMC free article] [PubMed] [Google Scholar]
- 13.Dominissini D, Moshitch-Moshkovitz S, Schwartz S, Salmon-Divon M, Ungar L, Osenberg S, Cesarkas K, Jacob-Hirsch J, Amariglio N, Kupiec M, Sorek R, Rechavi G. Topology of the human and mouse m6A RNA methylomes revealed by m6A-seq. Nature. 2012 May 10;485:201–6. doi: 10.1038/nature11112. [DOI] [PubMed] [Google Scholar]
- 14.Saletore Y, Meyer K, Korlach J, Vilfan ID, Jaffrey S, Mason CE. The birth of the Epitranscriptome: deciphering the function of RNA modifications. Genome Biol. 2012 Oct 31;13:175. doi: 10.1186/gb-2012-13-10-175. [DOI] [PMC free article] [PubMed] [Google Scholar]
- 15.Dominissini D, Moshitch-Moshkovitz S, Salmon-Divon M, Amariglio N, Rechavi G. Transcriptome-wide mapping of N(6)-methyladenosine by m(6)A-seq based on immunocapturing and massively parallel sequencing. Nat Protoc. 2013 Jan;8:176–89. doi: 10.1038/nprot.2012.148. [DOI] [PubMed] [Google Scholar]
- 16.Zhang Y, Liu T, Meyer CA, Eeckhoute J, Johnson DS, Bernstein BE, Nusbaum C, Myers RM, Brown M, Li W. Model-based analysis of ChIP-Seq (MACS) Genome Biol. 2008;9:R137. doi: 10.1186/gb-2008-9-9-r137. [DOI] [PMC free article] [PubMed] [Google Scholar]
- 17.Park PJ. ChIP–seq: advantages and challenges of a maturing technology. Nature reviews genetics. 2009;10:669–680. doi: 10.1038/nrg2641. [DOI] [PMC free article] [PubMed] [Google Scholar]
- 18.Harris RA, Wang T, Coarfa C, Nagarajan RP, Hong C, Downey SL, Johnson BE, Fouse SD, Delaney A, Zhao Y. Comparison of sequencing-based methods to profile DNA methylation and identification of monoallelic epigenetic modifications. Nature biotechnology. 2010;28:1097–1105. doi: 10.1038/nbt.1682. [DOI] [PMC free article] [PubMed] [Google Scholar]
- 19.Meng J, Cui X, Rao MK, Chen Y, Huang Y. Exome-based analysis for RNA epigenome sequencing data. Bioinformatics. 2013 Jun 15;29:1565–1567. doi: 10.1093/bioinformatics/btt171. [DOI] [PMC free article] [PubMed] [Google Scholar]
- 20.Li Y, Song S, Li C, Yu J. MeRIP-PF: an easy-to-use pipeline for high-resolution peak-finding in MeRIP-Seq data. Genomics Proteomics Bioinformatics. 2013 Feb;11:72–5. doi: 10.1016/j.gpb.2013.01.002. [DOI] [PMC free article] [PubMed] [Google Scholar]
- 21.Fustin J-M, Doi M, Yamaguchi Y, Hida H, Nishimura S, Yoshida M, Isagawa T, Masaki Morioka S, Kakeya H, Manabe I, Okamura H. RNA-Methylation-Dependent RNA Processing Controls the Speed of the Circadian Clock. Cell. 2013;155:793–806. doi: 10.1016/j.cell.2013.10.026. [DOI] [PubMed] [Google Scholar]
- 22.Hess ME, Hess S, Meyer KD, Verhagen LA, Koch L, Bronneke HS, Dietrich MO, Jordan SD, Saletore Y, Elemento O, Belgardt BF, Franz T, Horvath TL, Ruther U, Jaffrey SR, Kloppenburg P, Bruning JC. The fat mass and obesity associated gene (Fto) regulates activity of the dopaminergic midbrain circuitry. Nat Neurosci. 2013 Aug;16:1042–8. doi: 10.1038/nn.3449. [DOI] [PubMed] [Google Scholar]
- 23.Schwartz S, Agarwala SD, Mumbach MR, Jovanovic M, Mertins P, Shishkin A, Tabach Y, Mikkelsen TS, Satija R, Ruvkun G. High-Resolution Mapping Reveals a Conserved, Widespread, Dynamic mRNA Methylation Program in Yeast Meiosis. Cell. 2013 doi: 10.1016/j.cell.2013.10.047. [DOI] [PMC free article] [PubMed] [Google Scholar]
- 24.Liu J, Yue Y, Han D, Wang X, Fu Y, Zhang L, Jia G, Yu M, Lu Z, Deng X, Dai Q, Chen W, He C. A METTL3-METTL14 complex mediates mammalian nuclear RNA N6-adenosine methylation. Nat Chem Biol. 2014;10:93–95. doi: 10.1038/nchembio.1432. [DOI] [PMC free article] [PubMed] [Google Scholar]
- 25.Wang Y, Li Y, Toth JI, Petroski MD, Zhang Z, Zhao JC. N6-methyladenosine modification destabilizes developmental regulators in embryonic stem cells. Nat Cell Biol. 2014 doi: 10.1038/ncb2902. vol. advance online publication. [DOI] [PMC free article] [PubMed] [Google Scholar]
- 26.Jia G, Fu Y, Zhao X, Dai Q, Zheng G, Yang Y, Yi C, Lindahl T, Pan T, Yang Y-G. N6-methyladenosine in nuclear RNA is a major substrate of the obesity-associated FTO. Nature chemical biology. 2011;7:885–887. doi: 10.1038/nchembio.687. [DOI] [PMC free article] [PubMed] [Google Scholar]
- 27.Ping X-L, Sun B-F, Wang L, Xiao W, Yang X, Wang W-J, Adhikari S, Shi Y, Lv Y, Chen Y-S, Zhao X, Li A, Yang Y, Dahal U, Lou X-M, Liu X, Huang J, Yuan W-P, Zhu X-F, Cheng T, Zhao Y-L, Wang X, Danielsen JMR, Liu F, Yang Y-G. Mammalian WTAP is a regulatory subunit of the RNA N6-methyladenosine methyltransferase. Cell Res. 2014 doi: 10.1038/cr.2014.3. [DOI] [PMC free article] [PubMed] [Google Scholar]
- 28.Khoddami V, Cairns BR. Identification of direct targets and modified bases of RNA cytosine methyltransferases. Nat Biotechnol. 2013 May;31:458–64. doi: 10.1038/nbt.2566. [DOI] [PMC free article] [PubMed] [Google Scholar]
- 29.Lee M, Kim B, Kim VN. Emerging Roles of RNA Modification: m6A and U-Tail. cell. 2014;158:980–987. doi: 10.1016/j.cell.2014.08.005. [DOI] [PubMed] [Google Scholar]
- 30.Carmel R, Jacobsen DW. Homocysteine in health and disease. Cambridge University Press; 2001. [Google Scholar]
- 31.Kim D, Pertea G, Trapnell C, Pimentel H, Kelley R, Salzberg SL. TopHat2: accurate alignment of transcriptomes in the presence of insertions, deletions and gene fusions. Genome Biol. 2013;14:R36. doi: 10.1186/gb-2013-14-4-r36. [DOI] [PMC free article] [PubMed] [Google Scholar]
- 32.Przyborowski J, Wilenski H. Homogeneity of results in testing samples from Poisson series: With an application to testing clover seed for dodder. Biometrika. 1940;31:313–323. [Google Scholar]
- 33.Carvalho CM, Chang J, Lucas JE, Nevins JR, Wang Q, West M. High-Dimensional Sparse Factor Modeling: Applications in Gene Expression Genomics. J Am Stat Assoc. 2008 Dec 1;103:1438–1456. doi: 10.1198/016214508000000869. [DOI] [PMC free article] [PubMed] [Google Scholar]
- 34.Lee DD, Seung HS. Algorithms for non-negative matrix factorization. Advances in neural information processing systems. 2001:556–562. [Google Scholar]
- 35.Alexa A, Rahnenfuhrer J. R package version 2.8. 2010. topGO: enrichment analysis for gene ontology. [Google Scholar]
- 36.Machanick P, Bailey TL. MEME-ChIP: motif analysis of large DNA datasets. Bioinformatics. 2011 Jun 15;27:1696–1697. doi: 10.1093/bioinformatics/btr189. [DOI] [PMC free article] [PubMed] [Google Scholar]
- 37.Lawrence M, Huber W, Pages H, Aboyoun P, Carlson M, Gentleman R, Morgan MT, Carey VJ. Software for computing and annotating genomic ranges. PLoS Comput Biol. 2013 Aug;9:e1003118. doi: 10.1371/journal.pcbi.1003118. [DOI] [PMC free article] [PubMed] [Google Scholar]
- 38.Lawrence M, Carey V, Gentleman R, XML I, IRanges L, Lawrence MM. Package ‘rtracklayer’. 2013. [Google Scholar]
- 39.Benjamini Y, Hochberg Y. Controlling the false discovery rate: a practical and powerful approach to multiple testing. Journal of the Royal Statistical Society. Series B (Methodological) 1995:289–300. [Google Scholar]
- 40.Chen W, Lei T-Y, Jin D-C, Lin H, Chou K-C. PseKNC: A flexible web server for generating pseudo K-tuple nucleotide composition. Analytical biochemistry. 2014;456:53–60. doi: 10.1016/j.ab.2014.04.001. [DOI] [PubMed] [Google Scholar]
- 41.Guo S-H, Deng E-Z, Xu L-Q, Ding H, Lin H, Chen W, Chou K-C. iNuc-PseKNC: a sequence-based predictor for predicting nucleosome positioning in genomes with pseudo k-tuple nucleotide composition. Bioinformatics. 2014 Jun 1;30:1522–1529. doi: 10.1093/bioinformatics/btu083. [DOI] [PubMed] [Google Scholar]
- 42.Chen W, Feng P-M, Deng E-Z, Lin H, Chou K-C. iTIS-PseTNC: A sequence-based predictor for identifying translation initiation site in human genes using pseudo trinucleotide composition. Analytical Biochemistry. 2014;462:76–83. doi: 10.1016/j.ab.2014.06.022. [DOI] [PubMed] [Google Scholar]
- 43.Ferraris L, Stewart AP, Kang J, DeSimone AM, Gemberling M, Tantin D, Fairbrother WG. Combinatorial binding of transcription factors in the pluripotency control regions of the genome. Genome research. 2011;21:1055–1064. doi: 10.1101/gr.115824.110. [DOI] [PMC free article] [PubMed] [Google Scholar]
- 44.Kato M, Hata N, Banerjee N, Futcher B, Zhang MQ. Identifying combinatorial regulation of transcription factors and binding motifs. Genome biology. 2004;5:R56. doi: 10.1186/gb-2004-5-8-r56. [DOI] [PMC free article] [PubMed] [Google Scholar]
Associated Data
This section collects any data citations, data availability statements, or supplementary materials included in this article.