

Abstract
Background
Delineation of the relative temporal trajectories of specific cognitive measures associated with Alzheimer’s disease (AD) is important for evaluating preclinical markers and monitoring disease progression.
Methods
We characterized the temporal trajectories of measures of verbal episodic memory, short-term visual memory, and mental status using data from 895 participants in the Baltimore Longitudinal Study of Aging.
Results
The California Verbal Learning Test (CVLT) immediate recall was the first measure to decline, followed by CVLT delayed recall. However, further along the disease progression scale, CVLT delayed recall and visual memory changed more rapidly than CVLT immediate recall.
Conclusions
Our findings reconcile reports of early changes in immediate recall with greater reliance on delayed recall performance in clinical settings. Moreover, the utility of cognitive markers in evaluating AD progression depends on the stage of cognitive decline, suggesting that optimal endpoints in therapeutic trials may vary across different stages of the disease process.
Keywords: Disease progression score, California Verbal Learning Test, Alzheimer’s disease, Memory
1. Introduction
Examining the longitudinal progression of biomarkers implicated in Alzheimer’s disease (AD) using data-driven methods is important for evaluating early indicators of disease, monitoring disease progression at the individual level, and validating proposed disease progression models. A detailed study of longitudinal trajectories of functions affected earliest in AD is likely to benefit efforts in identifying measures sensitive to changes in the preclinical stage of disease, thus allowing for more appropriate selection of outcome measures in clinical trials.
Jedynak et al. recently proposed a method to investigate the temporal evolution of disease progression using selected cognitive and biological markers related to AD and applied this method to data from the Alzheimer’s Disease Neuroimaging Initiative (ADNI) (1). In addition to estimating the longitudinal trajectories that best describe the biomarker data for the entire sample, the method calculates an Alzheimer’s Disease Progression Score (ADPS) for each participant based on the participant’s own biomarker measurements.
Despite the versatility of the ADPS method in allowing for the characterization of the longitudinal changes in cognitive measures, the neuropsychological tests considered in the analysis performed on the ADNI data were limited to one test of verbal episodic memory (Rey Auditory Verbal Learning Test delayed recall) and two tests of overall mental status (Mini-Mental Status Examination and AD Assessment Scale-cognitive subscale), in addition to four anatomic and physiologic biomarkers. The analysis highlighted the Rey Auditory Verbal Learning Test delayed recall score as the earliest changing marker among the seven considered, indicating the importance of further analyzing the progression of measures of episodic memory in AD.
Episodic memory is involved in learning and retaining new pieces of information over a period of delay. Both cross-sectional and longitudinal studies show that episodic memory is the earliest and most severely affected cognitive domain in AD (2, 3). While numerous studies have emphasized the importance of declines in learning with repeated trials (as reflected in a total learning score across immediate recall trials) and short and long delayed recall performance on tests of verbal episodic memory as early indicators of AD (4–9), there is no consensus as to whether immediate or delayed recall is affected earlier within the domain of verbal episodic memory. Furthermore, the temporal relationships among trajectories of measures of episodic memory have not been characterized in detail.
The purpose of our study was to define the relationships among longitudinal trajectories of early cognitive indicators of AD-related cognitive decline and to compare their rates of change over the course of cognitive impairment using the ADPS methodology proposed by Jedynak et al. To this end, we evaluated AD-related measures of episodic memory performance, including immediate and delayed verbal episodic memory, short-term visual episodic memory, and indicators of mental status within the data-driven ADPS framework to construct a temporal model of cognitive performance in a group of older individuals from the Baltimore Longitudinal Study of Aging (BLSA). Our model provides information on the earliest cognitive changes as well as differences among indicators of episodic memory and other cognitive measures in rates of progression at different disease stages.
2. Methods
2.1 Participants
The analyses were based on data from 895 participants (mean age 70.1, SD 8.4) enrolled in the Baltimore Longitudinal Study of Aging (BLSA) with at least two longitudinal visits. Visits without Mini-Mental State Examination (MMSE) (10) scores were not considered. All available visits meeting these requirements were included in the analysis, including data acquired after onset of cognitive impairment and AD. The cognitively impaired (CI, n=149) group includes all subjects who had a cognitive deficit in at least one cognitive domain but were not affected in their social or functional abilities, e.g. participants with mild cognitive impairment (MCI), as well as those who subsequently met the Diagnostic and Statistical Manual of Mental Disorders 3-R criteria (11) for dementia and the National Institute of Neurological and Communicative Disorders and Stroke–Alzheimer’s Disease and Related Disorders Association criteria(12) for AD based on neuropsychological diagnostic tests and clinical data. The number of subjects in the CI group who were cognitively normal at baseline but eventually developed MCI or AD is 93 and 12, respectively. The CI group additionally included 18 participants with MCI at baseline who developed AD, 20 participants with stable MCI and 6 with stable AD diagnoses throughout the visits considered in this study. The interval between baseline and onset of cognitive impairment for the CI subjects who started as cognitively normal was 6.45±3.86 years. Sample characteristics are presented in Table 1.
Table 1.
Participant demographics and scores on cognitive tests at baseline, grouped by final cognitive status.
| Final cognitive status | CN, n=746 | CI, n=149 | Entire sample*, n=895 |
|---|---|---|---|
| Age at baseline, mean (SD), y | 68.4 (7.7) | 78.3 (7.1) | 70.1 (8.4) |
| Education, mean (SD), y | 16.4 (2.5) | 16.4 (2.4) | 16.4 (2.5) |
| Male, No. (%) | 425 (57.0%) | 86 (57.7%) | 511 (57.1%) |
| White, No. (%) | 540 (72.4%) | 132 (88.6%) | 672 (75.1%) |
| BMI, mean (SD) | 27.1 (4.3) | 25.7 (3.7) | 26.8 (4.3) |
| Smoking status, No. (%) | |||
| Never | 311 (41.7%) | 60 (40.3%) | 371 (41.5%) |
| Former | 386 (51.7%) | 80 (53.7%) | 466 (52.1%) |
| Current | 28 (3.8%) | 7 (4.7%) | 35 (3.9%) |
| Alcohol intake, No. (%) | |||
| None | 287 (38.5%) | 46 (30.9%) | 333 (37.2%) |
| <1 drink per day | 222 (29.8%) | 51 (34.2%) | 273 (30.5%) |
| ≥1 drink per day | 217 (29.1%) | 50 (33.6%) | 267 (29.8%) |
| Hypertension, No. (%) | |||
| No | 445 (59.6%) | 88 (59.1%) | 533 (59.6%) |
| Yes | 281 (37.7%) | 59 (39.6%) | 340 (38.0%) |
| Diabetes, No. (%) | |||
| No | 672 (90.1%) | 141 (94.6%) | 813 (90.8%) |
| Yes | 54 (7.2%) | 6 (4.0%) | 60 (6.7%) |
| Prior cardiovasc. disease†, No. (%) | |||
| No | 689 (92.4%) | 139 (93.3%) | 828 (92.5%) |
| Yes | 37 (5.0%) | 8 (5.4%) | 45 (5.0%) |
| Number of visits, mean (SD) | 5.3 (3.2) | 5.1 (2.9) | 5.3 (3.2) |
| Interval between visits, mean (SD), y | 1.89 (1.0) | 1.74 (1.0) | 1.87 (1.0) |
| Scores on cognitive tests at baseline, mean (SD) | |||
| MMSE | 28.7 (1.5) | 27.7 (2.2) | 28.5 (1.7) |
| BMS | 1.3 (1.7) | 2.1 (2.5) | 1.4 (1.9) |
| CVLT immediate recall | 52.5 (10.9) | 43.3 (11.3) | 51.0 (11.5) |
| CVLT short delayed free recall | 10.4 (3.2) | 7.7 (3.4) | 10.0 (3.4) |
| CVLT long delayed free recall | 11.0 (3.2) | 8.4 (3.4) | 10.6 (3.4) |
| BVRT error | 5.4 (3.8) | 8.8 (4.3) | 6.0 (4.1) |
CN = cognitively normal; CI = cognitively impaired; MMSE = Mini-Mental State Examination; BMS = Blessed Information Memory Concentration Score; CVLT = California Verbal Learning Test; BVRT = Benton Visual Retention Test.
Education information was missing for 4 participants, BMI for 29, and smoking status for 23. A total of 22 participants had missing values for alcohol intake, hypertension, diabetes, and prior cardiovascular disease.
Defined as myocardial infarction or congestive heart failure.
2.2. Cognitive outcome measures
We studied cognitive markers that provide measures of episodic memory and mental status. We used the California Verbal Learning Test (CVLT) (13) to assess verbal episodic memory. Three outcome measures of the CVLT were selected for analysis: immediate recall (the sum of the total recall across five trials), short delayed free recall and long delayed free recall scores. To assess visual episodic memory, we used the Benton Visual Retention Test (BVRT) (14) error score. Additionally, the Blessed Information Memory and Concentration Scale (BMS) (15) and MMSE were included in the analyses to provide information on the overall cognitive status of the participants. Average scores on cognitive tests at baseline are presented in Table 1, and longitudinal cognitive test scores are presented in Figure 1. Some cognitive measures were not available for all visits; however, the amount of missing data was minimal. The cognitive measure that had the greatest percentage of missing data in the entire sample at baseline was CVLT long delayed free recall with less than 2% missing data. CVLT and BVRT were not available during clinical consensus case conferences, whereas MMSE and BMS measures of mental status were available as part of a neuropsychological screening battery.
Figure 1.

Cognitive data versus age. Cognitively normal and impaired individuals are indicated by black and green dots, respectively. CVLT = California Verbal Learning Test; CVLT-sum = CVLT immediate recall; CVLT-frs = CVLT short delayed free recall; CVLT-frl = CVLT long delayed free recall; BVRT = Benton Visual Retention Test error score; BMS = Blessed Information Memory Concentration score; MMSE = Mini-Mental State Exam.
2.3. Statistical analyses
ADPS(1) was computed for 895 participants using the six cognitive measures. The ADPS method estimates a single longitudinal trajectory for each cognitive marker in the model and provides a score indicative of disease progression for each subject visit based on the cognitive measures. The method assumes that AD-related cognitive impairment begins at different ages and progresses at different rates across individuals. The underlying premise of the method is that we can estimate and adjust for such differences using the subjects’ longitudinal data to create a standardized space of cognitive trajectories characterized by a disease progression score (the ADPS).
The procedure involves mapping each subject’s longitudinal cognitive marker trajectories into the standardized ADPS space with the constraint that the mapping must preserve the relative spacing between consecutive visits of a given subject. The aim is to find the mappings that will minimize the variance of the subject-specific longitudinal trajectories in the ADPS space for each cognitive marker in the model. The variance is a measure of the deviation of the standardized individual trajectories from the idealized sigmoidal curve that represents a population average estimated from the standardized trajectories. The horizontal axis of the standardized space corresponds to the ADPS, which is an estimate of disease progression based on the cognitive markers, and the vertical axis corresponds to the cognitive measures in the model. The ADPS calculated for each subject visit as a result of this fitting procedure is a linear transformation of the subject’s age, and it is based on where the subject’s cognitive marker data lie in the standardized space. The two parameters of this linear transformation are the intercept and the slope representing rate of disease progression. The model fitting process involves first estimating the cognitive trajectories using data across all subjects and visits. The subject-specific parameters are then estimated by finding the best correspondence for each subject on the cognitive trajectories. The trajectories and subject-specific parameters are further refined within an iterative framework until the model converges. Note that diagnostic information about the participants is not used by the method, meaning that the resulting sigmoid fits for each marker are obtained using only the underlying marker data and age of the participants. A mathematical description of the ADPS model is included in the Appendix.
The bounds of the sigmoid fits to CVLT immediate recall, CVLT delayed recall, and MMSE scores were fixed at the minimum and maximum possible values of the tests (0 to 80, 0 to 16, and 0 to 30, respectively). No bounds were specified for the BVRT error score or BMS error score.
The midpoint of an estimated sigmoid trajectory in the standardized space is referred to as the inflection point, and it corresponds to the ADPS value beyond which the particular cognitive marker would be considered abnormal. We computed 90% confidence intervals for the inflection points of each cognitive marker by bootstrapping in order to quantify the reliability of the fitted sigmoid curves. This process involved randomly resampling from the subjects to create 200 datasets that are of equal size as the original sample, applying the ADPS methodology to the new datasets, and observing the inflection points of each cognitive marker. The confidence intervals indicate the variability across the bootstrap trials of the estimated inflection points but do not provide information regarding the significance of their temporal ordering. Although the inflection point for a given biomarker might shift from one bootstrap experiment to the next, its relative position compared to other markers may not change, as all inflection points are likely to shift in the same direction by a similar amount. Thus, two-sided Wilcoxon rank-sum tests were used to quantify the statistical significance of the temporal ordering of inflection points and the differences in slope magnitudes for the fitted curves using the bootstrap results.
Additionally, we applied permutation tests to quantify the statistical significance of the temporal ordering of the CVLT measures and the differences in their rates of progression. To test a pair of markers, we first generated a distribution representing the null hypothesis that the inflection points of the two markers occurred at the same time by randomly permuting the cognitive scores for the two markers, running the sigmoid fitting algorithm on this permuted dataset, and measuring the difference between the inflection points of the two markers being tested. The separation between the inflection points for the original fits was then quantified against this null hypothesis by calculating its z-score and the associated two-tailed p-value.
3. Results
The inflection points and slopes of the fitted sigmoid curves are presented in Table 2. The sigmoid fits captured the longitudinal data and resulted in relative separation of the CN and CI groups along the fitted curves as a function of the calculated ADPS for each subject and visit (Figure 2). The difference in the calculated ADPS was significant between the CN and CI groups at baseline (−0.13 SD 1.03 for CN and 0.62 SD 1.07 for CI, two-sided Wilcoxon rank-sum test p<0.0001) and at last visit (−0.03 SD 1.36 for CN and 1.91 SD 1.00 for CI, p<0.0001). Similar results were obtained in an age-matched subsample of CN and CI individuals (supplementary data).
Table 2.
Parameters of fitted sigmoid curves.
| Cognitive marker | Inflection point*, mean (SD) | Slope at inflection point†, mean (SD) |
|---|---|---|
| CVLT immediate recall | 0.98 (0.05) | −0.65 (0.02) |
| CVLT short delayed free recall | 0.67 (0.05) | −1.05 (0.04) |
| CVLT long delayed free recall | 0.81 (0.05) | −1.13 (0.04) |
| BVRT error | 1.75 (0.59) | 1.03 (0.24) |
| BMS | 3.32 (0.31) | 1.31 (0.18) |
| MMSE | 4.04 (0.24) | −0.82 (0.06) |
Parameter summary statistics were calculated using the results on the 200 bootstrap samples. MMSE = Mini-Mental State Examination; BMS = Blessed Information Memory Concentration Score; CVLT = California Verbal Learning Test; BVRT = Benton Visual Retention Test.
Inflection point is in ADPS units.
Equivalently, this is the maximum slope of the fitted sigmoid curves normalized to the [0,1] range, in units of normalized cognitive score per ADPS. Negative slopes indicate decline in cognitive score over time. To obtain the sigmoid curves in Figure 3, absolute values of the slopes were used.
Figure 2.

Sigmoid fits (gray) superimposed on spaghetti plots of fitted data points. Inflection point of each sigmoid curve is indicated with a gray dot. The horizontal axis represents the ADPS estimated for each subject. Longitudinal data points are connected by black lines for individuals who remained cognitively normal throughout the study and by green lines for the cognitively impaired. Red lines were used for subjects who started out as cognitively normal but then became impaired. ADPS = Alzheimer’s Disease Progression Score; CVLT = California Verbal Learning Test; CVLT-sum = CVLT immediate recall; CVLT-frs = CVLT short delayed free recall; CVLT-frl = CVLT long delayed free recall; BVRT = Benton Visual Retention Test error score; BMS = Blessed Information Memory Concentration score; MMSE = Mini-Mental State Exam.
CVLT immediate recall score was the first cognitive measure to show decline (Figure 3). Further along the progression scale, CVLT delayed free recall and BVRT error scores showed more rapid changes than CVLT immediate recall score. Despite the fact that declines in CVLT immediate recall were detectable before declines in the delayed free recall scores, the CVLT immediate recall score passed the threshold between normal and abnormal after the delayed free recall scores, as indicated by the inflection points of the sigmoid fits and associated confidence intervals determined via bootstrapping. BVRT error score, on the other hand, exhibited its inflection point after that of the CVLT immediate recall score. Changes in BMS and MMSE were detectable later along the progression scale, with BMS inflection point occurring before that of MMSE. Wilcoxon rank-sum tests on the slopes and inflection points of the fitted sigmoid curves in the bootstrap samples showed statistical significance (p<0.0001) for each of the results mentioned above.
Figure 3.
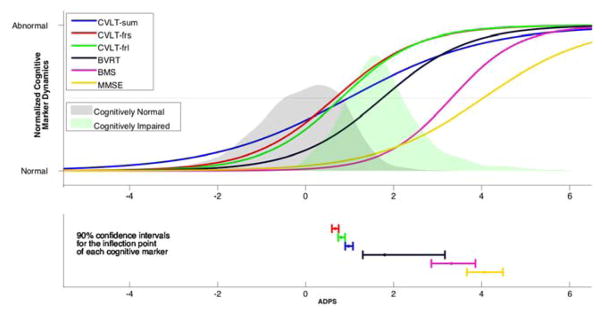
Sigmoid fits for the cognitive markers as a function of the estimated ADPS (top), and the 90% confidence intervals for the inflection points (bottom). The horizontal axis represents the ADPS estimated for each subject. The probabilities of having a certain ADPS conditioned on cognitive status are reflected by the gray and green shaded areas, with gray corresponding to the probabilities associated with the CN individuals and green corresponding to CI. Although we provide confidence intervals around inflection point estimates, statistical significance of their temporal ordering was based on permutation tests. ADPS = Alzheimer’s Disease Progression Score; CVLT = California Verbal Learning Test; CVLT-sum = CVLT immediate recall; CVLT-frs = CVLT short delayed free recall; CVLT-frl = CVLT long delayed free recall; BVRT = Benton Visual Retention Test error score; BMS = Blessed Information Memory Concentration score; MMSE = Mini-Mental State Exam.
The findings of the bootstrap analysis regarding the temporal ordering of the inflection points of the CVLT measures were further confirmed by permutation tests. We found that the difference in the temporal localization of the inflection points of the three CVLT scores with respect to each other was statistically significant (two-tailed p<0.0001 for all three pairwise comparisons).
4. Discussion
This study characterized the temporal trajectories of six cognitive measures that show decline in AD, using a scale reflecting the underlying progression of cognitive impairment and AD. In particular, we focused on measures of episodic memory and mental status. Our evaluation of three CVLT scores revealed a longitudinal progression pattern that is initially characterized by declines in immediate recall but later dominated by declines in delayed recall. The BVRT visual memory error score was found to exhibit changes after the CVLT scores, with a rate of change similar to that of delayed recall. BMS and MMSE measures of mental status showed changes further along the computed progression scale. Our results show that cognitive markers exhibit different levels of responsiveness to progression based on disease stage as revealed by the slopes of the estimated trajectories. These findings have important implications for the design of clinical trials and suggest that optimal endpoints in determining successful therapeutic outcomes will vary across different stages of disease.
Previous studies have shown that CVLT immediate recall and delayed recall scores are useful in distinguishing between normal controls, MCI, and AD (8), as well as in predicting conversion to AD (5, 9). Consistent with these studies, we found that CVLT immediate recall and delayed recall scores showed the earliest changes associated with disease progression. Our model showed that while CVLT immediate recall score begins to change first, changes in delayed free recall scores surpass the threshold between normal and abnormal before CVLT immediate recall. These findings suggest that immediate recall is more informative during earlier preclinical stages of disease for risk assessment and monitoring, whereas delayed recall scores, due to their more rapid progression curves, are better indicators later in the disease process.
In one study that assessed the performance of several cognitive markers for both classification and prediction of individuals, the total learning score on the CVLT was found to be the episodic memory measure that best distinguished between MCI and healthy controls, followed closely by the delayed recall trial (16). On the other hand, CVLT delayed recall scores significantly outperformed total learning scores in predicting conversion from MCI to AD. Since our model shows that changes in immediate recall are detectable earlier, it is in agreement with the report that CVLT immediate recall scores yield a higher accuracy than delayed recall scores in distinguishing MCI from healthy controls. Based on our results, CVLT delayed scores would be expected to have greater rates of decline than the immediate recall scores within the MCI population, which supports the finding by Rabin et al. (16) that delayed compared with immediate recall scores show better performance as predictors of conversion to AD.
Among other studies that have compared the performance of immediate recall and delayed recall tests of episodic verbal memory, there is no consensus regarding their relative accuracy and predictive value. In one study, the Rey Auditory Verbal Learning Test (RAVLT) short delayed recall was the most significant neuropsychological test in 5- and 10-year follow-ups to emerge as a predictor of AD (17). In another, short-delay cued recall score on the CVLT(18) was the neuropsychological test that best discriminated stable and declining questionable AD subjects from controls (19). In yet another study, both the total learning and delayed recall scores of the RAVLT predicted progression to AD and classified between MCI and normal aging (20), and another group of investigators found long delayed total recall (CVLT free and cued) combined with Mini-Mental State Examination to be the best predictor of MCI progression onto AD (21).
Our model helps explain the variability in the findings of previous studies evaluating the relative performance of the immediate recall and delayed recall scores in classification and prediction tasks. Given the heterogeneity of individuals within a particular clinical status group, it is likely that some individuals will be in relatively earlier stages of disease and some in later stages. As group-wise comparisons often do not take the temporal stage into account and treat every individual within a given group the same way, such heterogeneities within clinical diagnostic groups may bias results, particularly in smaller samples. As our model shows, declines in CVLT immediate recall score appear earlier but show a slower progression than the delayed recall scores. Thus, studies including MCI groups with individuals at earlier stages of disease, who may be less likely to show marked declines in delayed recall, may show that immediate recall scores provide more accurate classification of MCI individuals against healthy controls. However, if the MCI group contains individuals who are in a later stage of disease progression, then the delayed recall scores will perform better than immediate recall in this classification task.
In addition to characterizing the temporal trajectories of the cognitive markers, our model allows for the calculation of a single score, ADPS, describing the estimated disease stage of a given individual based on longitudinal cognitive measures. ADPS obtained from more elaborate models consisting of additional AD-related biomarkers could be highly useful in monitoring disease progression, identifying biomarkers that are expected to show marked change given the individual’s disease score, and providing a more thorough risk assessment regarding the individual’s future health.
The separation observed in the calculated ADPS between the CN and CI individuals in our model supports our choice of cognitive markers as indicators of disease progression. Note that no CVLT or BVRT measure was used to determine the clinical diagnoses of the participants. Even though BMS and MMSE measures were considered in the determination of clinical diagnoses, these two cognitive markers were reflective of disease progression only in the later stages of disease as revealed by the fitted trajectories. Thus, the separation in ADPS between the CN and CI groups cannot be attributed to the group differences in these two cognitive measures.
In our sample, we observe that the change in ADPS per year, as given by the subject-specific slope parameter, is positively associated with ADPS. We can integrate the average slope estimates along the ADPS axis to calculate the average time in years between two given ADPS values. This approach shows that an ADPS of 1.91, which is the mean ADPS value at the last visit for the CI group, and an ADPS of −0.13, which is the mean ADPS value at baseline for the CN group, are separated by 7.68 years.
A limitation of our study is that the relatively low number of impaired individuals does not provide sufficient statistical power to determine the accuracy of the cognitive markers in the task of classification between healthy normal and MCI subjects or in the task of prediction of conversion from MCI to AD. An ideal study design to characterize longitudinal cognitive changes in preclinical AD should include large numbers of subjects who were initially normal and followed repeatedly through various stages of disease progression, in addition to a control group consisting of individuals who remain cognitively normal throughout the study. The strength of our dataset is the well-characterized sample and large number of follow-up visits available for each subject, which makes it suitable for a longitudinal analysis.
There are no established thresholds in the literature discriminating normal from abnormal values for the cognitive measures considered in this work. Our definition of the inflection point as the midway point of the minimum and maximum values of the fitted sigmoid curve is arbitrary and not necessarily reflective of the threshold at which a given cognitive measure would be considered abnormal. We used the inflection points to quantify the statistical significance of the temporal ordering of the fitted sigmoid curves via confidence intervals and permutation tests. For a different choice of inflection points, the associated values of statistical significance could be different. Nevertheless, our inflection point definition is consistent across all measures considered in the model and changing the abnormality threshold does not affect the fitting process that was used to obtain the sigmoid curves.
In conclusion, our results indicate that immediate recall scores of verbal memory tests may be more reflective of disease progression at the earliest preclinical stages of AD compared to delayed recall scores, but that delayed recall scores are more powerful indicators later in the disease due to their faster decline. It is necessary to evaluate this finding using different statistical tools as well as measures of episodic verbal memory other than CVLT, and to replicate the ADPS model in other similar datasets. Future work in larger samples with longer follow-up intervals will also evaluate additional neuropsychological outcomes, MRI measures, and other markers hypothesized to show early preclinical changes in AD.
Research in Context.
1. Systematic Review
We searched PubMed for “episodic memory”, “preclinical”, “California verbal learning test”, and “Alzheimer”. Our review indicated no consensus regarding the earliest changing test of episodic memory or the accuracy of different tests in predicting the stages of AD.
2. Interpretation
Immediate recall scores of verbal memory tests are more reflective of disease progression at the earliest preclinical stages of AD, but delayed recall scores are more powerful indicators later due to their faster decline. Such temporal dependence of the sensitivity of biomarkers in reflecting disease progression suggests that outcome measures, including clinical trial endpoints, should be carefully tailored to disease stage.
3. Future directions
Our findings will be extended using different statistical tools, other measures of episodic memory and cognition, and replicated in other samples. Future work in larger samples with longer follow-up intervals will also evaluate additional biomarkers of early preclinical changes in AD.
Acknowledgments
This research was supported by the Intramural Research Program, National Institute on Aging, NIH.
Abbreviations
- AD
Alzheimer’s Disease
- ADPS
Alzheimer’s Disease Progression Score
- BLSA
Baltimore Longitudinal Study of Aging
- BMS
Blessed information Memory concentration Score
- BVRT
Benton Visual Retention Test error score
- CI
Cognitively Impaired
- CN
Cognitively Normal
- CVLT
California Verbal Learning Test
- CVLT-frl
CVLT long delayed free recall
- CVLT-frs
CVLT short delayed free recall
- CVLT-sum
CVLT immediate recall score summed across five trials
- MCI
Mild Cognitive Impairment
- MMSE
Mini-Mental State Examination
Appendix
Statistical model for ADPS
The linear transformation between the age tij of subject i at visit j and the ADPS sij is given by
where αi and βi are the subject parameters to be estimated that indicate the rate and onset of disease, respectively.
The longitudinal trajectory of biomarker k is assumed to be sigmoidal and can be written as a function of ADPS s as
where θk = (ak, bk, ck, dk) are the model parameters to be estimated. The minimum and maximum values of the sigmoid function, given by dk and ak + dk respectively, can be fixed in the model by specifying the values of these two parameters if the biomarker under consideration is bounded. The inflection point of the sigmoid, defined as the point where the second derivative is zero, occurs at s = ck. The slope at the inflection point is given by akbk/4.
The observed values of the biomarkers differ from the idealized biomarker trajectory f by observation noise. The observed value yijk of biomarker k for subject i at visit j is given by
where εijk are assumed to be independent standard normal random variables, and σk is a parameter characterizing the biomarker observation noise that will be estimated from the data.
The maximum likelihood estimates for the subject and model parameters are then found by minimizing the negative log likelihood
The minimization of this function involves iterative optimization using alternating least squares. The particular implementation of the minimization procedure is described in (1).
Footnotes
Publisher's Disclaimer: This is a PDF file of an unedited manuscript that has been accepted for publication. As a service to our customers we are providing this early version of the manuscript. The manuscript will undergo copyediting, typesetting, and review of the resulting proof before it is published in its final form. Please note that during the production process errors may be discovered which could affect the content, and all legal disclaimers that apply to the journal pertain.
References
- 1.Jedynak BM, Lang A, Liu B, Katz E, Zhang Y, Wyman BT, et al. A computational neurodegenerative disease progression score: Method and results with the Alzheimer’s disease neuroimaging initiative cohort. Neuroimage. 2012 Aug 3;63(3):1478–1486. doi: 10.1016/j.neuroimage.2012.07.059. [DOI] [PMC free article] [PubMed] [Google Scholar]
- 2.Bäkman L, Jones S, Berger AK, Laukka EJ, Small BJ. Cognitive impairment in preclinical Alzheimer’s disease: A meta-analysis. Neuropsychology. 2005 Jul;19(4):520–31. doi: 10.1037/0894-4105.19.4.520. [DOI] [PubMed] [Google Scholar]
- 3.Grober E, Hall CB, Lipton RB, Zonderman AB, Resnick SM, Kawas C. Memory impairment, executive dysfunction, and intellectual decline in preclinical Alzheimer’s disease. J Int Neuropsychol Soc. 2008 Mar;14(2):266–78. doi: 10.1017/S1355617708080302. [DOI] [PMC free article] [PubMed] [Google Scholar]
- 4.Albert MS. Preclinical predictors of Alzheimer’s disease. Brain Cogn. 1997;35:284–285. [Google Scholar]
- 5.Albert MS, Moss MB, Tanzi R, Jones K. Preclinical prediction of AD using neuropsychological tests. J Int Neuropsychol Soc. 2001 Jul;7(5):631–9. doi: 10.1017/s1355617701755105. [DOI] [PubMed] [Google Scholar]
- 6.Chen P, Ratcliff G, Belle SH, Cauley JA, DeKosky ST, Ganguli M. Cognitive tests that best discriminate between presymptomatic AD and those who remain nondemented. Neurology. 2000 Dec 26;55(12):1847–53. doi: 10.1212/wnl.55.12.1847. [DOI] [PubMed] [Google Scholar]
- 7.Tierney MC, Szalai JP, Snow WG, Fisher RH, Nores A, Nadon G, et al. Prediction of probable Alzheimer’s disease in memory-impaired patients: A prospective longitudinal study. Neurology. 1996 Mar;46(3):661–5. doi: 10.1212/wnl.46.3.661. [DOI] [PubMed] [Google Scholar]
- 8.Greenaway MC, Lacritz LH, Binegar D, Weiner MF, Lipton A, Munro Cullum C. Patterns of verbal memory performance in mild cognitive impairment, Alzheimer disease, and normal aging. Cogn Behav Neurol. 2006 Jun;19(2):79–84. doi: 10.1097/01.wnn.0000208290.57370.a3. [DOI] [PubMed] [Google Scholar]
- 9.Silva D, Guerreiro M, Maroco J, Santana I, Rodrigues A, Bravo Marques J, et al. Comparison of four verbal memory tests for the diagnosis and predictive value of mild cognitive impairment. Dementia and Geriatric Cognitive Disorders Extra. 2012;2(1):120–131. doi: 10.1159/000336224. [DOI] [PMC free article] [PubMed] [Google Scholar]
- 10.Folstein MF, Folstein SE, McHugh PR. “Mini-mental state” A practical method for grading the cognitive state of patients for the clinician. J Psychiatr Res. 1975 Nov;12(3):189–98. doi: 10.1016/0022-3956(75)90026-6. [DOI] [PubMed] [Google Scholar]
- 11.American Psychiatric Association. Diagnostic and statistical manual of mental disorders. 3. Washington, DC: American Psychiatric Association; 1987. rev. ed. [Google Scholar]
- 12.McKhann G, Drachman D, Folstein M, Katzman R, Price D, Stadlan EM. Clinical diagnosis of Alzheimer’s disease: Report of the NINCDS-ADRDA work group under the auspices of department of health and human services task force on Alzheimer’s disease. Neurology. 1984 Jul;34(7):939–44. doi: 10.1212/wnl.34.7.939. [DOI] [PubMed] [Google Scholar]
- 13.Delis DC, Kramer JH, Kaplan E, Ober BA. California verbal learning test: Adult version. San Antonio, TX: Psychological Corporation; 1987. [Google Scholar]
- 14.Benton AL. The revised benton visual retention test. New York, NY: Psychological Corporation; 1974. [Google Scholar]
- 15.Blessed G, Wilson ID. The contemporary natural history of mental disorder in old age. Br J Psychiatry. 1982 Jul;141:59–67. doi: 10.1192/bjp.141.1.59. [DOI] [PubMed] [Google Scholar]
- 16.Rabin LA, Pare N, Saykin AJ, Brown MJ, Wishart HA, Flashman LA, et al. Differential memory test sensitivity for diagnosing amnestic mild cognitive impairment and predicting conversion to Alzheimer’s disease. Neuropsychol Dev Cogn B Aging Neuropsychol Cogn. 2009 May;16(3):357–76. doi: 10.1080/13825580902825220. [DOI] [PMC free article] [PubMed] [Google Scholar]
- 17.Tierney MC, Yao C, Kiss A, McDowell I. Neuropsychological tests accurately predict incident Alzheimer disease after 5 and 10 years. Neurology. 2005 Jun 14;64(11):1853–9. doi: 10.1212/01.WNL.0000163773.21794.0B. [DOI] [PubMed] [Google Scholar]
- 18.Delis DC, Kramer JH, Kaplan E, Ober BA. California verbal learning test- second edition: Adult version manual. San Antonio, TX: Psychological Corporation; 2000. [Google Scholar]
- 19.Lekeu F, Magis D, Marique P, Delbeuck X, Bechet S, Guillaume B, et al. The california verbal learning test and other standard clinical neuropsychological tests to predict conversion from mild memory impairment to dementia. J Clin Exp Neuropsychol. 2010 Feb;32(2):164–73. doi: 10.1080/13803390902889606. [DOI] [PubMed] [Google Scholar]
- 20.Estevez-Gonzalez A, Kulisevsky J, Boltes A, Otermin P, Garcia-Sanchez C. Rey verbal learning test is a useful tool for differential diagnosis in the preclinical phase of Alzheimer’s disease: Comparison with mild cognitive impairment and normal aging. Int J Geriatr Psychiatry. 2003 Nov;18(11):1021–8. doi: 10.1002/gps.1010. [DOI] [PubMed] [Google Scholar]
- 21.Pozueta A, Rodriguez-Rodriguez E, Vazquez-Higuera JL, Mateo I, Sanchez-Juan P, Gonzalez-Perez S, et al. Detection of early Alzheimer’s disease in MCI patients by the combination of MMSE and an episodic memory test. BMC Neurol. 2011 Jun 24;11:78, 2377-11-78. doi: 10.1186/1471-2377-11-78. [DOI] [PMC free article] [PubMed] [Google Scholar]