

Abstract
Background
The cost implication of variability in pancreatic surgery is not well described. It was hypothesized that for a pancreaticoduodenectomy (PD), lower volume centres demonstrate worse peri-operative outcomes at higher costs.
Methods
From 2009–2011, 9883 patients undergoing a PD were identified from the University HealthSystems Consortium (UHC) database and stratified into quintiles by annual hospital case volume. A decision analytic model was constructed to assess cost effectiveness. Total direct cost data were based on Medicare cost/charge ratios and included readmission costs when applicable.
Results
The lowest volume centres demonstrated a higher peri-operative mortality rate (3.5% versus 1.3%, P < 0.001) compared with the highest volume centres. When both index and readmission costs were considered, the per-patient total direct cost at the lowest volume centres was $23 005, or 10.9% (i.e. $2263 per case) more than at the highest volume centres. One-way sensitivity analyses adjusting for peri-operative mortality (1.3% at all centres) did not materially change the cost effectiveness analysis. Differences in cost were largely recognized in the index admission; readmission costs were similar across quintiles.
Conclusions
For PD, low volume centres have higher peri-operative mortality rates and 10.9% higher cost per patient. Performance of PD at higher volume centres can lead to both better outcomes and substantial cost savings.
Introduction
Pancreatic malignancy, currently the 4th leading cause of cancer-related death in the United States, is a complex disease process.1 From distinct screening and diagnostic challenges, to sophisticated and complex surgical intervention, to the issue of marginally effective chemotherapy and radiation therapy, the resources devoted to treating this disease process are substantial. This reality, unfortunately, is set in a context of increased health care utilization restraints, with health care spending projected (and feared) to become 25% of United States gross domestic product (GDP) by the year 2025.2 In spite of current legislative efforts to curb this unsustainable spending through the Affordable Care Act, there is no question that health care providers will need to demonstrate high-quality, lower cost care as our delivery system evolves.3
These constraints are clearly relevant to pancreatic cancer surgery, as the high costs and substantial nihilism regarding this disease process will only be amplified.4–7 To the credit of the pancreatic cancer surgical community and dedicated outcomes researchers, there has already been substantial progress in demonstrating which providers can deliver optimal patient care.8–14 Perhaps most convincingly, multiple investigators have shown that high volume centres and surgeons are critical to minimizing peri-operative mortality, complications, and readmissions.8,9,11,12,14 Furthermore, variables such as National Cancer Institute (NCI) designation, university affiliation, and patient-specific factors are also critical in achieving the best clinical outcomes possible.
In spite of these clear data regarding optimal patient-centre-provider matching, complex pancreatic surgery continues to be provided at low volume centres.15 This truth is a frustration that reflects many individual components: patients' inability (or unwillingness) to travel, lack of a structured referral system, and substantial financial incentives for providers to ‘hold on’ to patients in spite of the recognition that their patients' outcomes may prove more optimal in a different system. That these obstacles to optimal patient care continue to directly impact outcomes is both unacceptable and an opportunity to improve care.
Although each of the aforementioned obstacles is significant, and do not have simple answers, financial compensation is a component of health care delivery that may be the single most important driver by which to effect change. Specifically, reimbursing providers and centres which perform well, and refusing to pay poor-performing outliers, would quickly divert patients towards high-functioning, lower cost centres. Not only would this punitive/reward strategy save millions of dollars in cancer care, but may also lead to better results for patients. To address this issue, we investigated key peri-operative outcomes and their relationship to cost with the hypothesis that centres that perform complex pancreatic surgery at a high volume demonstrate better clinical outcomes at lower costs.
Methods
Patient selection and stratification
The University HealthSystems Consortium (UHC) is an alliance of 120 academic medical centres and 299 of their affiliated hospitals which compiles a database of previously validated administrative-level institutional data.16 This dataset was queried for all patients who underwent a pancreaticoduodenectomy (PD) with the International Disease Classification version 9 (ICD-9) code 52.7 during the 3-year time period from 2009 through 2011. Patients with a Medicare-severity diagnosis-related group (MS-DRG) coding of 405 (major complication[s] and/or comorbidity/ies), 406 (minor complication[s] and/or comorbidity/ies), or 407 (no complication or comorbidity) throughout their index admission were identified and included in further analysis. Using this cohort, the hospitals at which the patients underwent surgery were stratified into quintiles (i.e. lowest, low, middle, high and highest volume centres) based upon the number of PD's performed at each centre annually. Patient data were then collated and further analysed as part of this volume designated cohort. A cost effectiveness analysis was performed utilizing the peri-operative mortality rate (defined as any post-operative death prior to discharge from the index admission) and the median patient-case total direct cost across volume quintiles. The total direct cost, referred to as ‘cost’ throughout the manuscript, reflects cost from a societal perspective (i.e. reimbursement).
Decision analytic model
A decision analytic model (TreeAge Software, Williamstown, MA, USA) was constructed to incorporate key clinical variables and outcomes (Fig. 1). These included centre volume, peri-operative mortality, patient-specific DRG, readmission status and cost data. Specifically, cost included both index hospitalization and the first readmission cost, when applicable. Cost was calculated by applying hospital-specific Medicare cost-to-charge ratios as reported to Medicare (then reported to UHC), and incorporating region-specific differences in wages and labour cost. Based on model probability inputs and costs, results were reported in terms of cost per index admission or readmission.
Figure 1.
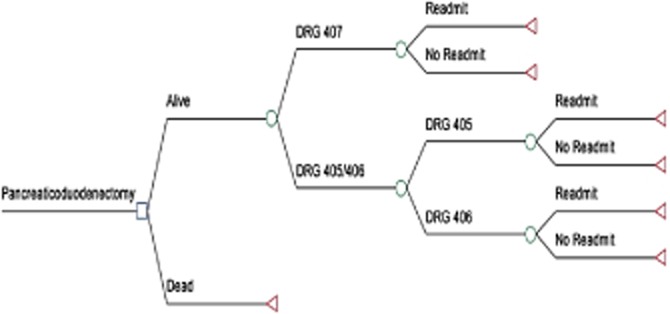
Decision analytic tree demonstrating elements of the cost-effectiveness model constructed, including centre volume, peri-operative mortality, patient-specific diagnosis-related group (DRG), readmission rate and overall cost. A (DRG) code of 405 denotes a patient with a major comorbidity or complication, 406 denotes a patient with a minor comorbidity or complication, and 407 denotes a patient without comorbidity or complication
Deterministic sensitivity analyses were performed to test the robustness of our conclusions by altering key clinical variables within the model. Specifically, we varied peri-operative mortality at each individual centre by applying the mortality rate at the highest volume centre (i.e. 1.3%) to all centres. This rate was chosen to test the model at the most extreme end of the observed clinical results, and also to make results clinically meaningful in terms of quality improvement; no quality improvement initiative should aim to duplicate the results of the worst performing hospitals.
Statistical analysis
Parametric variables were compared across quintiles with analysis of variance (anova) whereas non-parametric variables were compared across quintiles with Pearson's chi-square tests. All statistical analyses were performed using SAS Statistical software 9.3 (SAS Institute Inc., Cary, NC, USA) and SigmaPlot software v11.0 (Systat Software, Inc., San Jose, CA, USA) with a P-value of <0.05 deemed significant.
Results
Hospital volume quintile stratification
A total of 9883 patients were identified within the UHC dataset and included for further analysis. Patients were further stratified according to the annual number of PD's performed at each institution during the given year, yielding a cohort of approximately 2000 patients per volume cohort (Fig. 2). Stratifying by annual case volume, a ‘lowest’ volume institution performed approximately 1–22 cases, a ‘low’ volume institution performed approximately 23–36 cases, a ‘middle’ volume institution performed approximately 37–56 cases, a ‘high’ volume institution performed approximately 57–90 cases and a ‘highest’ volume institution performed greater than approximately 97 cases per year; slight variations in quintile cut-offs existed across years throughout the study period. The median age of all patients was 65 years [interquartile range (IQR) 53–69 years] with a roughly even male/female distribution. Patient age and gender breakdown did not differ significantly across volume quintiles.
Figure 2.
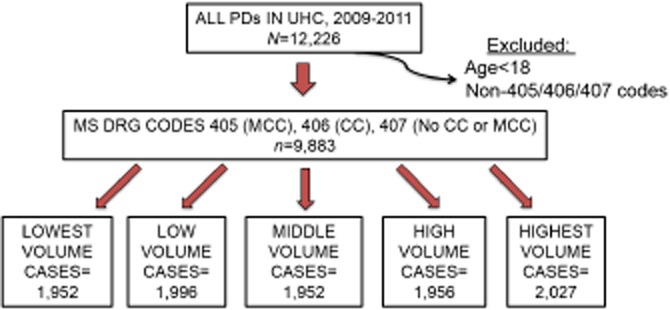
Pancreaticoduodenectomy patients were identified from the University HealthSystems Consortium clinical database and resource manager and stratified into quintiles by the annual case volume of the hospital at which he or she underwent resection. PD, pancreaticoduodenectomy; UHC, University HealthSystems Consortium; MS DRG, Medicare severity diagnosis-related group; MCC, major comorbidity or complication; CC, minor comorbidity or complication
Cost effectiveness analysis
The median total direct cost of a single patient undergoing a PD across all quintiles was $21 775. Stratified by volume quintile, the median total direct cost per patient varied across quintile: $23 005 per case for the lowest volume quintile, $21 588 per case for the low volume quintile, $23 287 for the middle volume quintile, $20 300 for the high volume quintile and $20 742 for the highest volume quintile (Fig. 3a). Analysis of the total direct cost of each patient's care at the highest volume centres was approximately 10% less compared with the cost of care at the lowest volume centres, a savings of approximately $2000 per patient-case (P < 0.01).
Figure 3.
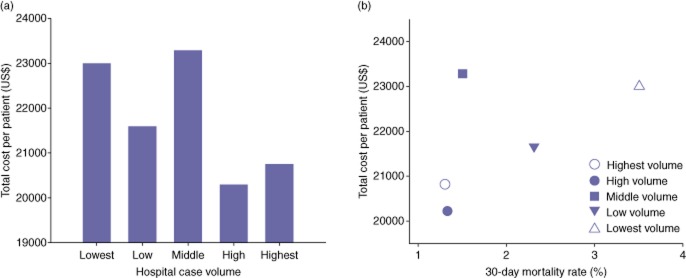
(a) The median total direct cost of each patient-case across volume quintiles. A significant volume–cost association was noted across quintiles (P < 0.01). (b) The cost effectiveness plot demonstrates improved peri-operative mortality at lower costs at higher volume institutions compared with lower volume institutions
Total direct cost data were further analysed in an attempt to identify exactly where these cost discrepancies existed. First, stratified by DRG code applied during the index admission, those patients with DRG codes of 407 (i.e. patients without significant comorbidities or post-operative complications) demonstrated lower index admission costs than those patients with DRG codes of 405 (major comorbidities and/or complications) or 406 (minor comorbidities and/or complications); this discrepancy held true across all quintiles (Table 1). Additionally, the lowest volume centres consistently demonstrated higher costs per patient during the index admission. When costs associated solely with readmission were analysed across quintiles, no significant differences existed across DRG codes or across volume quintiles.
Table 1.
Total direct costs for index admission and readmission by DRG
| Index admission cost by MS DRG | Lowest | Low | Middle | High | Highest | P |
|---|---|---|---|---|---|---|
| 407 | ||||||
| No readmission | $16 930 | $14 996 | $16 771 | $15 592 | $15 041 | 0.05 |
| Readmission | $18 103 | $15 964 | $17 741 | $15 575 | $16 103 | <0.001 |
| 406 | ||||||
| No readmission | $19 610 | $17 292 | $19 672 | $16 901 | $17 393 | <0.001 |
| Readmission | $21 307 | $19 007 | $20 624 | $17 430 | $18 930 | <0.001 |
| 405 | ||||||
| No readmission | $26 034 | $22 133 | $25 464 | $21 208 | $22 747 | <0.001 |
| Readmission | $28 664 | $26 239 | $26 323 | $25 678 | $26 276 | 0.69 |
| Death | $45 119 | $49 005 | $52 528 | $45 690 | $37 808 | 0.60 |
| Readmission Cost by index MS DRG | ||||||
| 407 | $5 554 | $4 273 | $5 052 | $5 022 | $5 402 | 0.48 |
| 406 | $6 092 | $5 453 | $6 093 | $5 072 | $5 572 | 0.41 |
| 405 | $5 711 | $7 617 | $6 620 | $5 323 | $7 389 | 0.18 |
MS DRG, Medicare severity diagnosis-related group; 407, MS DRG code applied to patient without comorbidity of complication; 406, MS DRG code applied to patients with minor comorbidity or complication; 405, MS DRG code applied to patients with major comorbidity or complication.
We next sought to determine whether a relationship existed between hospital volume, peri-operative mortality and total direct cost. For example, the two highest volume quintiles demonstrated median costs of $20 300 to $20 742 per patient to achieve mortality rates of 1.3% to 1.5% (Fig. 3b). Comparatively, the two lowest volume quintiles demonstrated median costs of $21 588 to $23 005 to achieve mortality rates of 2.3 to 3.5%. The two highest volume quintiles not only demonstrated improved peri-operative mortality compared with lower volume centres, but they did so at a substantial cost savings.
Sensitivity analysis
When applying the peri-operative mortality rate of the highest volume centres (1.3%) to all centres, the median total direct costs within each quintile did not significantly change as compared with the base case (Table 2). Based on this model, even in the most optimal scenario, if hospitals within the lowest volume quintile were able to theoretically reduce their peri-operative mortality rate from 3.5% to 1.3%, they would only reduce their base cost from $23 005 to $22 501 per patient. In spite of this apparent reduction in cost, institutions within the highest volume quintiles still experience a cost savings of approximately $1800 per patient to achieve the same post-operative outcome.
Table 2.
Sensitivity analysis
| Volume quintile | Base cost/patient (US$) | Base cost if all centres experienced the same mortality rate of the highest volume centre (1.3%) |
|---|---|---|
| Lowest volume | $23 005 | $22 501 |
| Low volume | $21 588 | $21 307 |
| Middle volume | $23 387 | $23 227 |
| High volume | $20 300 | $20 248 |
| Highest volume | $20 742 | $20 742 |
Discussion
In this study, we have demonstrated an association between optimal short-term patient outcomes and the financial costs associated with achieving those outcomes. Specifically, we have shown that the centres performing the highest volume of pancreaticoduodenectomies annually demonstrate the lowest peri-operative mortality rates at lower costs to patients and to the healthcare system.
A number of the findings in our study deserve special mention. First, it should be recognized that the differences in cost are rooted entirely in the index hospitalization – i.e. differences in total direct cost across volume quintiles appear to be explained by the cost discrepancies within the index admissions themselves, rather than discrepancies in costs associated with readmission. A significant contributing factor to increased cost at the lowest volume centres is the significantly increased duration of overall stay (11 versus 8 days, P < 0.01) as well as duration of care received within the surgical intensive care unit (2 versus 1 days, P < 0.01) compared with the highest volume hospitals. Although there was some variation in readmission costs based on initial hospital DRG, these events were rare enough that they were not statistically significant. This discovery enforces the notion that savings from readmission are likely to be realized by reducing the absolute number of readmissions rather than precisely where that patient goes for that readmission and for what intervention(s). Second, these differences in cost between high and low volume centres were consistent across all diagnosis-related group codes that populated our model. This variability in index hospital total direct costs, skewed significantly in favour of the highest volume centres, should provide increased motivation and pressure to develop and standardize commonly accepted practice patterns that may minimize excess resource utilization. Enhanced recovery after surgery programmes that include early enteral feeding, encourage early ambulation and arrangement of home health care services are one of several scenarios that could be implemented to hypothetically minimize the use of excess hospital resources.
Furthermore, the analysis of cost compared with charge data should be highlighted. Over 20 years ago, a research investigation in the state of Maryland addressed a similar association between economic and outcome issues studied herein.17 However, with respect to finances, that research group utilized hospital charges rather than costs. As we increasingly understand, there are significant differences between ‘charges’ and ‘costs’ associated with surgical procedures and subsequent hospitalizations. A hospital system may effectively charge whatever its administrative ‘chargemaster’ dictates, without any reflection about what the costs of services provided are or what the societal (i.e. payer) costs truly are; as such, charges do not represent the most meaningful financial data available to analyse the economic impact of a particular complex surgical operation. By incorporating total direct costs rather than charges into our analysis, we are able to provide a more reasonable and accurate estimate of resource utilization from a societal perspective (at least in the Medicare population).
There are limitations to our study. UHC is an administrative dataset in which, while reporting a multitude of clinical variables with great accuracy, disease-specific complications are not reliably reported. Similarly, the database currently lacks the ability to perform risk-adjusted analyses on patient outcomes such as post-operative complications and peri-operative mortality. Although these data would be of interest, those analyses were not the focus of this investigation. Our goal was to study broader scale outcomes and cost metrics, and while complication data would be valuable, they are only a component of the summary data that we report here. Second, our cost data reflect Medicare payment, which certainly does not apply to all patients and payers. Unfortunately, all-payer data from either insurers or hospitals are exceedingly difficult to ascertain, and the proprietary nature of them do not lend themselves to routine publication. Third, as the UHC database lacks such granular data as operative time, radiographical imaging and specifics regarding interventional procedures, it is difficult to ascertain which element(s) of the index admission contribute most significantly to discrepancies in cost effective care. The field of pancreatic surgery would benefit from future studies designed to identify and investigate these potential contributors to differences in cost. Lastly, as the UHC database collects data primarily from tertiary care academic centres and their affiliated hospitals, conclusions drawn from these data may not always be accurately extrapolative to all hospitals nationwide.
In spite of these limitations, we believe these data have significant real-world implications. Convincing data about high volume surgery and their superior outcomes have been known for over 20 years, yet lower volume, less-experienced providers continue to perform pancreaticoduodenectomies. In reality, the only way such practice patterns may change is if institutions that reliably report sub-optimal outcomes are no longer reimbursed for these operations. To that end, based on our data demonstrating both better outcomes and lower costs at higher volume centers, it may be reasonable for insurers, both public and private, to limit reimbursements for complex hepato-pancreatico-biliary surgery for hospitals consistently demonstrating outcomes below well-established national benchmarks. While this may not be popular throughout the health care community, it is a consideration that may help improve the cost effectiveness of pancreatic cancer surgery.
Conflicts of interest
None declared.
References
- 1.World Cancer Research Fund International. 2014. Pancreatic Cancer. Available at: http://www.wcrf.org/cancer_statistics/data_specific_cancers/pancreatic_cancer_statistics.php (last accessed 12 January )
- 2.Munoz E, Munoz W, 3rd, Wise L. National and surgical health care expenditures, 2005–2025. Ann Surg. 2010;251:195–200. doi: 10.1097/SLA.0b013e3181cbcc9a. [DOI] [PubMed] [Google Scholar]
- 3.Azvolinsky A. Academic medical centers fear squeeze from Affordable Care Act. Nat Med. 2014;20:106. doi: 10.1038/nm0214-106. [DOI] [PubMed] [Google Scholar]
- 4.Short MN, Aloia TA, Ho V. The influence of complications on the costs of complex cancer surgery. Cancer. 2014;120:1035–1041. doi: 10.1002/cncr.28527. [DOI] [PMC free article] [PubMed] [Google Scholar]
- 5.Bardou M, Le Ray I. Treatment of pancreatic cancer: a narrative review of cost-effectiveness studies. Best Pract Res Clin Gastroenterol. 2013;27:881–892. doi: 10.1016/j.bpg.2013.09.006. [DOI] [PubMed] [Google Scholar]
- 6.Cooper M, Newman NA, Ibrahim AM, Lam E, Herman JM, Singh VK, et al. Unnecessary tests and procedures in patients presenting with solid tumors of the pancreas. J Gastrointest Surg. 2013;17:1218–1223. doi: 10.1007/s11605-013-2213-6. [DOI] [PMC free article] [PubMed] [Google Scholar]
- 7.Sullivan R, Peppercorn J, Sikora K, Zalcberg J, Meropol NJ, Amir E, et al. Delivering affordable cancer care in high-income countries. Lancet Oncol. 2011;12:933–980. doi: 10.1016/S1470-2045(11)70141-3. [DOI] [PubMed] [Google Scholar]
- 8.Birkmeyer JD, Finlayson SR, Tosteson AN, Sharp SM, Warshaw AL, Fisher ES. Effect of hospital volume on in-hospital mortality with pancreaticoduodenectomy. Surgery. 1999;125:250–256. [PubMed] [Google Scholar]
- 9.Birkmeyer JD, Siewers AE, Finlayson EV, Stukel TA, Lucas FL, Batista I, et al. Hospital volume and surgical mortality in the United States. N Engl J Med. 2002;346:1128–1137. doi: 10.1056/NEJMsa012337. [DOI] [PubMed] [Google Scholar]
- 10.Finlayson EV, Goodney PP, Birkmeyer JD. Hospital volume and operative mortality in cancer surgery: a national study. Arch Surg. 2003;138:721–725. doi: 10.1001/archsurg.138.7.721. discussion 6. [DOI] [PubMed] [Google Scholar]
- 11.Birkmeyer JD, Stukel TA, Siewers AE, Goodney PP, Wennberg DE, Lucas FL. Surgeon volume and operative mortality in the United States. N Engl J Med. 2003;349:2117–2127. doi: 10.1056/NEJMsa035205. [DOI] [PubMed] [Google Scholar]
- 12.Reames BN, Ghaferi AA, Birkmeyer JD, Dimick JB. Hospital volume and operative mortality in the modern era. Ann Surg. 2013 doi: 10.1097/SLA.0000000000000375. Dec 23 [Epub ahead of print] [DOI] [PMC free article] [PubMed] [Google Scholar]
- 13.Brennan MF. Quality pancreatic cancer care: it's still mostly about volume. J Natl Cancer Inst. 2009;101:837–838. doi: 10.1093/jnci/djp138. [DOI] [PubMed] [Google Scholar]
- 14.Brennan MF, Radzyner M, Rubin DM. Outcome–more than just operative mortality. J Surg Oncol. 2009;99:470–477. doi: 10.1002/jso.21174. [DOI] [PubMed] [Google Scholar]
- 15.Hayman AV, Fisher MJ, Kluz T, Merkow RP, Wang EC, Bentrem DJ. Is Illinois heeding the call to regionalize pancreatic surgery? J Surg Oncol. 2013;107:685–691. doi: 10.1002/jso.23310. [DOI] [PubMed] [Google Scholar]
- 16.University HealthSystems Consortium. 2014. About UHC. Available at: https://www.uhc.edu/12443.htm (last accessed 12 January )
- 17.Sosa JA, Bowman HM, Gordon TA, Bass EB, Yeo CJ, Lillemoe KD, et al. Importance of hospital volume in the overall management of pancreatic cancer. Ann Surg. 1998;228:429–438. doi: 10.1097/00000658-199809000-00016. [DOI] [PMC free article] [PubMed] [Google Scholar]