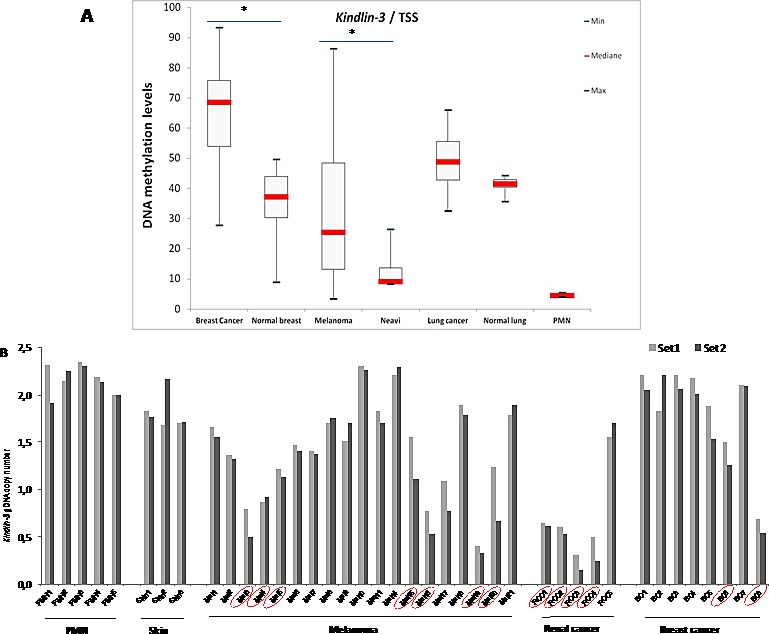
Figure 2. Kindlin-3 gene regulation in human tumors A.

Kindlin-3 DNA methylation as a candidate mechanism for inactivation in cancer: DNA methylation levels in cancer versus normal tissues Boxplots obtained by the analysis of the median levels at the TSS (transcription start site) (AMP2). DNA methylation levels in tumor tissues are compared to normal corresponding samples as well as to peripheral mononuclear cells (PMN). Median levels are shown by the bar, boxplots delineate the Interquartile range; bars show the minimal and maximal values. Differences were assessed by the non-parametric Mann-Whitney Test; *, P <0.05. B. Kindlin-3 deletion identified as a candidate mechanism for Kindlin-3 inactivation in cancer Copy-number variations (CNVs) of gDNAs using qPCR (grey and black by Kindlin-3 primer set 1 and 2, respectively) and recurrence across distinct melanoma, kidney and breast cancer patients (positives surrounded or circled in red). PMN and skin samples were used for diploid gDNAs.
