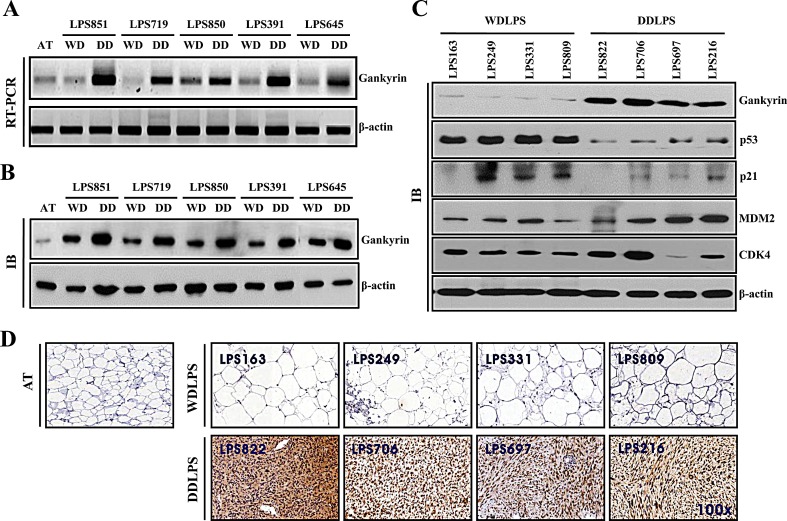
Figure 2. Comparison of protein expression levels in WDLPS and DDLPS.
Relative gankyrin mRNA levels (A) and protein levels (B) in each WDLPS (WD) and DDLPS (DD) component of WD/DDLPS specimens. AT is normal adipose tissue, and β-actin was used as an internal control. (C) Expression of proteins in WDLPS and DDLPS tissues were detected by immunoblot. (D) Immunohistochemical staining of gankyrin in pure WDLPS and DDLPS tissues. AT was used as a negative control (original magnification, 100x).

