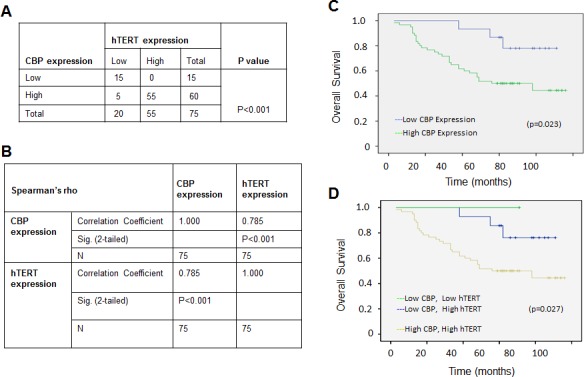
Figure 5. The positive correlation between CBP and hTERT protein expression in lung adenocarcinoma specimens, and a comparatively poor prognosis indicated by the higher expression of CBP and hTERT.

(A) The correlation between CBP and hTERT protein in lung adenocarcinoma tissues (P < 0.001, χ2 tests). (B) The correlation between CBP and hTERT protein in lung cancer tissues. (P<0.01, 2-tailed test). (C) Kaplan–Meier analysis of overall survival of lung cancer patients with different CBP expression (p<0.05, log-rank test). (D) Kaplan–Meier analysis of overall survival of lung cancer patients with different CBP and hTERT expression (p<0.05, log-rank test).
