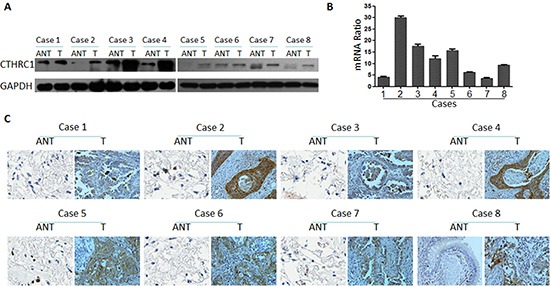
Figure 2. CTHRC1 overexpression in primary NSCLC tissues compared to the corresponding adjacent non-cancerous tissues from the same patient.

(A) Western blotting analysis of CTHRC1 expression in each of the primary NSCLC tissue (T) and adjacent non-cancerous tissue (ANT) from the same patient. (B) The average tumor: adjacent non-cancerous tissue (T:ANT) ratios of CTHRC1 expression were quantified by real-time RT-PCR. Expression levels were normalized for β-actin. Error bars represent mean ± SD from three independent experiments (*p<0.05). (C) IHC confirmed that the CTHRC1 protein was significantly elevated in primary NSCLC tissues (T) compared to that of corresponding adjacent non-cancerous tissues (ANT) from the same patient.
